In the Chinese language, the word “crisis” is composed of two symbols. One represents “danger” and the other “opportunity”.
Markets today are in a crisis. On Monday, the S&P 500 fell 225 points, or 7.6%. The Dow Jones dropped 2,013 points, or 7.8%. Crude oil fell over 30% at one point over the weekend, and interest rates are at the lowest level in recorded human history.
This has indeed been an historic move lower, at least with regards to the speed at which it has occurred.
As the Chinese word symbolizes, there is both danger and opportunity in the current crisis.
At IronBridge, we follow many indicators to gauge the underlying health of the markets. Over the past week, nearly every one of them have been at levels that typically accompany major market lows. During times of panic, like the period we find ourselves in today, it does not pay to sell. It pays to have prudence and patience, while mapping out changes that need to occur when the markets give us the inevitable bounce.
A major component of our investment process is to back-test specific rules that govern our process. One situation we have back-tested involves periods where markets experience quick, heightened risk. What our findings show is that reducing risk during these periods of intense selling pressure actually does more harm than good, at least when specific conditions exist. This risk reduction would make you feel good at the time, but it has dramatically negative affects on long-term portfolio returns.
The reason is that when these periods occur, it typically happens during bull markets. Declines happen quickly and powerfully, and eventually the trend higher resumes. In longer-term bear markets, selling is more gradual and persistent, instead of fast and furious.
The trade-off is that you may have to experience slightly higher volatility in the short-run. So over a 2-3 week period, we may see bigger swings in portfolio values because we don’t have quite the level of cash that we might otherwise have during more frequent, but more orderly selloffs.
Let’s walk through a few quick charts showing just how intense this selling pressure has been, then discuss what we are doing in client portfolios.
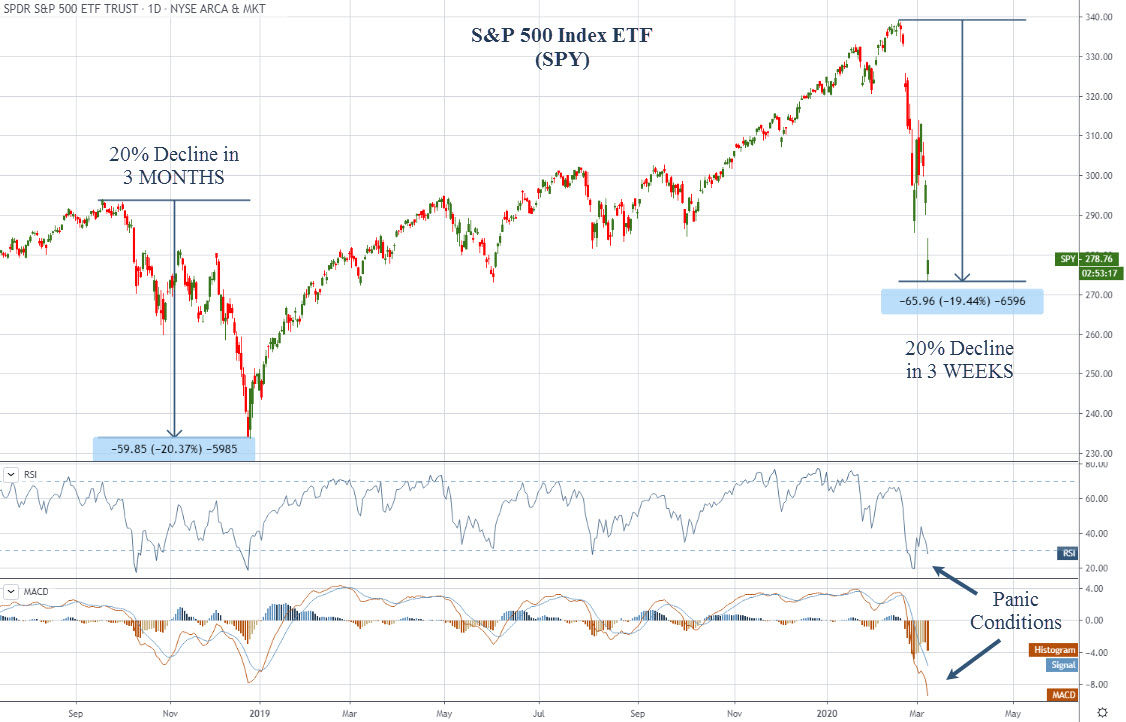
First, the decline from peak-to-trough over the past three weeks now stands at 20%. In the 4th quarter of 2018, it took the market 3 MONTHS to decline 20%, and now it has happened in less than 3 WEEKS.
Such a rapid decline has caused many indicators to show dramatically oversold conditions, as shown in the bottom half of the chart above. We are seeing readings that are more extreme now than in the depths of the financial crisis in 2008.
These are not conditions to sell into. Yes, it is uncomfortable, and no question it is also scary. But it is not prudent to do wholesale adjustments to strategy in this environment.
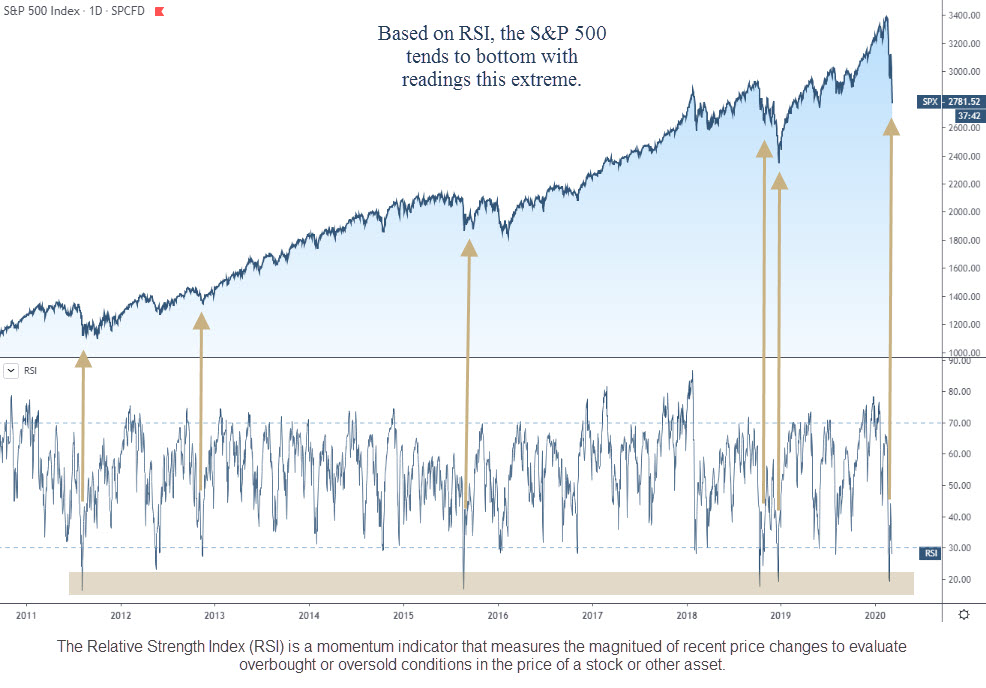
One of the indicators that has a high priority in our investment process is called the Relative Strength Index, or RSI. It is a measure of momentum, and specifically analyzes of the strength of up days versus the weakness of down days over a preset period of time.
This has a very reliable, statistically significant information it can give to us. When it reaches extreme levels like we have seen over the past week, it has been an excellent indicator of a low point in the markets.
The chart below shows the S&P 500 Index with RSI in the bottom pane. Since 2011, these condition have reliably signaled a low point in the markets. We have tested this data much further back than 2011, and it confirms what the chart below tells us: don’t sell in these conditions.
Two times, in 2016 and 2018, we had 10%+ rallies, after the first signal, but the markets ultimately made new lows over the next few months. That may very well happen again now. But we should expect that the market will provide some much needed relief in the very near future.
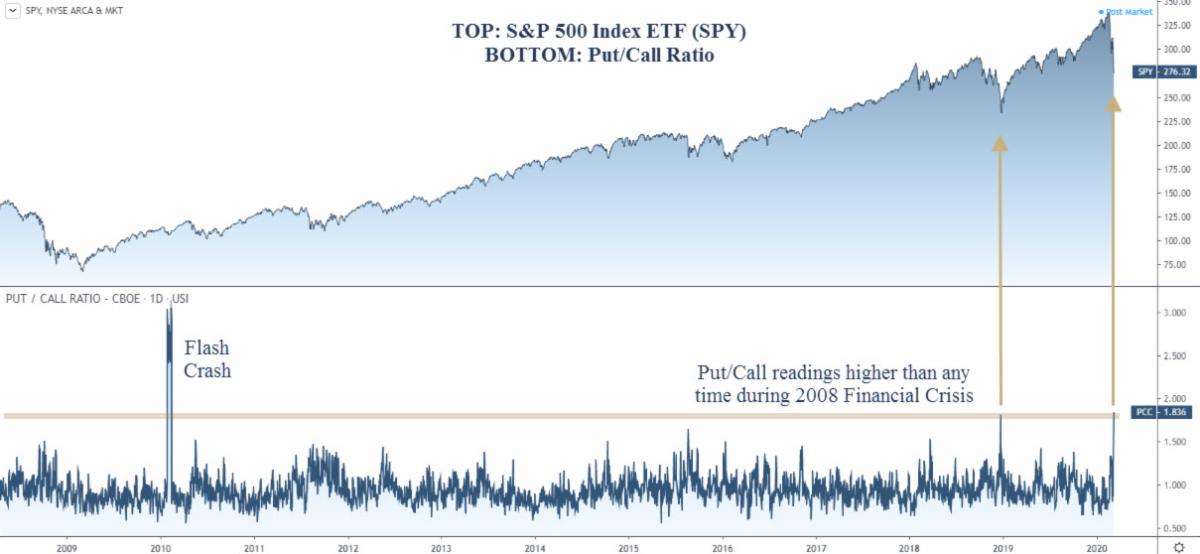
Another indicator showing how much pessimism exists in markets today is the put/call ratio. This ratio measures the relative amount of put options purchased (traders thinking markets will decline) versus the amount of call options bought (thinking markets will rise).
This is a measures of fear. When this indicator is high, fear is also high. When it is low, market participants are complacent.
The next chart shows the S&P 500 versus this Put/Call ratio.
Currently, this ratio is higher than at any time during the financial crisis. The only time it was higher was during the “Flash Crash” in 2010. This signals an extremely high level of panic and widespread fear.
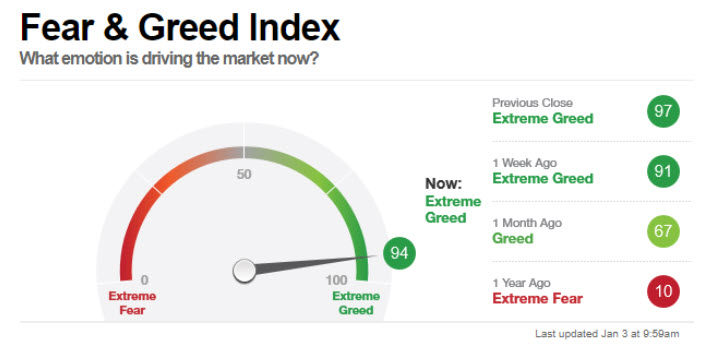
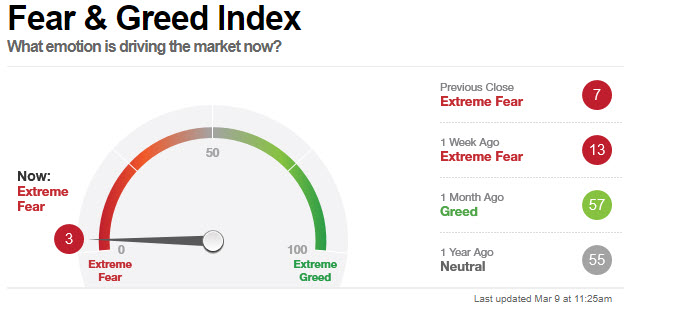
One last indicator to discuss is the straight-forward “Fear and Greed Index” compiled by CNN.
In January, no one feared the market. The indicator was at one of the highest readings of all time, as shown in the first image below.
Fear & Greed Index on January 3, 2020
Fear & Greed Index on March 9, 2020
But as the second image shows, we are now in the exact opposite scenario of extreme fear just a short few weeks after the first reading was taken. Uncertainty dominates the landscape, and is showing itself in many indicators.
Bottom line, with so much fear in the markets, it is not prudent to sell.
Portfolio Strategy
For clients, we took steps to reduce risk prior to the selloff beginning, which we discussed in our report from last week. That was the time to take steps to manage risk. Since then, it has been prudent to be patient and to keep exposure relatively consistent.
Today, we did two things.
First, we continue to reposition equity exposure away from weak holdings into stocks showing greater strength. The majority of stocks we have been purchasing are associated with people staying at home. Streaming TV services, home delivery companies, and communication technology companies that allow people to more effectively work from home.
This theme in positioning is a direct result of the market favoring exposure to companies that may be positioned well for a continued effects of the coronavirus.
The other move we made today was to allocate a small portion of portfolios from cash into a pure equity hedge. This investment goes up when the market goes down, and is designed to be a very short-term hold to offset the risk of markets experiencing further declines and trading halts.
The next few weeks will determine if cash in portfolios will be put back to work, or whether further risk reductions will be warranted.
Overall, we expect the market to experience a strong rally that should begin soon. We do not expect the danger to be over, but we do see opportunities.
Invest Wisely!
Our clients have unique and meaningful goals.
We help clients achieve those goals through forward-thinking portfolios, principled advice, a deep understanding of financial markets, and an innovative fee structure.
Contact us for a Consultation.
Neither the information provided nor any opinion expressed constitutes a solicitation for the purchase or sale of any security. The investments and investment strategies identified herein may not be suitable for all investors. The appropriateness of a particular investment will depend upon an investor’s individual circumstances and objectives. *The information contained herein has been obtained from sources that are believed to be reliable. However, IronBridge does not independently verify the accuracy of this information and makes no representations as to its accuracy or completeness. Disclaimer This presentation is for informational purposes only. All opinions and estimates constitute our judgment as of the date of this communication and are subject to change without notice. > Neither the information provided nor any opinion expressed constitutes a solicitation for the purchase or sale of any security. The investments and investment strategies identified herein may not be suitable for all investors. The appropriateness of a particular investment will depend upon an investor’s individual circumstances and objectives. *The information contained herein has been obtained from sources that are believed to be reliable. However, IronBridge does not independently verify the accuracy of this information and makes no representations as to its accuracy or completeness.
