A calm summer for the markets was interrupted today with a large selloff. Is this just a blip, or is it the start of a bigger decline?
What happened:
- Dow Jones Industrial Index closed down 725 points, or 2.09%
- S&P 500 was down 68 points or 1.59%
- The media blamed COVID fears, but it looks more technical in nature
- VIX Index rose nearly 40% at one point during the day
- Bonds had their best day of the year, with long-term US Treasury prices up over 2%
Near-Term Market Assessment:
- Numerous warning signs have been happening over the past three months:
- Lumber prices have fallen 68% from their highs.
- 10-Year Treasury Yields have dropped from 1.76% in March to 1.19% today.
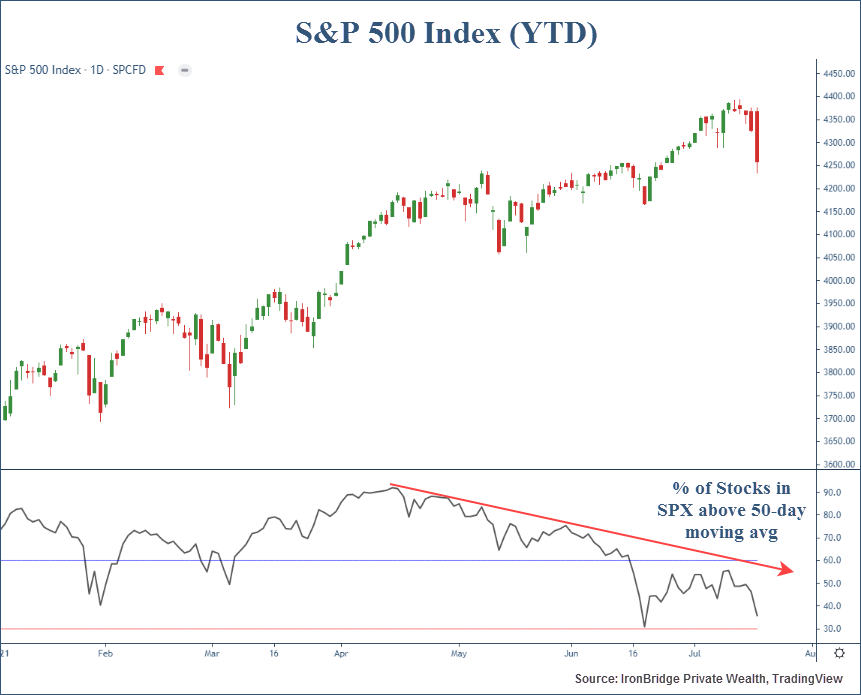
- Fewer stocks have been participating in the slow drift higher since mid-February. Today, more than 50% of the stocks in the S&P 500 are below their 50-day moving average (more on this below). That number has been steadily rising since April.
- It is too early to tell if this selloff will continue. Bull markets tend to have short, sharp declines like this.
- The S&P 500 Index is only 3% off its all-time highs. So the fear seems somewhat unwarranted at this point.
Portfolio Implications:
- We have been systematically raising our stop-losses over the past few months.
- We sold two positions today, one stock ETF and a high-yield bond ETF. Both moved to cash equivalent ETFs.
- We may get further sell signals this week. If we do raise cash this week, it may not remain in cash very long if the market decides to resume its move higher.
- We do not know when a short-term decline will turn into a long-term decline. That’s why we have rules and don’t try to guess. This kind of environment has the potential for a “whipsaw”, where we move from invested to cash and back to being invested. This is definitely not the favorite part of our process, but it is a natural consequence of having disciplined rules and not just winging it.
Market Discussion
Markets were down over 2% today. The primary (and easy) explanation is COVID. Every state in the US is showing a rise in cases. Los Angeles reinstated mask requirements this past weekend (even for those fully vaccinated). Other parts of California and possibly New York City may follow suit with mask requirements.
Naturally, any volatility in the markets is blamed on the most recent “thing”. It’s natural to assume that the rise in cases we are seeing now would result in a market environment like we saw in early 2020. We’re human and that’s what we do…extrapolate past events and assume they will happen again.
But the reality is that there were plenty of factors to explain the move lower today.
And they are mainly technical in nature.
First, market breadth has been very narrow the past few months.
This simply means that fewer and fewer stocks have been in uptrends, despite markets drifting higher. In fact, many stocks have been in downtrends since April.
The chart below shows the percentage of the S&P 500 Index that has been above its 50-day moving average (50dMA).

The 50dMA is simply the average price of a stock over the last 50 trading days. A stock above that level is generally considering to be in a rising trend (or a bull market). A stock that falls below that level is considered to be in a declining market.
What the chart above shows us is that while the market has been drifting higher, over 50% of the stocks in the index were in bear markets in June. This is referred to as “breadth”.
This indicator is similar to a game of jenga. When there are many blocks supporting the tower at the start of the game, the tower is strong and sturdy.
But as the game goes on, there are fewer blocks supporting the ever increasing height of the jenga tower.
This is happening in the stock market. When there are a lot of stocks supporting the index, it is more sturdy. In April, over 90% of the stocks in the S&P 500 Index were above their respective 50dMA. But as more and more stocks begin to reverse trend and fall, the index get wobbly.
This is very similar to mid-2018. We wrote about breadth in our “Soldiers are AWOL” report. After a weakening breadth environment in mid-2018, the market corrected by 20% in Q4 of that year.
The big tech stocks have been doing the heavy lifting in the past three months. The same exact thing happened in 2018.
The next reason is simply that the market is overdue for a correction.
So while COVID is to blame, the fact remains that we are due for a pause following the massive rally from the COVID lows last year. The market has had very little pauses, and is well overdue for a correction.
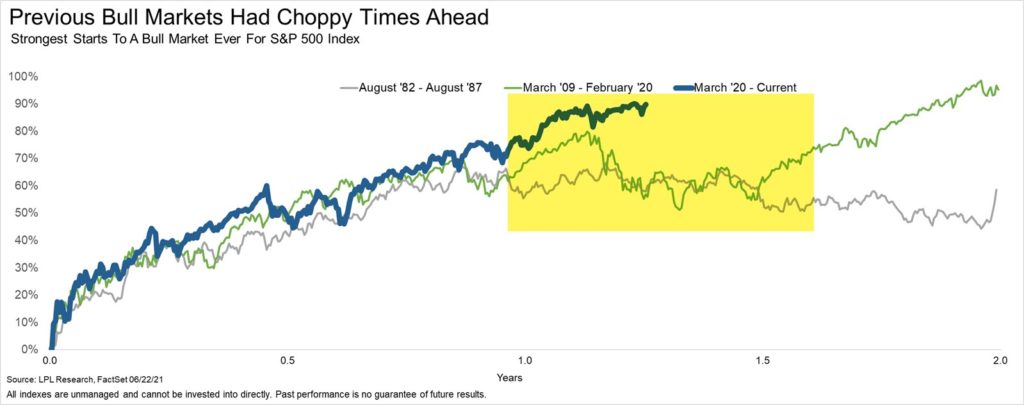
We shared the next chart in our last email newsletter, but it’s worth sharing again.
This shows the market rallies from previous major bear market bottoms. Three environments are shown here (1982, 2009 and 2021).

This chart suggests we are due for a natural pause given the strength of the move from March 2020’s lows.
So while the news is blaming COVID, the reason for today’s selloff seems to be much more technical in nature than simply worry about the delta strand.
The next few days will provide tremendous insight into what may happen over the coming weeks and months.
We had two sell signals today, selling one stock ETF and a high-yield bond ETF.
There is a chance we get many more sell signals this week.
However, no one knows if this is just a blip or if it is the start of something bigger.
Given the positive trends in the economy, continued massive support from the Fed, and the very technical nature of the market selloff today, we should assume that the bull market is still in tact, but due for a pause.
Risk management is a priority for us and our clients. Therefore, we will not wait to see what happens. We will act on our signals, and adjust course as necessary.
That could mean increased cash, but it could also mean that cash on the sidelines today gets put back to work very shortly.
Either way, the dogs days of summer could indeed be over for the stock market, even if it simply means a temporary pause in the bull market.
Please do not hesitate to reach out with any questions or concerns you have.
Invest wisely!
