The mixed messages from the markets continue this week as we look at the tug of war between strong economic activity and the continued narrowing in the number of stocks participating in the market’s move higher. GDP growth and corporate earnings reports have shown incredible strength for the 2nd quarter. While the market continues to show positive developments over the short-term, there remains enough concerns for us to keep a prudent cash allocation to keep our options open.
[maxbutton id=”5″ url=”https://ironbridge360.com/wp-content/uploads/2018/07/IronBridge-Insights-2018-07-27-Tug-of-War.pdf” text=”View PDF” ]
FIT Model Update: Market Correction
![]()
Earnings have rocked the market the past few weeks as companies such as Amazon and many health care companies maintain their positive momentum while other firms, largely in the tech arena, have missed elevated expectations. Earnings remain a positive tailwind for stocks, as 53% of S&P 500 companies have reported earnings that contribute to an estimated $124 of earnings per share of the S&P 500. At current prices that would make the S&P trading at 22.8x earnings, down from its peak levels of 24.3x hit last year.
Portfolio Insights
Strong Like Bull
“It’s essential to remember that just about everything is cyclical. There’s little I’m certain of, but these things are true: Cycles always prevail eventually. Nothing goes in one direction forever. Trees don’t grow to the sky. Few things go to zero. And there’s little that’s as dangerous for investor health as insistence on extrapolating today’s events into the future.”
– Howard Marks, successful investor
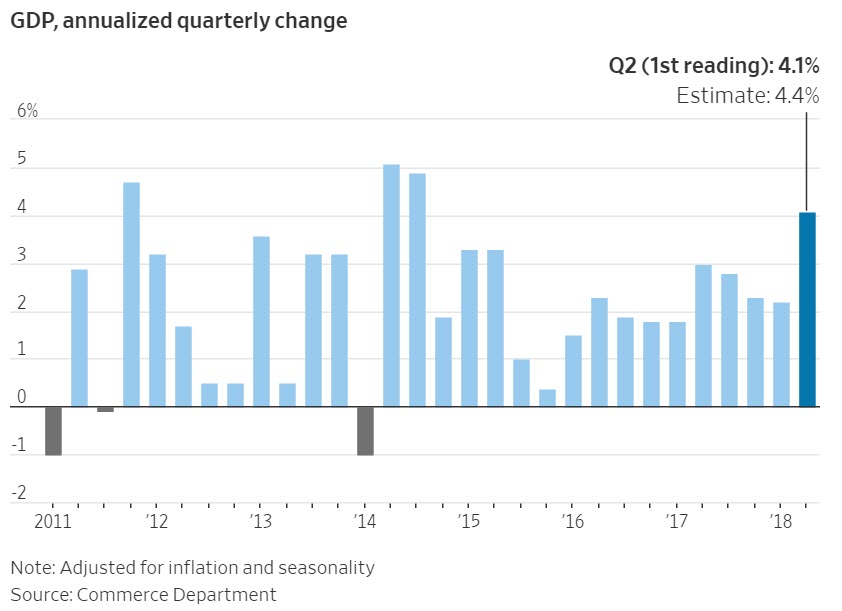
Second quarter GDP for the US was reported this morning, and the results were strong. The 4.1% growth rate was the highest since 2014, and the 4th best quarter since the 2008 financial crisis, as shown in the chart below from the Wall Street Journal.
The components of GDP were fairly strong across the board as well. Consumer spending, business spending and government spending all contributed to the positive number, and could remain strong in the coming quarters.
Should we expect 4% growth to be the new normal? While we cheer this number, we also caution that we should not extrapolate this too far into the future. Net Trade contributed more than 1% of GDP, primarily due to a surge in soybean exports ahead of a 25% retaliatory tariff from China set to go in effect today.
In fact, China has begun to shift large amounts of their commodity outsourcing from the US to Brazil as trade tensions remain elevated.
So we may have seen some future economic activity be pulled into this past quarter as a result of the trade tensions. This would suggest that actual GDP activity may have been closer to 3% than the 4.1% official reading.
From an economic perspective, strong growth is obviously a good thing. From an investment perspective, it is usually a good thing. Of the previous five times quarterly growth was above 4%, four of those times resulted in a higher market over the next 12 months. This suggests that there is some tailwind to elevated growth numbers like was reported today.
Earnings are Also Strong
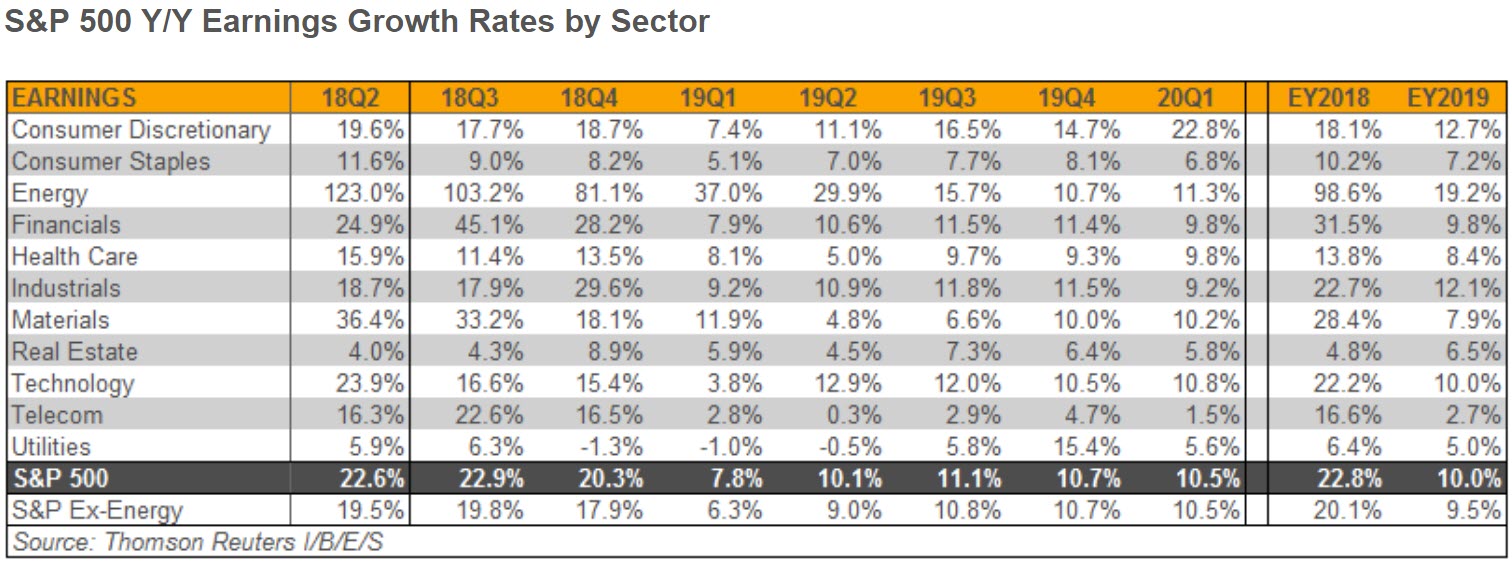
With the exception of some notable companies like Facebook and Twitter (whose stock prices both fell 20% after poor earnings announcements), earnings for the 2nd quarter have also been very strong. Expectations coming into earnings season were incredibly high, and thus far companies have delivered, posting a 22.6% rise in earnings. As of this publication, 82% of companies who have reported have exceeded analyst expectations. The long-term average is for 64% of companies to beat expectations. So any way you slice it, earnings have been good.
Earnings can be manipulated in various ways, as we discussed in our previous Insights edition, so we also like to look at revenue announcements. By this measure, companies also showed strong results, delivering an 8.7% increase in revenue over this time last year, with 53% of companies having reported thus far.
When earnings grow at a faster pace than stock prices, valuations will go down. That has been the case over the past year, as P/E ratios have fallen from a high of 24.3 last year to the current 22.4 level. This still suggests that equities remain over-valued, and supports our thesis that we remain in a late-cycle environment.
From a sector standpoint, the growth seems to be broad-based as well. The table below shows the 11 sectors in the S&P 500, with the column on the far left showing the recent quarter’s growth rates. Energy stands out as the big winner this quarter, with a 123% growth rate over the past year. We must keep in mind that energy earnings one year ago were in a much different environment, when oil was trading in the $40 range. It now trades close to $70 per barrel.
Nonetheless, based on the data being reported right now, the economic strength seems to be broad-based. But is this being reflected in the markets? Next we discuss market breadth, which does not appear to be as broad based as the economic data might suggest.
Market Microscope
No Participation Trophies
“A bird in the hand is worth two in the bush.” – Unknown Origin
The Market still has bad Breadth
Over the last few months we have maintained a modest amount of cash or cash equivalents in our portfolios. Why has that been and what are we waiting on to re-allocate? Granted, we have slowly put our cash back to work over the last few weeks/months as we got defensive around the February drawdown, but we still prefer the optionality having some cash allows currently compared to the definitive nature of being fully invested.
First, let’s talk about the role cash plays in one’s portfolio. We use cash as a short term tactical vehicle with a typically short life expectancy. Back in 2017 we held virtually zero cash in our portfolios while we were participating in a strong bull market, but now we have around 10-20% in cash or short term cash equivalents. Why do we want to still hold some cash right now? In short, we continue to want to leave our options open as we feel risks remain elevated.
The risks that crept into the markets in February have not fully resolved themselves as they continue to show up in various indicators and techniques we utilize. One technique, which we have referred to a few times in this newsletter, studies the individual components of the market, otherwise known as breadth analysis. Long term readers of our work often hear us refer to breadth as “Generals and Soldiers”. In a “healthy” market we would expect that most stocks are participating in an uptrend. When that’s the case, markets trend higher with little hiccup along the way.
But, what have we seen since the February selloff? We have seen 7 relatively large moves (up, down, up, down, up, down, and now back up). The reason this occurs is because not all stocks are participating in the trend higher the S&P itself has been privy to the last 2 months. The market has been able to give back gains, sometimes substantially, because there is this dearth of companies participating in the uptrend and sometimes that shows up in the Index (and sometimes the Index largely covers it up – as occurring now).
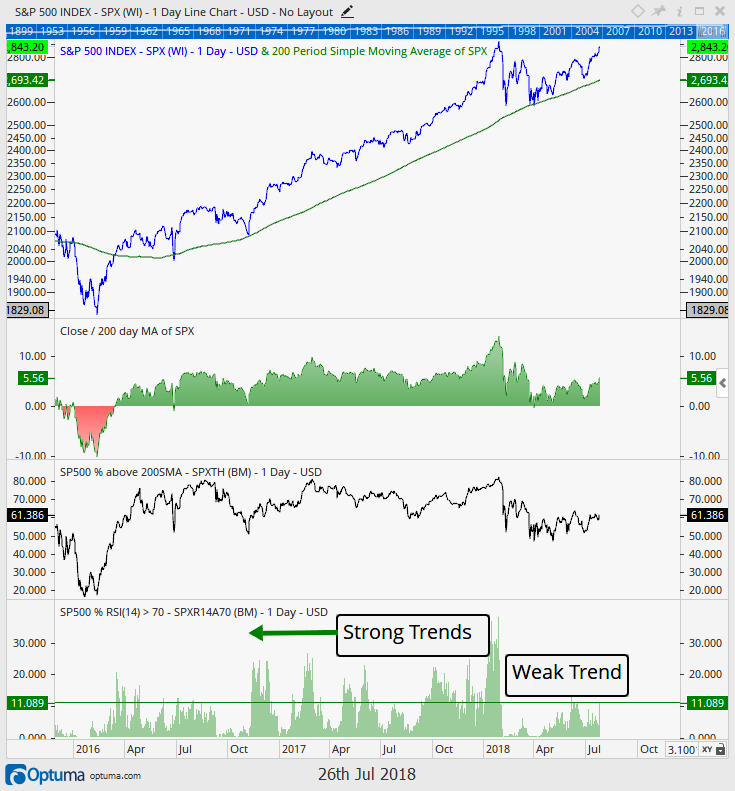
How do we know there is a dearth of stocks in an uptrend? Insert exhibit one. Our first chart below shows the S&P 500 in the top section along with its 200 day moving average. Prices are very nearly matching their January price highs, up almost 7% for the year now as the 200 day moving average has been a good proxy in letting us know the S&P indeed remains in an uptrend.
The second section of the chart shows this 7% gain is around 6% above that trailing 200 day moving average, which is a decent amount, although it is actually nearer the lower end of the average range over the last few years. These 2 graphs suggest all is well with the market.
But, here is our real issue with the market’s internals; The final two sections reveal there are only 62% of companies in the S&P 500 above their own 200 day moving average and there are only 11% of S&P 500 stocks showing strong momentum (RSI measurement > 70%). This may not seem like important facts, but if we look at the chart’s history we get some context. Compared to the last two years, this is near the low end of the range for both measurements. Notice too that these breadth indicators since the February selloff have been virtually flat-lined, much lower than they were in 2017.
What does this really mean? Many market participants use the 200 day moving average as a bull/bear line in the sand. If prices are above the 200 day moving average (meaning the price today is above or below the average price of the last 200 days (almost 1 year), the stock is in a bullish trend. If it is below, it is in a bearish trend (falling prices). This indicator shows that almost 40% of stocks are now trading below their average trailing price of the last 200 days, or put another way, 40% of stocks are showing a bearish tendency, and that is near the most extreme of the past 2 years. Compare this to the 70-80% of stocks that were above their 200 day moving averages through most of 2017.
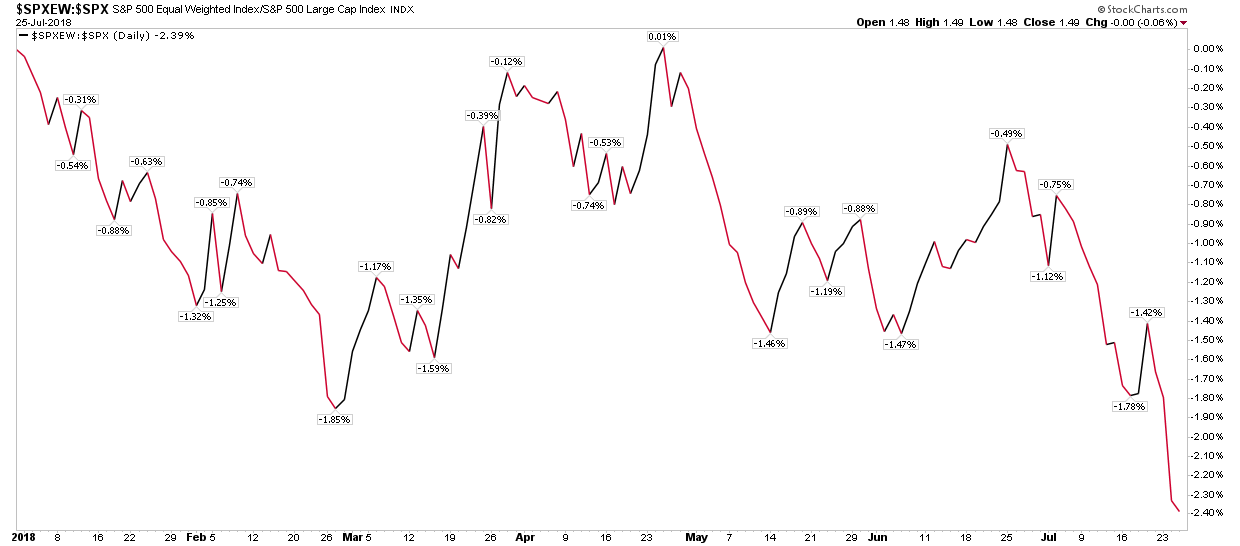
So why is the S&P close to making a new all time high? Well, a large part of the reason is simply because it is a market capitalization weighted index. If the S&P 500 was an “equal weight” index it would be another 2.4% lower in price year to date than it is today. The below chart helps put this in perspective.
The graphic below compares an equal weight S&P 500 Index (all 500 stocks are equal to 0.2% of the index) to a market weight Index where the top 5 holdings are almost 15% of the total (and 4 of the 5 are in the Tech sector and Amazon). Since June there has been a drastic drop off in performance between the equal weight index (RSP) and the market cap weighted one (SPY) as the chart below shows.
This ratio chart helps confirm that fewer and fewer stocks are propelling the S&P 500 higher. What about the Dow?
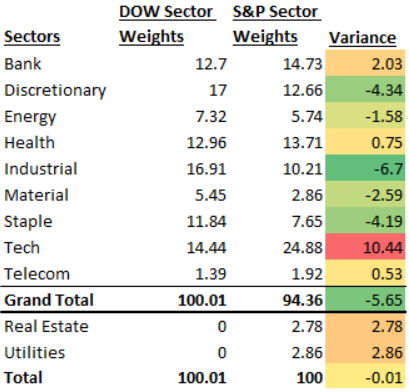
The Dow Jones Industrial Average has 30 companies in it. This compares to the 500 companies in the s&p 500. Those 30 stocks are also chosen by a committee, which means they can overweight or underweight sectors and exposures as they see fit. Building on the work in our last newsletter, when looking at the allocations of the Index to the sectors, the Dow, with only 30 stocks, surprisingly seems to have more equality than the S&P 500 and this is driven largely because one index is price weighted (the Dow) and the other is cap weighted (the S&P 500).
The next chart shows a comparison of the Dow’s sector exposure (assigning each Dow stock to its sector) compared to the S&P 500’s sector exposure. There is one glaring difference; technology is 10% more of the S&P 500 than it is the Dow (shown in red).
How has that affected these two indices?
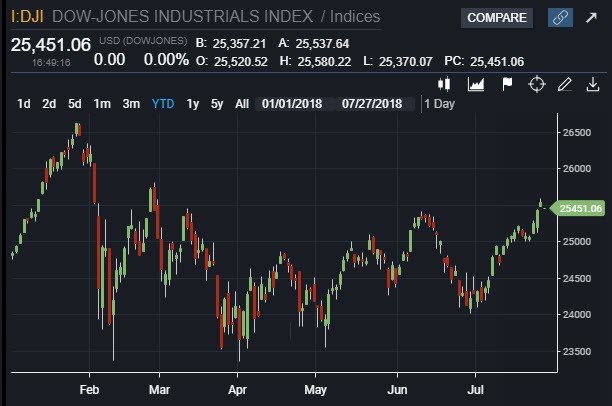
The chart below is the Dow Jones since the start of the year. This chart looks a little bit different than the S&P’s, and interestingly it looks a lot like the breadth indicator mentioned at the onset of this analysis that showed just 60% of the S&P in an uptrend.
The Dow has not recovered its February “snap back” highs and has only regained about half of its decline from February. The Dow is also only up 2.5% year to date versus the S&P’s 7%, helping show that those 30 large cap stocks just are not performing near as well as those at the top of the S&P’s market cap.
Without the tech sector, the S&P would look a lot like the Dow YTD, or said another way, because the Dow has 40% less Technology company exposure, it has significantly underperformed the S&P year to date.
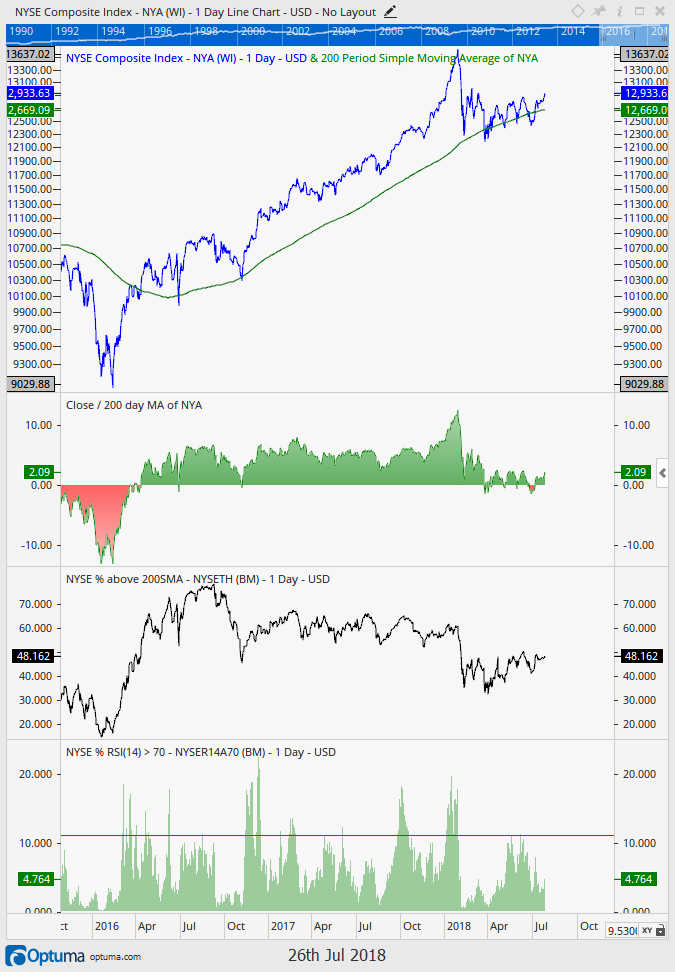
However, the Dow is just 30 stocks, can we really draw the conclusion most stocks are struggling when we are using an index of just 30? One final chart helps bring it full circle. Enter the NYSE Composite Index on the final chart.
The New York Stock Exchange (NYSE) Composite Index tracks all 3,000(ish) securities traded on the New York Stock Exchange and can give a better view of what is happening across the entire stock market (small, mid, and large cap stocks across all sectors). It also has a less Technology focus since a lot of tech stocks trade on the Nasdaq Stock Exchange rather than the NYSE.
The NYSE Composite chart, interestingly, looks a lot like the Dow’s. Stocks have only recovered around half of their February drawdown as that index is just 2% above its trailing 200 day price average and up just 1% year to date.
Most interesting, however, is less than 50% of all New York Stock Exchange securities are above their respective 200 day moving averages. This means a majority of stocks are actually in downtrends! Furthermore, and revealed in the final section of the graphic, less than 5% of NYSE stocks are showing strong momentum (a relative strength index reading >70%). This compares to the 10%+ that was seen frequently in 2016 and 2017.
Touched upon last week, one of the primary reasons we are seeing this dichotomy between the S&P 500 and market breadth is the fact the Tech sector (and Amazon) are really the stocks driving the market’s returns. Investors have flocked to these big name companies in the tech sector to the point that we even suggested calling it a “bubble”. And, when investors pile into big name stocks at such a pace, risks of negative surprises, such as Facebook’s 20% decline this week, become ever more elevated. If we exclude the tech sector, the markets are revealing a rather questionable setup where many stocks and sectors have not really recovered from the February decline.
What do our strategies say about all of this? The great thing about our strategies is they are largely objective. None of this really matters to them as this research is primarily a subjective and academic discussion rather than an investment strategy. In reality, the conclusion of this analysis has already showed up in our strategies and is why we continue to hold a decent amount of cash as we have been slower to reinvest capital seeing fewer and fewer attractive potential holdings. We manage tactically and actively and invest when we feel the risk versus reward dynamics are in our favor. With over 50% of NYSE stocks in downtrends, it is simply not as attractive an investment environment as was 2016 & 2017, when 70%+ of stocks were above their respective 200 day moving averages and stocks had more momentum.
The good news is this could all change on a dime, and we remain ready and waiting with a little bit of cash in hand for when it does. As the saying goes, a bird in the hand is worth two in the bush!
Invest wisely.
Our clients have unique and meaningful goals.
We help clients achieve those goals through forward-thinking portfolios, principled advice, a deep understanding of financial markets, and an innovative fee structure.
Contact us for a Consultation.
Neither the information provided nor any opinion expressed constitutes a solicitation for the purchase or sale of any security. The investments and investment strategies identified herein may not be suitable for all investors. The appropriateness of a particular investment will depend upon an investor’s individual circumstances and objectives. *The information contained herein has been obtained from sources that are believed to be reliable. However, IronBridge does not independently verify the accuracy of this information and makes no representations as to its accuracy or completeness. Disclaimer This presentation is for informational purposes only. All opinions and estimates constitute our judgment as of the date of this communication and are subject to change without notice. > Neither the information provided nor any opinion expressed constitutes a solicitation for the purchase or sale of any security. The investments and investment strategies identified herein may not be suitable for all investors. The appropriateness of a particular investment will depend upon an investor’s individual circumstances and objectives. *The information contained herein has been obtained from sources that are believed to be reliable. However, IronBridge does not independently verify the accuracy of this information and makes no representations as to its accuracy or completeness.

