Market Microscope
Where are we within the Market Cycle?
“Most people get interested in stocks when everyone else is. The time to get interested is when nobody else is. You can’t buy what is popular and do well.
-Warren Buffett
Ten years ago this week marked the end to one of the largest bear markets in recent history. On March 9, 2009, the S&P 500 traded at the creepy level of 666, which marked the low point of the decline that began in October of 2007. All told, the market declined 54% over that time frame.
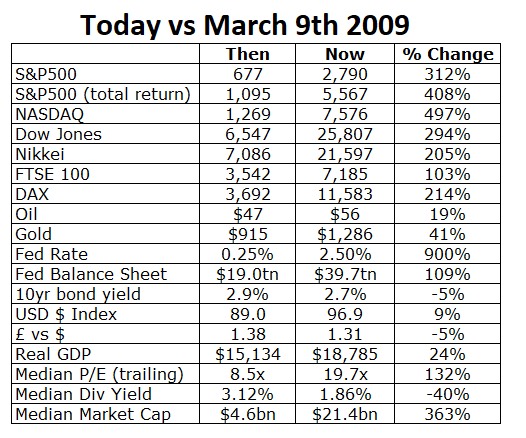
Since then, as we all know, markets have been incredibly strong. The S&P 500 is up over 400% since that day ten years ago, along with many other markets that have shown tremendous strength, as shown in the chart below.
 The natural question to ask is “Why?”. What caused such a large decline, followed by such a large rise?
There are as many theories as to why things happen in markets as there are market participants. And each theory is about as useful as a screen door on a submarine.
In our view, it is not the “why” that is important. Because the real answer to “Why?” is simple…markets work in cycles. Period. Anything more than that is simply an attempt to try to sound smart at a dinner party.
Whatever confluence of events that led to the last bear market is not likely to be the same reasons we enter into the next one. Thus, to spend time and effort understanding exactly what happened is an activity for market historians and college professors. It is NOT a useful activity for portfolio managers like us who are trying to navigate changing markets in real-time, with hard-earned wealth that has been entrusted to us by our clients.
What is important are the conditions that existed around that period of time. Paying attention to how different parts of the economy and markets were behaving can help us better identify where we currently are in the market cycle. Then, by understanding where we are in the current market cycle, we can then more effectively apply strategies that best take advantage of the risks and rewards that exist today.
We know that the moves from the 2009 lows have been strong, but they also have been very long as well. The graphic below shows that this is also the longest bull market in the S&P 500 Index since the index was created back in 1949.
What we, as market analysts, find more interesting than the size and duration of this bull market is just how different today is compared to March 2009.
Where were you in October of 2008, when the bulk of the fear occurred? Numerous days, and even weeks, there was flat out panic. The stock market fell over 25% in just that one month.
We have left Warren Buffett’s quote above from our last ‘Insights’ as the headline as it remains relevant to our thesis this week. Do you remember Buffett’s full page Wall Street Journal plea on October 17, 2008 to “Buy American. I am”? Granted, the market fell another 20+% from there before ultimately hitting its lows, but Buffet’s Op Ed was published generally when nobody was interested in buying stocks. There were bailouts, unprecedented moves by banking systems, and AIG was even nationalized. Fear was in the air.
The fear in 2008 and early 2009 was real, but it was also normal. The market cycle punishes those who are not prepared for it.
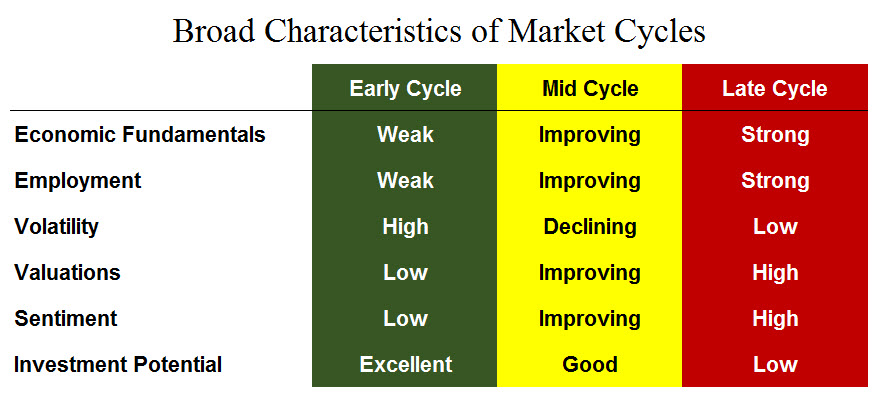
Over one year ago, in February 2018, our ‘IronBridge Insights’ used the following graphic to help show the dichotomy between a market that was late in its cycle or early in one. This chart’s importance to us remains, especially as we think back to 2008 and, specifically March 2009.
Notice how the things that people traditionally associate with a good investing environment are actually opposite of what you hear on the CNBC’s of the world. When the economic environment is at its WEAKEST is precisely the time when your investment opportunities are the greatest.
When things look awful is the best time to invest. When everything seemingly looks the strongest is the time for caution.
Let’s look at how a few of these indicators today compare to them in 2009.
The March 2009 quarterly earnings of the S&P was just $7.52 per S&P share, down 66% from the then all time high $21.88 of June 2007. In less than two years, life in America shifted abruptly. The graphic to the left characterizing the different phases of a market suggests that early in a market cycle economic fundamentals are weak. We would constitute a 66% decline in earnings and at the lowest level since the .com bust as weak.
Contrast this to right now. September 2018 earnings hit an all time high of $36.36 per share, a full 5x more than earnings back in early 2009. Economic fundamentals it seems are very strong currently.
There are countless ways we could measure the economic backdrop, but one other one, unemployment, is a pretty universally accepted gauge. In March 2009 the Federal unemployment rate was 8.5%. Today it is at 4%. It’s tough to argue, from an economic aspect at least, that we are anything but late cycle right now. To put things in perspective, at the prior all time stock market peak, in October 2007 also had a 4 handle, at 4.7%. Economically and employment-wise, today looks a lot more like 2007 than it does 2009.
How about the next topic on the cycle list above, volatility?
The chart of volatility below shows two timelines: one originating on Jan 1, 2006 (green line), and another originating on Jan 1, 2016 (blue line). Comparing the two periods reveals what many already know, volatility is much higher earlier in a market cycle than it is later in the cycle.
Volatility was relatively low in 2006 and 2007, just as it was low in 2016 and 2017. This is par for the course late in a cycle. 2018 finally saw some volatility creep into the market (perhaps a sign that the cycle is trying to turn?). Obviously a major spike higher in volatility occurred during the financial crisis, a sign that the late cycle of 2006 and 2007 had turned to an early cycle of 2008 and 2009.
A product of economic fundamentals, there is also a vast difference between valuations of companies late in a market cycle versus early in the cycle.
The price to earnings (P/E) ratio at the low of the last cycle (2011) was 13x. The previous peak occurred in December of 2007, at 22x. Just 10 months before the bottom fell out of the stock market, the P/E ratio was hitting an all time high!
We have seen a similar event today. In fact in both June and September 2018, the market was trading at the same 22x multiple on earnings. This aligns the valuations of today with 2007.
Sentiment is another very important aspect of cycle analysis. It may even be the most important. Why? Because sentiment is a major input into price since investor feelings, moods, and behaviors all affect prices. Additionally, when sentiment is positive, prices are elevated, and when sentiment is negative prices are depressed, having a major affect on the other key inputs to cycle analysis, affecting valuation, economics, employment and volatility.
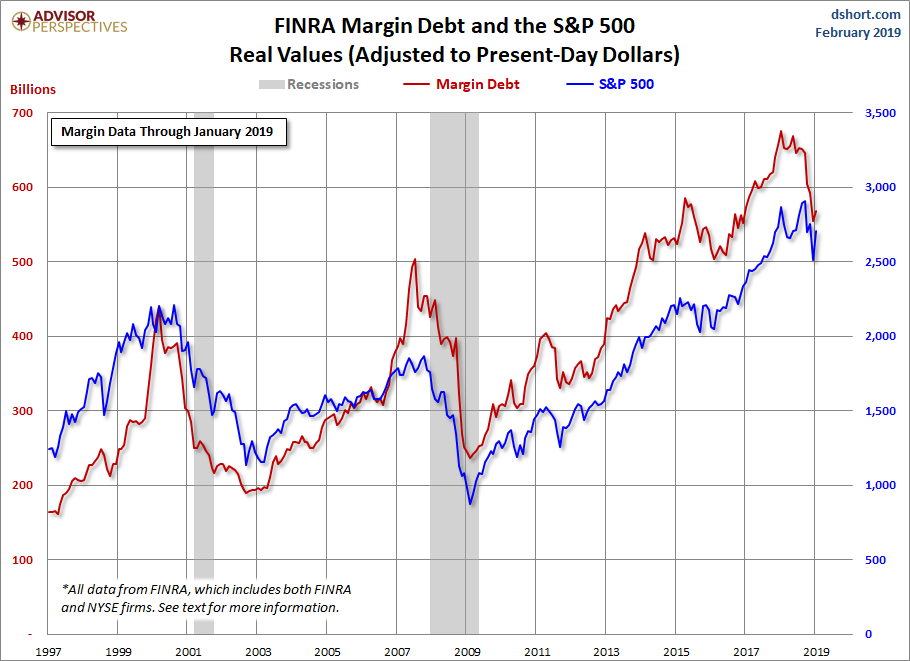
The next chart shows NYSE Margin Debt, or the debt investors have taken on backed by their equity holdings.
Notice a trend? When investor sentiment is high, they are more willing to lever up their investments. Recently that sentiment peaked at a new all time high, a full 50% more than the prior peak in 2007. Again we see that margin debt levels today are more in line with the year 2007 (and 2000) than it was anytime between 2008 and 2014. Based on sentiment and the significantly more margin investors are using, once again we must conclude we are late in the cycle.
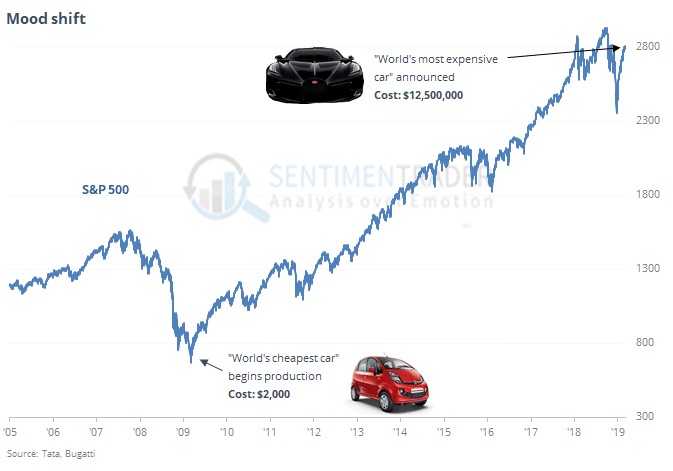
Another, less scientific view of sentiment looks at societal trends in an attempt to identify the market cycle. As shown on the chart below, courtesy of SentimenTrader, the “world’s cheapest car” debuted at the depths of the financial crisis. Just recently, the “world’s most expensive car” was announced. For those interested, see specs HERE…it’s a 1500 horsepower, 16-cylinder widow-maker sports car.
Where we are within a cycle is crucial to making sound investment decisions. Just as Warren Buffett said in his 2008 Op Ed, “Be fearful when others are greedy, and be greedy when others are fearful”. Which brings us to the final input to the cycle conversation.
Knowing where we are the in the market cycle in and of itself doesn’t do much. It’s the ability to USE this knowledge to your advantage that is key.
“Alpha” is a term used to measure the performance of an investment strategy relative to a benchmark. Generating alpha is every investor’s dream. Positive alpha means the strategy is performing better than a benchmark. A mutual fund that invests in US stocks would have the S&P 500 Index as a likely benchmark. If the S&P was up 10% in a given year, and the fund was up 14%, that fund generated positive alpha that year.
Providing alpha to investors is difficult. Over the past 10 years, over 90% of active mutual funds under-performed their respective benchmarks. The reason for this is simple. They are using strategies that have not adjusted to today’s investing environment.
In order to generate alpha, one must have some sort of edge. We believe that you can use the market cycle to help to achieve outperformance, but you must adjust to the current environment.
We apply a variety of strategies in client portfolios, but there are a few themes that we apply late in an investment cycle like we believe we are in right now.
- Shorten your Time Frame. Late in a cycle, we expect to hold investments for a shorter period of time. The risk of a big loss increases as time goes by, as the cycle inevitably will turn from good to bad.
- Don’t let a small loss turn into a big loss. After 10 years of a good market, declines can be large. We have exit signals on every position in actively managed client portfolios. Our average downside risk is approximately 5% right now.
- It’s okay to be in cash, at least temporarily. Cash can provide dramatic outperformance in down markets (it was the best performing asset class in 2018.) However, if you have an increased cash allocation, you must have know the conditions that would cause that to be reinvested.
- Have a defined, repeatable process. While characteristics are similar, no two investment cycles are the same. You must have a process that can adapt to any market environment.
There is always opportunity for those that work for it. By identifying the conditions present in the current environment and applying common sense rules, we believe the investing odds can be skewed in your favor.
Invest Wisely.
Our clients have unique and meaningful goals.
We help clients achieve those goals through forward-thinking portfolios, principled advice, a deep understanding of financial markets, and an innovative fee structure.
Contact us for a Consultation.
Neither the information provided nor any opinion expressed constitutes a solicitation for the purchase or sale of any security. The investments and investment strategies identified herein may not be suitable for all investors. The appropriateness of a particular investment will depend upon an investor’s individual circumstances and objectives. *The information contained herein has been obtained from sources that are believed to be reliable. However, IronBridge does not independently verify the accuracy of this information and makes no representations as to its accuracy or completeness. Disclaimer This presentation is for informational purposes only. All opinions and estimates constitute our judgment as of the date of this communication and are subject to change without notice. > Neither the information provided nor any opinion expressed constitutes a solicitation for the purchase or sale of any security. The investments and investment strategies identified herein may not be suitable for all investors. The appropriateness of a particular investment will depend upon an investor’s individual circumstances and objectives. *The information contained herein has been obtained from sources that are believed to be reliable. However, IronBridge does not independently verify the accuracy of this information and makes no representations as to its accuracy or completeness.


