Earnings reports are one of the most watched and analyzed metrics in global markets today. Earnings declined in the first quarter of the year, and are currently at risk of printing back-to-back declines for the first time in 3 years.
But do earnings matter? Or is there something more constructive we can be doing?
Market Microscope
Are Earnings Important?
“It is pointless to try to reason a man out of a thing he was never reasoned into”
-Jonathan Swift, Author, 1700s
 Stock investors look to many different data points in an attempt to analyze individual companies and the broad market itself. At the top most analysts’ lists is corporate earnings.
Earnings by themselves are pretty simple…it is the total amount of money a company brought in during a specified period of time. It’s revenue earned before the company pays any expenses.
The Securities and Exchange Commission (SEC) requires US companies to report earnings on a quarterly and annual basis. Many investors consider earnings, along with the other “ratios” associated with earnings (such as P/E ratios), to be the most important factor in investing.
But should it be, or is it just noise?
In order to be useful as an investing tool, a metric must have some sort of predictive property. So we asked a simple question…can earnings give guidance to future market performance?
Let’s separate our discussion into two basic sections:
- Earnings Estimates
- Actual Reported Earnings
Every quarter there is an approximately 6 week time frame where the vast majority of S&P 500 companies report earnings. The week of July 8 kicks off the 2nd quarter’s earning season, and this upcoming window will have no shortage of attention.
The S&P runs the risk of having its first two consecutive quarters of earnings decline (Q1 2019 and Q2 2019) since 2016 when the first two quarters of that year posted consecutive year over year earnings depletion.
But, another potential quarter of earnings declines is just one part of where the attention will be. The S&P is also at risk of having a full year 2019 earnings subtraction.
Earnings Estimates
As with most things in finance there are a vast range of opinions on what potential earnings will be. Analysts factor in sales projections, economic indicators, industry trends, and many other things when making their predictions.
The first chart below shows two separate earnings estimates. The blue line shows the full year estimated earnings growth from analysts at the company Standard & Poor’s, the facilitator and defacto “expert” of the S&P 500 Index. Generally, they are more reactive in their estimates and take company estimates at face value. The top down estimates aggregated by S&P project an 11% year over year earnings growth in 2019.
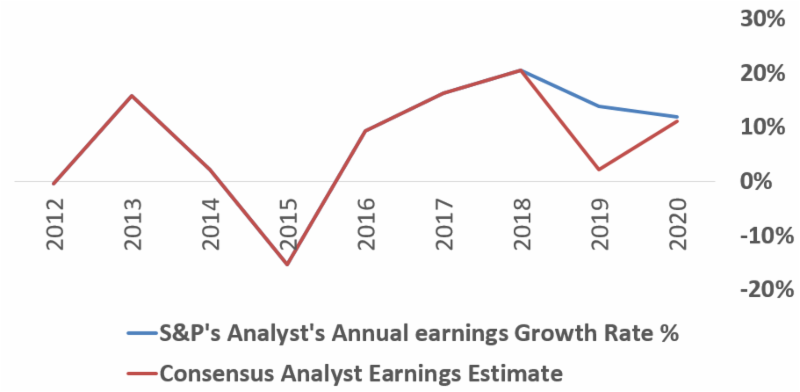 Contrast this blue line to the red line, which is the consensus estimate across all the analysts tracked in the industry (30+ analysts), many of which build their own bottoms up earnings projection models for each company they estimate.
Consensus earnings are much more pessimistic as they are assuming just a 2.1% growth in 2019 earnings. If this comes to fruition it would be the slowest growth rate since 2015. Many are suggesting an actual economic recession could be on the horizon based on this earnings slowdown.
Looking out to 2020, earnings estimates are projected around 11% growth. Not bad, but this would be the slowest growth rate since 2015.
However, if we analyze their record, analysts consistently show an extremely bullish bias, especially at the beginning of an estimate’s timeline.
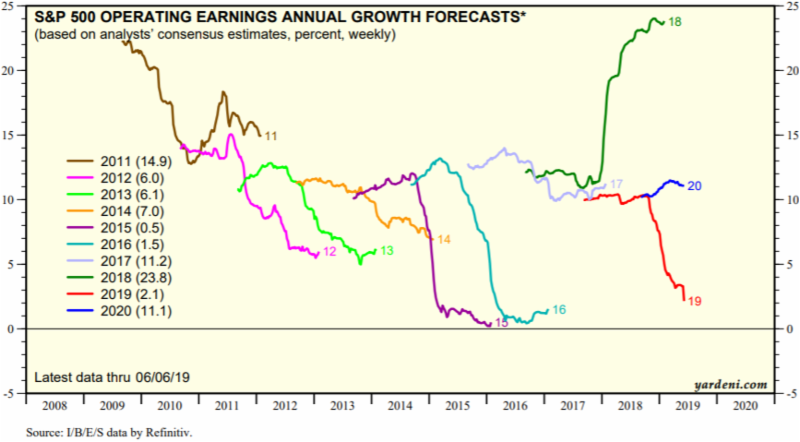
The next chart is from Yardeni research and is known as the “squiggles chart”. We previously discussed the squiggle chart in “Plan, Don’t Predict” last August…read it HERE.
We love this chart because it shows Wall Street’s incredibly bullish bias year end and year out, and it paints a great picture of how earnings estimates move over time. It also shows just how wrong these “experts” can be. (It’s almost as if part of their business model is for you to be overly optimistic…but we digress.)
This chart shows the weekly earnings estimate every year since 2011, and tracks how those estimates change throughout the year.
There’s a clear trend that is in place.
In all years since 2011, except one, earnings estimates start out higher than they ultimately end. In many cases, the change is quite dramatic. 2019 is one of those examples with an almost 90% drop in earnings growth estimates from 11% down to the current 2%.
Note, the only year estimates actually went up was in 2018, and that was solely the result of the tax law changes.
This sure doesn’t seem very helpful.
Perhaps this bullish earnings bias is a recent phenomenon?
Let’s give these analysts the benefit of the doubt. They’re humans after all (just don’t invite one to a dinner party). Maybe the record amount of Fed stimulus has skewed their projection methodology, or maybe something structural changed since 2008.
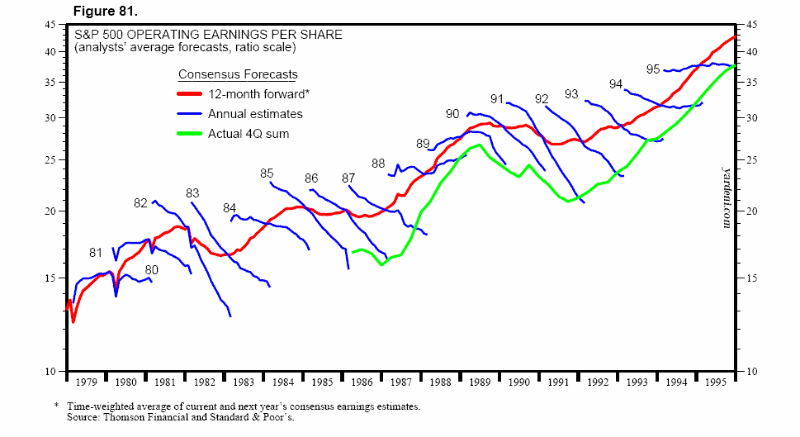
So let’s go back to the 1980s and 1990s. Before data was instantaneously available. Surely this will show a more prudent data set and possibly show less optimistic projections?
Sorry. Analysts were MUCH more bullish on earnings relative to where they actually were reported. Even more skewed than they are today!
It’s pretty clear there is a bullish bias in Wall Street’s earnings estimates as earnings are almost always much more optimistic than reality brings.
More importantly, these earnings estimates serve as the primary basis for almost all of the year-end market projections that come out of these same firms!
Turning back to 2019’s expectations, it’s not just an individual company or sector that is the culprit.
The next graphic, also from Yardeni, breaks down 2019’s earnings estimates for all the S&P 500 sectors.
Every single sector’s estimates have been coming down with material and real estate companies as a whole posting negative earnings growth. Communications, Health Care, Consumer Staples, and Utilities are all on the verge of posting negative earnings as well.
If these earnings projections do have an impact on stock prices, shouldn’t stock prices be affected when changes in these estimates occur?
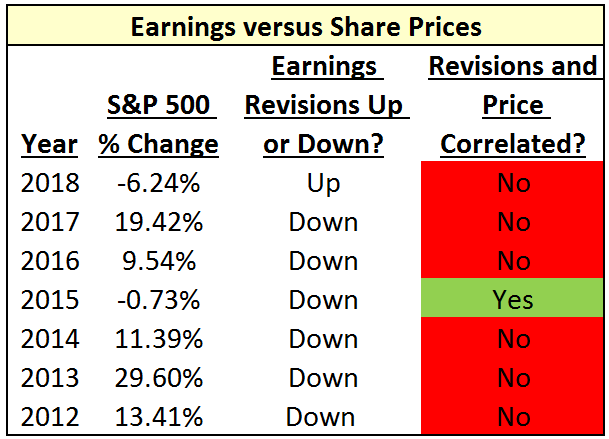
The graphic below shows the direction of earnings revisions along with the percent change in the S&P 500 stock index.
Amazingly, in 2012, 2013, 2014, 2016, and 2017 all saw double digit stock market gains, even though earnings estimates were being CUT in each of those years. In some cases these cuts were very large.
Did the market care? No, prices still rose!
To make matters worse, in the one year earnings revisions actually went up (2018), stock prices actually fell!
With this kind of track record we draw three conclusions:
- Estimates will be excessively bullish. Assume actual year over year earnings growth rates will come in somewhere around 10 percentage points (or more) below initial estimates.
- Estimating earnings is a fool’s errand. If the experts consistently get it wrong, why should we think we could do it any better?
- There is very little, if any, decision-making value in earnings estimates. A successful investing process should eliminate unnecessary steps.
Bottom line, earnings forecasts will only serve to increase your uncertainty. So we believe it is best to not use them as a part of your investment process.
Actual Earnings
Okay, so it makes sense that people aren’t the best predictors of the future. But surely the actual earnings themselves have some value?
Since actual earnings aren’t modified much following their announcements, we don’t need to look at squiggles to understand if there is a meaningful correlation.
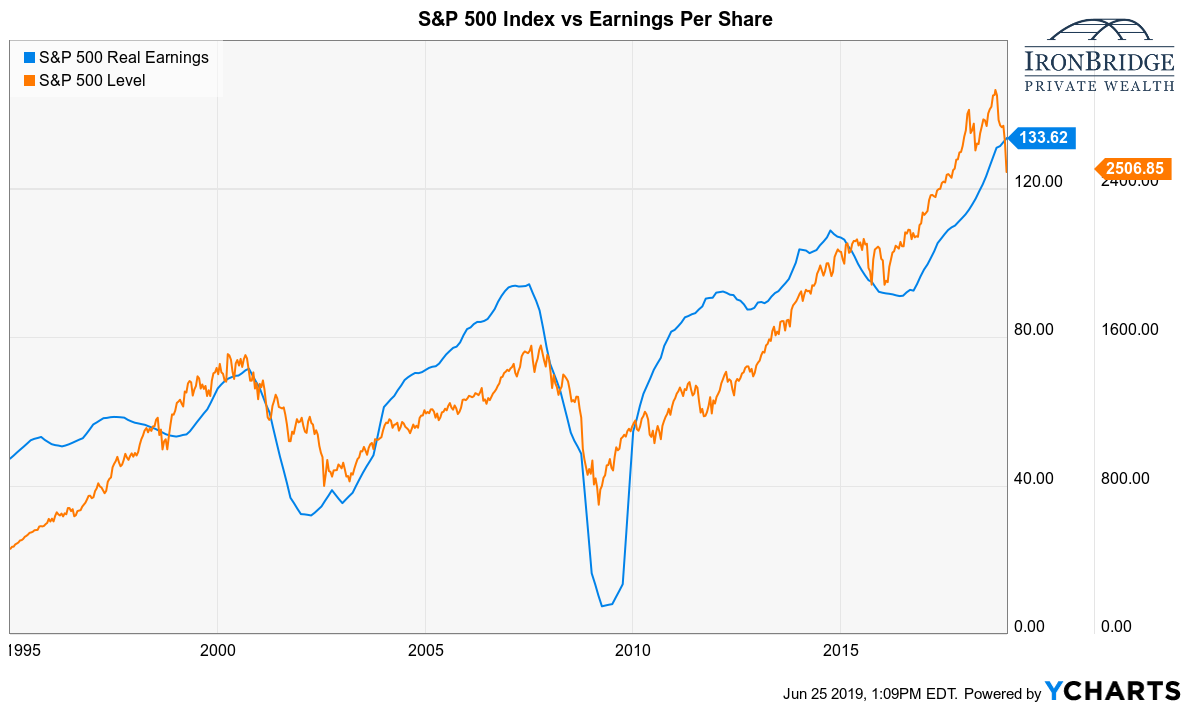
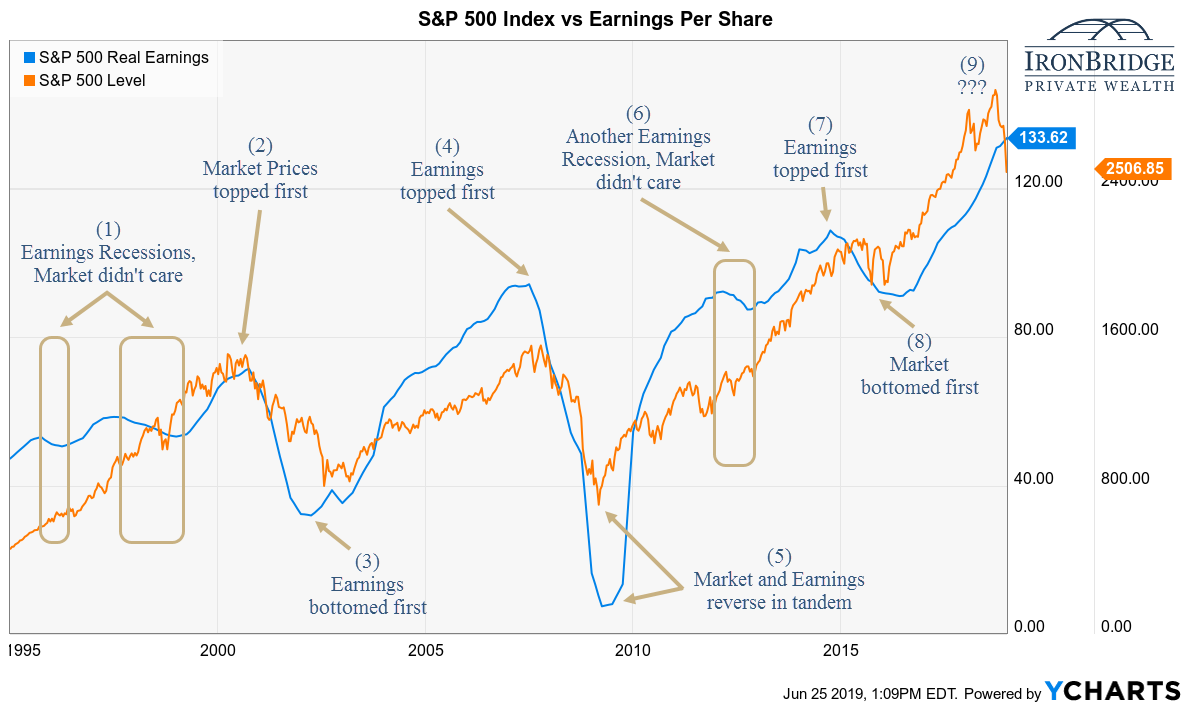
So let’s look at actual earnings over time, and compare them to the S&P 500. The chart below shows the S&P 500 since 1995 (in orange), plotted against real earnings (blue).
First, we can see some obvious correlations here. Rising markets are accompanied by rising earnings, and vice-versa. That seems fairly intuitive. But let’s look at some key points along the way to determine if the relationship is as close as it appears.
Next is the same chart as above, only we have notated 9 important time frames.
Essentially we looked for earnings recessions and turning points. Maybe earnings would provide a reliable indicator then?
During the two major economic recessions in 2001 and 2008, earnings declined dramatically. It doesn’t take a PhD to know that occurred. However, what is interesting is that actual earnings declined EVERY quarter during that time. There was no reason to believe that earnings would rebound until they actual DID rebound, despite analysts’ consistently bullish predictions.
Outside of those two economic recessions, there were four earnings recessions occurred. Three of these resulted in a market that was UP during the earnings recession, and are shown in the gold boxes above (in 1996, 1998 and 2012). The fourth was in 2015-2016, when the market declined during that period.
It doesn’t quite make sense, but does this suggest we should expect the market to RISE during earnings recessions??
Maybe the turning points will be more helpful.
There are seven turning points markets on the chart above. And there is no good conclusion that can be made about whether the market begins to move first or whether earnings do:
- At the 2000 top, market prices started to decline first.
- In 2002/2003, earnings bottomed first.
- At the 2007 top, earnings declined first.
- In 2009, they bottomed in tandem.
- In 2015, earnings declined first, but the market bottomed first in 2016.
Confused yet? Us too.
The data is even more confusing if you expand the charts back to include periods since the 1950’s.
Confusing data doesn’t help. Clarity of mind and purpose is absolutely required to succeed in the complicated world of investing.
So what is the takeaway?
If earnings estimates are consistently downgraded week after week, month after month, yet the stock market largely has gone up during these years, how can we logically conclude that earnings ESTIMATES drive share prices?
And despite actual earnings having a high correlation with generally rising or falling markets, actual earnings show no meaningful insights into the future direction of market prices. So how can we logically conclude that ACTUAL earnings drive share prices?
The answer to both is simply “We can’t.”
If share prices go up even when earnings are declining, why spend so much time projecting earnings?
Just because data is commonly used doesn’t mean it is effective. And this data appears to be incredibly ineffective. While we will know what earnings are doing, we won’t and shouldn’t use it as as a meaningful tool for decision making.
At best, it can give us a feel for the overall economic environment. But so can a lot of indicators. With earnings, up is good, falling is bad. Except when it isn’t.
As uncle Lewis would say in Christmas Vacation…”Since you’re not doing anything constructive, go get my stogie!”
Invest wisely.
Our clients have unique and meaningful goals.
We help clients achieve those goals through forward-thinking portfolios, principled advice, a deep understanding of financial markets, and an innovative fee structure.
Contact us for a Consultation.
Neither the information provided nor any opinion expressed constitutes a solicitation for the purchase or sale of any security. The investments and investment strategies identified herein may not be suitable for all investors. The appropriateness of a particular investment will depend upon an investor’s individual circumstances and objectives. *The information contained herein has been obtained from sources that are believed to be reliable. However, IronBridge does not independently verify the accuracy of this information and makes no representations as to its accuracy or completeness. Disclaimer This presentation is for informational purposes only. All opinions and estimates constitute our judgment as of the date of this communication and are subject to change without notice. > Neither the information provided nor any opinion expressed constitutes a solicitation for the purchase or sale of any security. The investments and investment strategies identified herein may not be suitable for all investors. The appropriateness of a particular investment will depend upon an investor’s individual circumstances and objectives. *The information contained herein has been obtained from sources that are believed to be reliable. However, IronBridge does not independently verify the accuracy of this information and makes no representations as to its accuracy or completeness.
