After months of very low volatility, fears over the potential negative effects of the corona-virus on the global supply chain is causing markets to take an overdue pause. Markets underwent a large sell-off today. The Dow Jones fell 1,031 points, and the S&P 500 was down over 3.3%.
In this issue we put this decline into context, identify short-term, intermediate-term and long-term support levels, as well as analyze the potential effects of the corona-virus going forward.
“Medicine is a science of uncertainty and an art of probability.”
-William Osler (1849-1919), founding professor of Johns Hopkins Hospital
Market Update
In our last issue of IronBridge Insights, we noted the following:
“Despite threats of World War 3, impeachment proceedings, and the recent threat of a pandemic virus sweeping the globe, markets have been resilient. Earnings have been positive for the most part, and there have been no major surprises economically. Essentially the market has been saying “No Big Deal” to every potential downside catalyst.” – IronBridge Insights “The One Thing”
Well, looks like volatility finally made its return.
What are the potential causes?
- Corona-virus. This is the most likely reason volatility has returned. We are not epidemiologists. Neither are the dozens of market analysts who are trying to predict the next phase of this potentially very harmful virus. There are supply chain disruptions occurring in China and elsewhere, and the threat of uncertainty can indeed have tangible economic effects. More on this below.
- Earnings. An increasing number of companies are announcing that they will not meet projected earnings for this quarter. The big daddy, Apple, was the most prominent company to warn that the effects of a supply chain disruption in China will have a negative effect on its Q1 numbers.
- Politics. Bernie Sanders is the clear front-runner to be the Democratic nominee. Some people have said that the market is selling off because of fear of Bernie’s policies on markets and the economy. Others have said that the market is selling off because a Bernie nomination increases the likelihood of another four years of the Donald. Our view is that politics should not be a major input in any investment process. There is too much emotion and not enough actual data supporting positive or negative political effects on prices. So we’ll simply let the market do what it is going to do, and adjust as our system tells us to do so.
- The Fed. The Fed once again started printing money in September. Last week, they began slowing these purchases slightly. Is it a coincidence that volatility has returned as the Fed begins to slow down its printing machine?
Despite the other potential reasons, it appears that the likely culprit for this selloff is in-fact fears over the potential effects of the corona-virus.
First, let’s examine the current market structure before going into more about the corona-virus potential.
In the first chart below, the S&P 500 Index shows just how rapidly this market has declined. The index is now flat for the year after falling over over 5% in just three days. Monday’s decline of over 3.5% made up the bulk of this decline.
Looking across this chart, however, shows that prices are settling in where the market found support a few times in both early and late January. So where the market currently sits could very easily be a spot to make an attempt at a bounce higher.
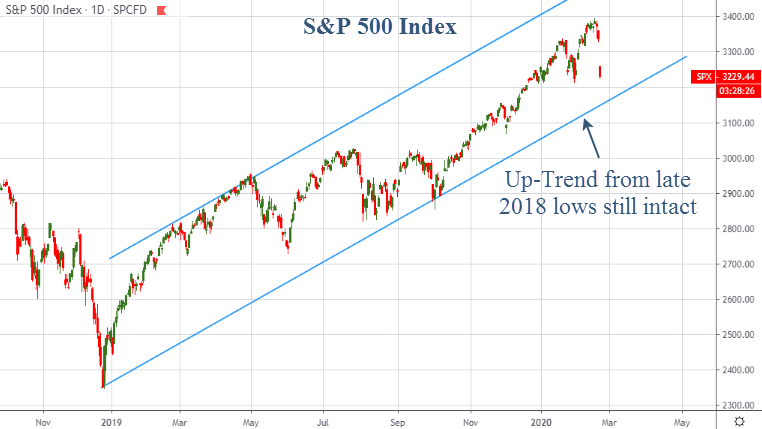
Zooming out a bit shows that the overall trend higher from the lows of late 2018 is still very much intact.
The chart below shows the S&P 500 since late 2018. Another area of support could be the rising blue trendline. Currently, the lower trendline of the two is at the 3150-3200 level. This would suggest that prices could fall another 2-3% before finding some footing.
Declines of 5-8% are a normal course of business when investing. The problem is we don’t know when a 5% loss is going to stop and reverse, and when it is going to turn into a 20% loss.
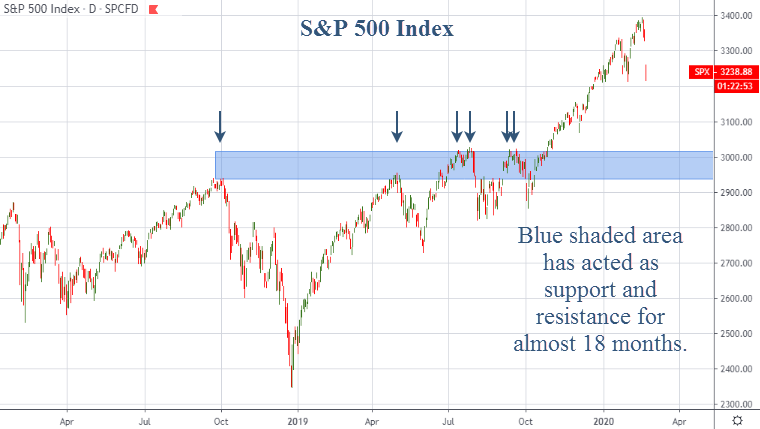
Zooming out even further shows that the market could in fact fall much further before finding support. The blue shaded area in the chart below is roughly at the 3000 level.
A retest of this area would suggest another 7-10% decline from current levels.
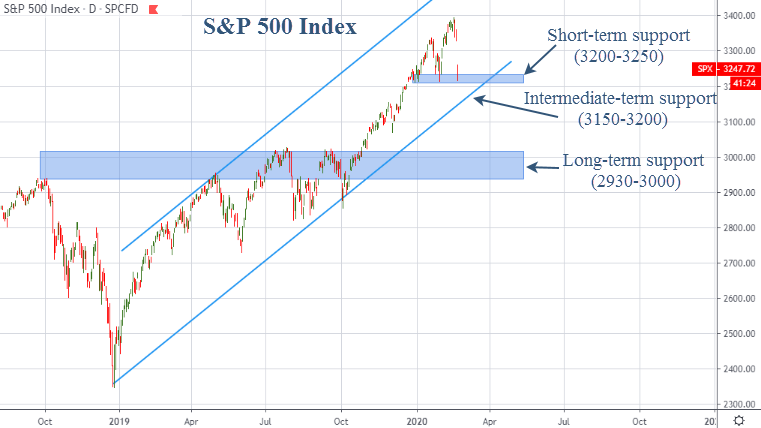
Putting these support levels together on the same chart below, we now have a more comprehensive view on where the market is likely to find buyers.
Another way to view it is that we now can see where risks are increased. If these support levels do not hold, the likelihood for further price declines increase.
Charts are a very easy and basic way to visualize and interpret complex data. Price data does not care “why”. When prices fall like they did today, charts don’t give an explanation. Neither does your brokerage statement.
So far, the charts are telling us that while 5% losses are not comfortable, there has really been no major damage done to price just yet. It may very well happen, but it hasn’t happened yet.
Client Portfolios
Within client portfolios, we have been consistently over-weight technology over the past 6 months. One shift that is taking place right now is a rotation out of tech stocks and into other areas of the market. We have followed suit by making minor adjustments to portfolios to reduce the over-weight exposure to technology stocks.
The other shift that our system has given us happened about a month ago. Clients had exposure to emerging markets stocks, and our system got us out before volatility presented itself.
The main place where risks are being tangibly felt are in the emerging market equities space. Once again, the US stock market is the place to be. Our clients have zero exposure to international stocks, and it frankly doesn’t look like that will change for at least months into the future. Maybe the corona-virus fears will subside, and this area will once again be attractive, but for now our process has us avoiding that exposure.
And until price actually tells us that it is time to be worried, we quite simply shouldn’t be worried. And despite today’s large selloff, the prudent course of action is to wait until sell signals are generated, and continue to look for opportunities to invest.
Corona-Virus Risks
Until the past few days, markets have generally been shrugging off the potential risks of a global pandemic due to the corona-virus.
We are not epidemiologists (people who deal with the incidence, distribution and possible control of disease). Nor do we claim to be. But we do understand markets and economies.
In fact, we think we understand markets so well that we know the actual price movements from an outbreak of a global pandemic cannot be fully understood in advance. So we are not going to try to predict what the market’s response to risks will be.
People who make bold predictions about how markets will react are either trying to sell something or are simply fooling themselves. Usually both.
But we can definitely understand the global economic impact, and use this knowledge to apply prudent risk management strategies to our client’s hard-earned wealth.
Corona-Virus Background
We’re not going to get into details about the corona-virus background here, but if you’d like a primer, we suggest visiting the CDC website: https://www.cdc.gov/coronavirus/index.html
What are the Potential Risks of a Global Pandemic?
For our purposes, we are not going to get into the most important risk, which is the risks to lives of countless people across the globe. This is the ultimate risk, and cannot possibly be quantified. The loss to families, and society as a whole, is beyond the scope of this publication. Instead, we will focus on economic and market risks.
In our opinion, there are three categories of risks:
- Fears that materialize into reality
- Temporary impacts that are recovered
- Longer-term impacts that result in a global demand shift
Each of these categories of risks apply both to markets and actual economic activity. By categorizing risks in this way, we can begin to have “sign-posts” to determine the tangible impact of the virus.
Fears that Materialize into Reality
The financial markets are the most obvious and immediate place where fears express themselves. A 3% loss in one day is not unheard of, but it’s also not extremely commonplace either.
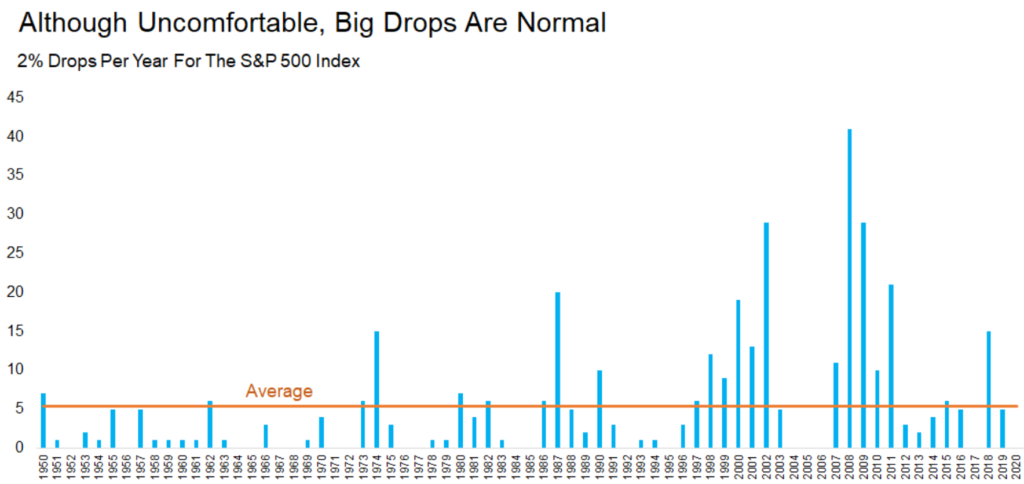
The chart below, from LPL finanical’s Ryan Detrick, shows how many 2% drops have happened each year since 1950. It shows that big daily losses are usually clustered within larger bear markets.
The major bear markets over the past 70 years occurred in 2008, 2000, 1987 and the 1970’s. This is exactly where the spikes on the charts occurred.
A 5% pullback from all-time highs is not a major bear market condition. However, if fears continue to mount, they could materialize in a broader, more damaging market decline.
The other primary place where fears can materialize into reality is in consumer spending habits.
In China, quarantined cities are obviously causing spending declines across large parts of the economy. Italy recently began quarantining people to reduce interactions and theoretically slow the spread of the virus. This has tangible impacts to these local economies.
There are a variety of economic indicators that measure consumer spending and consumer behavior. If the US consumer begins tightening their belts, then we could see real economic impacts from the fear of the virus.
Consumer spending data should be watched closely. Weakness in this important area will tell us if fears are becoming reality.
The question then becomes, how long might tangible economic and market risks last?
Temporary Impacts that are Recovered
If the virus is contained within weeks or months, then the most likely economic outcome is a temporary decline in activity, followed by a strong rebound to pre-crisis levels.
A major supply chain disruption is the major economic risk of the corona-virus. If goods can’t be manufactured, or if parts can’t be transported from Asia, then sales slow and the economy as a whole starts to sputter.
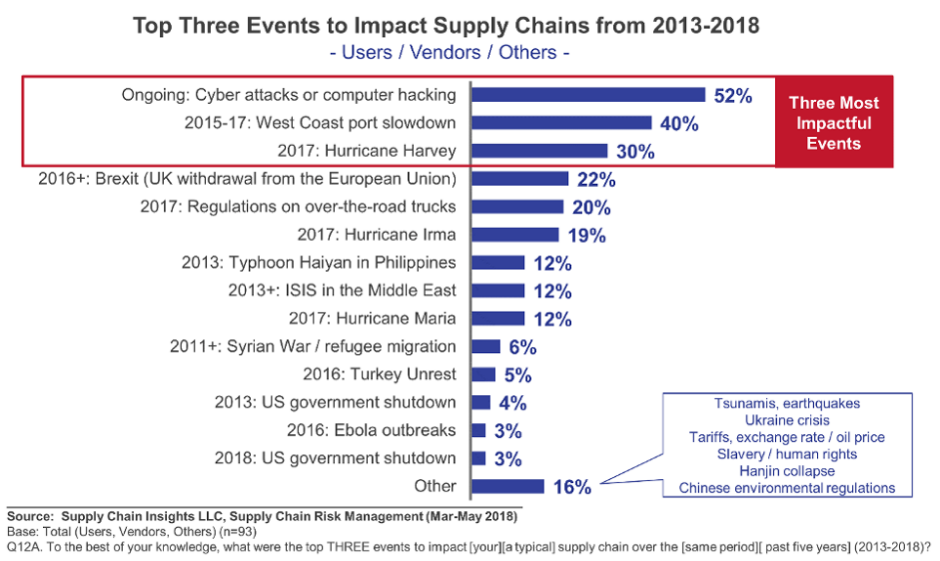
There have been major supply chain disruptions in the past. The chart below shows major disruptions that occurred between 2013-2018.
This chart shows that while disruptions occur, they tend to be transitory. None of the disruptions listed caused a recession.
However, if we look at the duration of these events, with the exception of ongoing cyber attacks, each of these events were very finite in nature. The West Coast Port slowdown, Hurricane Harvey, and Brexit are all very short term occurrences. Short term disruptions logically would lead to short term effects.
Short-term disruptions suggest that demand is simply pushed forward until the supply chain disruption is corrected and goods can flow through the economy in a normal fashion.
What kind of dip the economy may undergo is difficult to predict. We should expect that US GDP is somewhat weak this quarter. We know that global GDP is going to be hit hard because of the quarantines in China and other Asian countries. If the virus spreads in Europe beyond Italy, then global GDP will get hit even harder.
It is logical to assume that the longer a disruption occurs, the more likely it is to have longer-term effects.
Longer-term Impacts that Result in a Global Demand Shift
These are the major economic and market risks that corona-virus presents:
- Supply chains shut down for months or quarters.
- Consumer habits change and the demand for goods permanently decrease.
- Revenues decline not only for a quarter but for years into the future.
- Prices on stocks move lower for a much longer period of time reflecting a new paradigm of lower revenues.
These risks are unknown right now. But there are some very real, and very negative potential outcomes that could happen.
Bottom line, we view the risks of a corona-virus pandemic in the form of a statistical probability distribution.
A “normal” distribution is one that is predictable. The flu, while killing many more people each year, is fairly predictable. The CDC estimates that as many as 56,000 people die each year from the flu. This is an awful number.
But the likelihood that 56 Million people will die this year from the flu is very low, and almost impossible.
But the corona-virus has a “fat left tail”. This means that there could be a higher probability of major lives lost that go far beyond the number of people who die each year from the flu.
This is the core of the corona-virus fear. Not what is, but what might be.
Our view is that we cannot predict what will happen. If the virus spreads, there will be tangible impacts that will affect your portfolio. And if those tangible impacts exceed the amount of risks we are prudently willing to take to help our clients achieve their financial goals, then we will increase cash and move to the sidelines.
But those effects are currently not present. So we will continue to apply our process and adapt as things change.
Do not let emotion drive your investing behavior.
Invest Wisely!
Our clients have unique and meaningful goals.
We help clients achieve those goals through forward-thinking portfolios, principled advice, a deep understanding of financial markets, and an innovative fee structure.
Contact us for a Consultation.
Neither the information provided nor any opinion expressed constitutes a solicitation for the purchase or sale of any security. The investments and investment strategies identified herein may not be suitable for all investors. The appropriateness of a particular investment will depend upon an investor’s individual circumstances and objectives. *The information contained herein has been obtained from sources that are believed to be reliable. However, IronBridge does not independently verify the accuracy of this information and makes no representations as to its accuracy or completeness. Disclaimer This presentation is for informational purposes only. All opinions and estimates constitute our judgment as of the date of this communication and are subject to change without notice. > Neither the information provided nor any opinion expressed constitutes a solicitation for the purchase or sale of any security. The investments and investment strategies identified herein may not be suitable for all investors. The appropriateness of a particular investment will depend upon an investor’s individual circumstances and objectives. *The information contained herein has been obtained from sources that are believed to be reliable. However, IronBridge does not independently verify the accuracy of this information and makes no representations as to its accuracy or completeness.


