We discuss the basics of Bitcoin, examine its exuberance, review our three pillars of investing, and look at whether crypto currencies are affecting other areas of the markets.
[maxbutton id=”5″ url=”https://ironbridge360.com/wp-content/uploads/2017/12/IronBridge-Insights-2017-12-01.pdf” text=”View PDF” ]
Insights Overview
MACRO Insights: What is Bitcoin?
The big story over the past few months is the meteoric rise of Bitcoin. No doubt it’s a hot market that has captured the public’s interest. But, what is it?
PORTFOLIO Insights: The Three Pillars of Investing
There are many ways to successfully invest. The most important part of any investment strategy is the process with which decisions are made. In our view, there are three primary contributors to returns. We call these “pillars” of our investment process, and it is through this lens that we view our client portfolios.
Market Microscope: Are Crypto Currencies Affecting the Markets?
The last week of November was an extremely interesting one with two out of five trading days with significantly more volatility than the world has become accustomed to. One of these days was likely highly correlated with what was occurring in the crypto currency markets.
On Our Radar
Budget Impasse: The next drama surrounding the budget is due Dec 8 and is flying under the radar as a recent tweet by Trump suggests there will be a government shutdown to end the year unless certain negotiations are completed.
Trump Taxes: We sent out an update on the Trump tax proposal the week of Oct 30. The details are still being negotiated, but it seems likely something is passed by year end.
FIT Model Update: Uptrend

Fundamental Overview: Goldman Sachs released a report this week that looked at today’s global bond, stock, and credit market valuations. The results were not good as they proclaimed, “It has seldom been the case that equities, bonds, and credit have been similarly expensive at the same time, only in the Roaring ’20s and the Golden ’50s. All good things must come to an end…there will be a bear market eventually”.
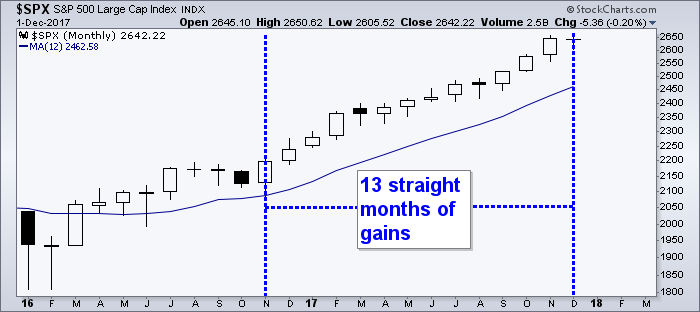
Investor Sentiment Overview: Stocks have never risen for 13 months in a row…until Nov 2017, when stocks completed that feat for the first time ever.
Technical Overview: The recent weakness in tech has our attention, as some stocks have sold off substantially, but thus far little technical damage has been done at the sector or index levels.
Focus Chart
The Shoeshine Boy
Have you ever heard the story of the shoeshine boy?
The story goes that in 1929 one famous investor was able to exit the stock market prior to its 80% crash in price because the young boy that shined his shoes started giving him stock advice.
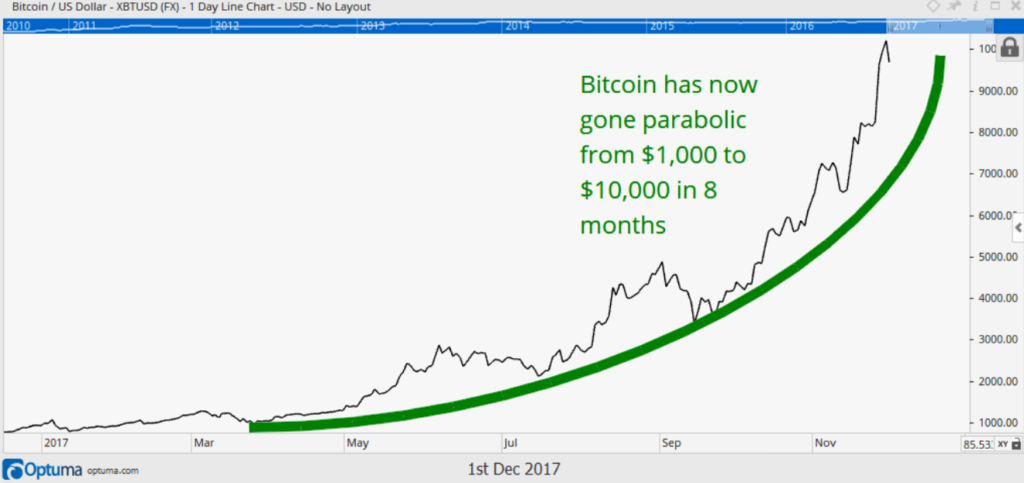
The thesis is that by the time the shoeshine boy starts to get in on the act, the rest of the world has too. In 2017 the price of 1 Bitcoin has risen from under $1,000 to over $10,000 as it’s peppered all over the news.
Is Bitcoin today’s shoeshine boy parallel?
Portfolio Insight
Three Pillars of Our Investment Strategy
“If you can’t describe what you’re doing as a process, you don’t know what you’re doing.”
– W Edwards Deming
There are many ways to successfully invest, but the most important part of any investment strategy is the process with which decisions are made.
In our view, there are three primary contributors to returns. We call these “pillars” of our investment process, and it is through this lens that we view our client portfolios.
The three investment pillars are:
- Participation
- Momentum
- Risk Management
Let’s look at the first pillar: Participation. This is fairly simple…the goal is to participate in favorable markets. Anyone who invests in an index fund takes this approach. Don’t get too fancy, don’t overthink things, just gain exposure to a particular market in your portfolio.
Most of the time this market is US Equities. But participation also includes other areas, such as bonds, international stocks, commodities, etc. Most people focus on this part of the investment process, as witnessed in the widespread popularity of index funds over the past 10 years.
Because we have been in a good market for so many years, many people don’t think about the opposite of participation. What markets do we NOT want to participate in? Sometimes we want to avoid certain parts of the market either because they aren’t as strong as other areas, or worse, they are declining in value.
The second pillar attempts to out-pace the broader market. This is called Momentum investing. The analogy we tend to make is that an index is like a car driving down the highway at 65 mph. But the index is simply an average of all of its components. At any given time, there are “cars” that are driving 75 or 80 mph, while others are only going 35.
Momentum investing attempts to identify the investments that are accelerating past the average, and get out of those investments once this acceleration stops.
The third pillar is only applicable during times of market stress. Risk Management is not en vogue right now, but that doesn’t mean it should not be practiced. In fact, we believe risk management to be the single biggest contributor to returns over time.
The issue with risk management is that it only really gets its time to shine once every 5-10 years. But when it does, having effective risk controls is the most important tool an investor has at his or her disposal.
Much of this issue is dedicated to Bitcoin given its popularity right now. There is no question that momentum is extremely high in Bitcoin, and has been all year, and our clients could potentially earn very high returns if we allocated a certain exposure to crypto currencies and they continued to perform.
This is where we as wealth managers must make a difficult decision. We conclude that this is an area of the market we are choosing NOT to participate in. Momentum is just one of our investment pillars.
With Bitcoin moving in price sometimes 10-20% in a day, we cannot possibly apply a prudent set of risk management strategies to an asset of this nature. To us,momentum does not trump risk management.
Macro Insight
What’s the Deal with Bitcoin?
Bitcoin has been a hot topic recently. Its ascent from $1,000 to over $11,000 this year has received increased coverage on almost every news outlet, and now it is tough to leave a party without hearing somebody mention it. It now has a huge cult following, has been banned in China, and has even gained attention from hedge fund managers as they scramble to raise new funds to take advantage of the latest craze. But what in the world is Bitcoin anyways?
What is a Crypto Currency?
At is most basic form, a crypto currency is nothing more than an entry in an electronic database that no one can change without fulfilling specific conditions. Bitcoin was the first and most popular of these crypto currencies. Now, it is only one of over 1,000+ crypto currencies.
We view Bitcoin as having two separate identities:
- It’s use as a Digital Currency
- The Blockchain technology powering them.
How did it get started?
Bitcoin was designed to be a purely peer-to-peer version of electronic cash that could avoid being processed through a financial institution. The original software for Bitcoin is a technology called “blockchain”. It was developed by a person or group of people using the pseudonym Satoshi Nakamoto. You can view the original white paper by clicking here.
Bitcoin as a Digital Currency
Bitcoin is a digital “currency”, meaning it can only be transacted online. It has no physical form, and is not redeemable for any other commodity such as gold. Its currency value resides only in two ways: 1) the willingness of other people to use another acceptable form of payment (such as US Dollars or Euros) to “buy” someone else’s Bitcoin; and 2) the willingness of a business or individual to accept Bitcoin as a form of payment itself.
The first of these values seems widespread (at least for now) with more than 10MM+ accounts opened on Coinbase, the U.S.’s most popular website used to buy and sell crypto currencies. Bitcoin’s meteoric rise in price has helped fuel the recent demand to “get in on the action”.
But the second of the values, those willing to accept Bitcoin as payment, is still in its infancy. You can’t use a Bitcoin at Wal-Mart, for instance. The graphic below, summarized from an article from steemit.com, reveals the current locations that accept Bitcoin. Looking at the list, besides Overstock and Microsoft, the adoption by large vendors has been very slow and likely disappointing for Bitcoin enthusiasts.
Even those firms like Overstock.com and Microsoft must still convert their crypto currencies back to a more widely accepted value, for reporting and other purposes, likely leading them to immediately redeem any Bitcoins back for Dollars for all the purchases made using Bitcoin. This in and of itself brings into question Bitcoin’s relevance as a replacement currency.
How are Bitcoins Created?
One other key aspect of Bitcoin, that not all crypto currencies can claim is its supply limitation. Bitcoin has an innovative feature which caps its supply. For every new “coin” that is “mined”, the “miner” (someone with a very high powered computer) must solve harder and harder puzzles which require more and more time and/or processing power. The supply is also capped at 21MM coins, so once those 21MM coins are mined, then there will be no more created (21MM is projected to be reached by 2140).
Originally this cap on supply made it extremely attractive as a currency alternative since the currency would not be able to be diluted. However, with more than 1,000 other crypto currencies now in existence. It seems the supply of crypto as a whole is unlimited with no cap on supply, likely lessening its attractiveness as a replacement currency.
What is Blockchain Technology?
In our view, the biggest potential impact from Bitcoin is from its technology. Blockchain technology is an innovative technology that allows digital information to be distributed but not copied. Picture a spreadsheet or document that is duplicated thousands of times across a network of computers. Information is available to all users once it is shared.
In the illustration below, the initial “information” being distributed is a Bitcoin transaction. One person is selling Bitcoin, while another is buying it using a currency such as US dollars. Once the transaction is requested, it is broadcast to a broad network of computers for validation.
A transaction does not need to involve Bitcoin. It could involve contracts, public records, financial transactions, internal company documents, or any variety of information. Once verified, the transaction is time-stamped, and a new “block” of data is entered onto a digital ledger. Similar to sending an email or a fax, once it is sent it cannot be changed.
All subsequent transactions are then added to the “chain”. So once the transaction is complete and verified, the record of it cannot be altered. The theory is that by sharing transactions among many different independent users, these blocks of information cannot be modified by a single user, has transparency among all of its users, and has no single point of failure.
Are we going to invest in Bitcoin?
Bitcoin is extremely popular right now, as evidenced both by its meteoric price rise, but also by the amount of people talking about it. There are certainly some merits to it, such as the blockchain technology.
However, we believe we are witnessing a speculative fever right now in Bitcoin for a multitude of reasons: we also have heard multiple stories of young kids becoming rich by trading it; we are witnessing the price of Bitcoin go parabolic; it’s being discussed on every news channel.
We believe many investors are confusing the potential of the technology with the value of a Bitcoin. When taking into account all the considerations for a prudent investment, Bitcoin does not meet any of our standards.
In the Market Microscope section we look at some of these in more detail along with a chart of Bitcoin’s price since 2016.
Market Microscope
Do Crypto Currencies Affect other Areas of the Market?
Crypto Currencies
What do the six tickers listed have to do with one another? Here is a hint: they are all in the same industry as represented by the final ticker, which is a popular ETF for that industry.![]()
These tickers are all semiconductor companies and the Semiconductor Holders ETF (SMH), and their prices all got crushed on Wednesday, Nov 30 as outlined in the graphic. So on a day when the S&P 500 was flat, why did these stocks fare so poorly? Our speculation is that some equities are being thought of as plays on crypto-currencies.
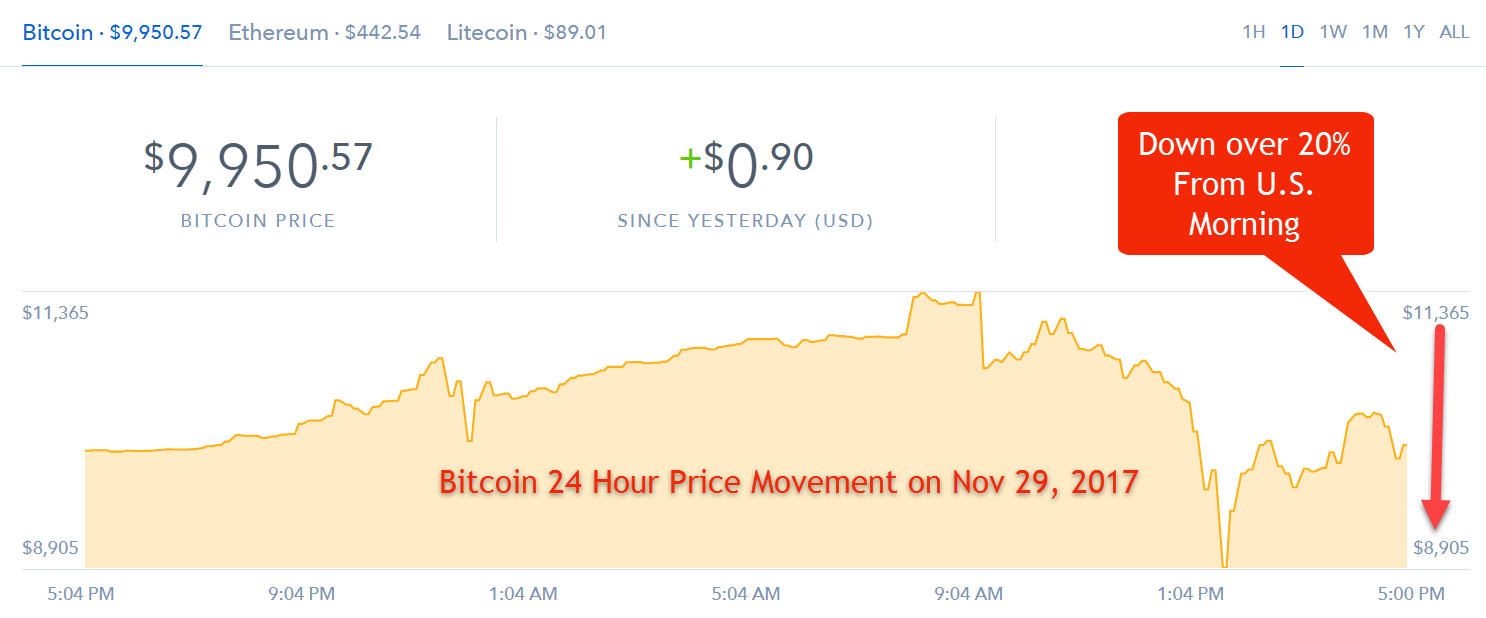
The thought process goes like this: many of these currencies, Bitcoin for instance, need very high computing power to mine “coins”. These coins become more attractive at higher prices as breakeven costs get lower, but they also look more unattractive as price declines. Now check out the next chart, from Coinbase, the U.S.’s most popular exchange for Bitcoins, with over 10 Million accounts.
On that same day, Bitcoin opened U.S. trading well above $11,000, but it proceeded to swiftly fall below $9,000, over 20% from its peak just a few hours earlier. During that time that largest exchange for Bitcoin, CoinBase, went offline as any owners of the crypto-currency were essentially held hostage. Bitcoin also wasn’t the only crypto to fall so much, most of the larger ones all fell in price.Nobody in the media was talking about how the semiconductors likely fell victim to their relationship with crypto currencies, wanted or not.
Similarly some of the run up in these semiconductor stocks are also likely because of the crypto boom that has been occurring. Over the past one year, the semiconductor holdings ETF is up over 40%, more than double that of the S&P during the same time.Live by the sword, die by the sword we suppose, as owners of semi conductor stocks, like it or not, should be paying attention to Bitcoin’s price. If it crashes, it’s likely semis will too.
Bitcoin going Parabolic
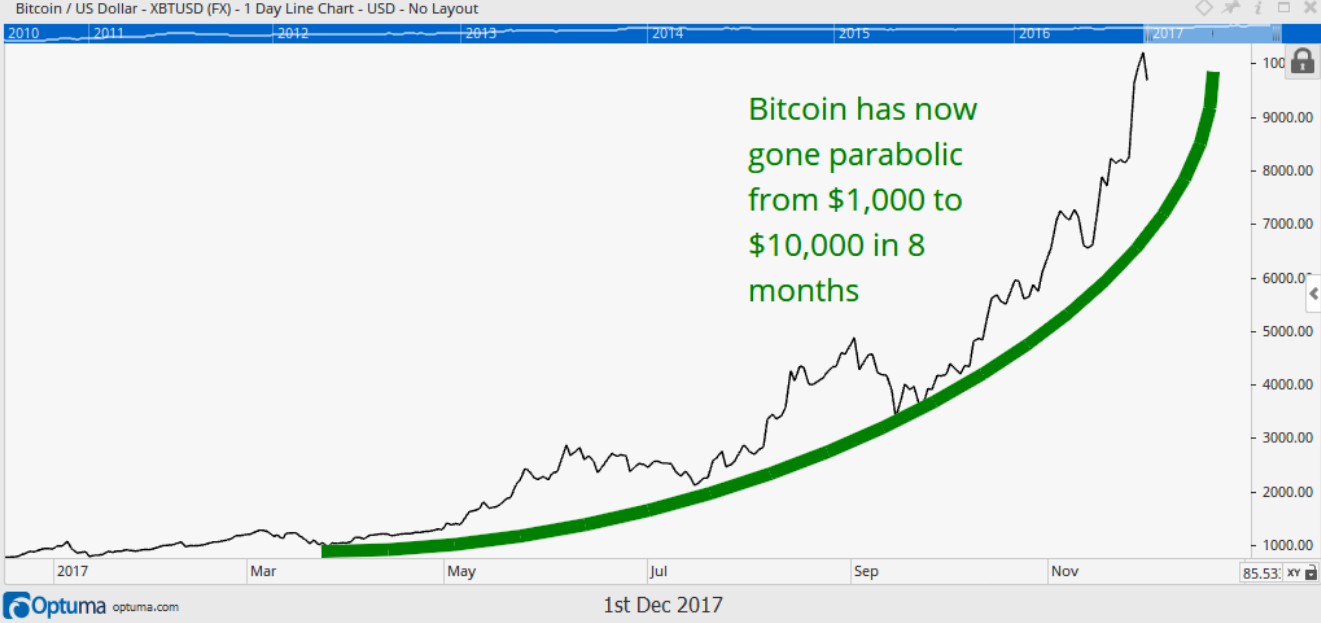
The chart below shows us Bitcoin’s price history since 2016.
On the chart we have also drawn a parabolic trendline to show the speculative nature of its price rise since March as it has moved from under $1,000 to north of $10,000.
As students of the market’s history, we recognize this chart as a big warning sign. It’s rare for prices to move parabolically, but when they do, they almost always have massive corrections once the parabolic move is finished.
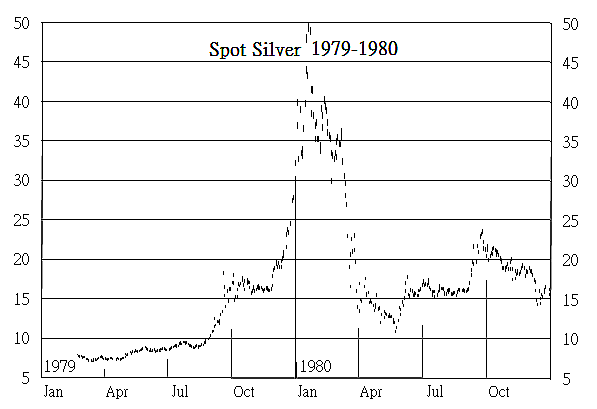
The next chart reveals one example in history when there was a similar parabolic price move. In the late 1970’s inflation had gripped America, and there was no better place to see the response to that inflation than in the price of the precious metals.
Over a two month period leading into January 1980 silver’s price went parabolic, tripling in price from under $20 per ounce to over $45 per ounce. The chart shows the parabolic nature as prices increased in their rate of ascent.
However, once that crescendo was reached, prices came roaring back down. In this case prices moved back below where that parabola started. In Bitcoin’s case this would be back below $1,000.
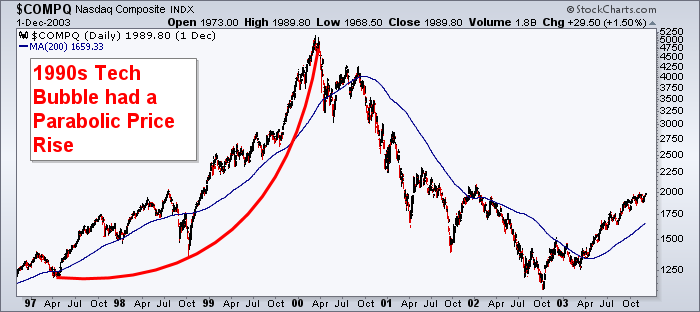
Another example is shown next. We all remember the tech “bubble”, right? Well prices of technology stocks back then also moved in a parabola as depicted on the chart of the Nasdaq.
Once that parabola was complete, those prices also came crashing back to earth just as quickly as they rose. Stock market technical analysts recognize the increased danger in a market that has become parabolic.
Bitcoin seems to be behaving that way right now. All the talk, attention, and euphoria surrounding it only adds value to the thesis that it too will eventually come crashing back down.
Stock Market
The Dow and S&P avoided most of the fireworks this week and as mentioned in the FIT Model Conclusion from the Summary page of this report, the S&P has now set an all time record with 13 straight months of positive performance. It’s as if the stock market will never go down again (said with tongue in cheek)! The first chart below shows this bullish streak, but until we start to see that trend slowing, and then rolling over, we will continue to try to take advantage of it.
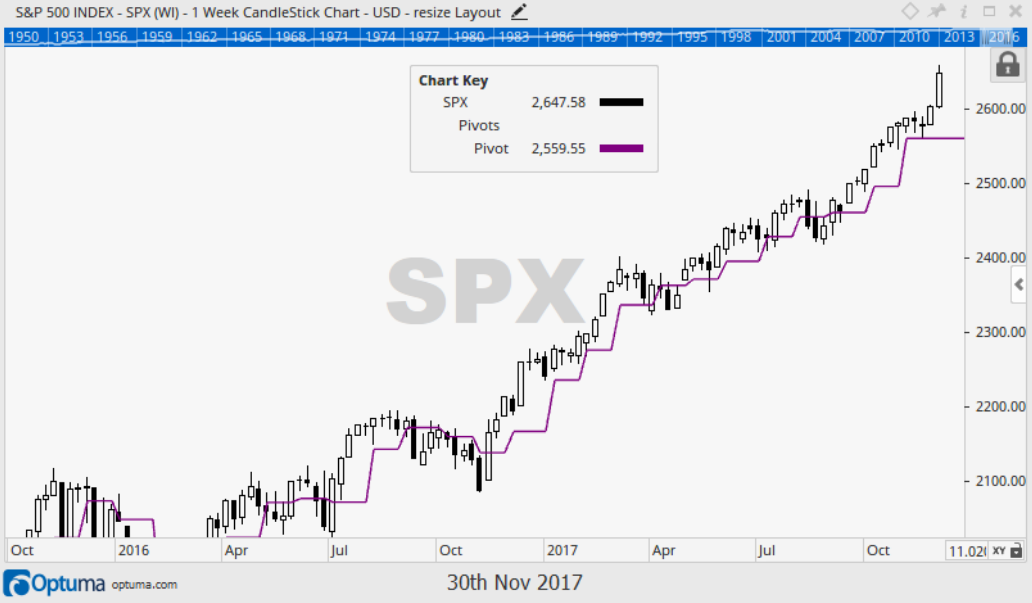
So what are we looking for right now to help us warn of the next pullback? We are watching what is known as the market’s Pivot Points to tell us what trend the market is in. Pivot Point is really just a fancy way of saying average price, and it is somewhat similar to a moving average. It’s calculation is the prior period’s (high+low+close)/3 to come up with a quick estimate of the average price paid during that period.
The next chart outlines the Monthly Pivot Point in purple. Notice that these levels “reset” every month as the period on the chart changes. With the switch from November to December, we also have a new Pivot Point to watch as we move into the final month of the year. October’s average price paid was $2560 (shown on the chart), and November’s average price paid was $2621, which is now December’s Pivot Point and the level we are watching.
Notice also how these levels have been rising along with the market ever since last November? As long as price stays above its Pivot Point, it shows us that the trend continues upward. When price starts falling below the Pivot it will warn us that the trend has slowed and the risk of a larger pullback has increased. That is the next clue we are watching to warn that the market’s nonstop ascent may be temporarily over.
Our clients have unique and meaningful goals.
We help clients achieve those goals through forward-thinking portfolios, principled advice, a deep understanding of financial markets, and an innovative fee structure.
Contact us for a Consultation.
Disclaimer This presentation is for informational purposes only. All opinions and estimates constitute our judgment as of the date of this communication and are subject to change without notice. > Neither the information provided nor any opinion expressed constitutes a solicitation for the purchase or sale of any security. The investments and investment strategies identified herein may not be suitable for all investors. The appropriateness of a particular investment will depend upon an investor’s individual circumstances and objectives. *The information contained herein has been obtained from sources that are believed to be reliable. However, Ironbridge does not independently verify the accuracy of this information and makes no representations as to its accuracy or completeness.
