• Skip to main content
  • Skip to footer

IronBridge Private Wealth

Forward with Confidence

  • Home
  • Difference
  • Process
  • Services
  • Insights
    • IronBridge Insights
    • Strategic Wealth Blog
    • Strategic Growth Video Podcast
    • YouTube Channel
  • Team
  • Clients
  • Form CRS
  • Contact Us

Special Report

Two Very Important Days

February 15, 2018

We believe the next 1-2 days are the most important that the market has experienced since 2016.  The market has had a strong bounce from the lows made last week, so we now focus our attention important levels in the markets to watch for next.


Now What?

Following last week’s strong decline in the markets, the past five days have shown positive price movement higher.

As we said last week, “Given the violent nature of this pullback, we would not be surprised to see snap-back rallies that are also equally strong.” We have now seen a strong snap-back rally.  The question is where do we go from here? It is impossible to know for sure, but let’s look at the levels we find important right now.

S&P 500 Index

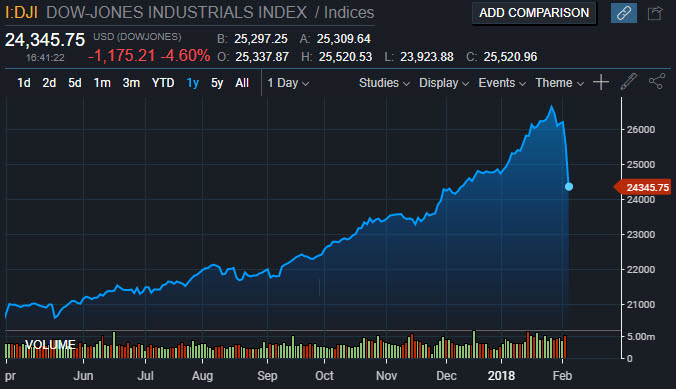
We’re keeping this update brief, so let’s let the charts do the talking. The chart below of the most widely held US stock index fund shows a few important things:

  1. The 12% decline stopped at the 200-day moving average (200dMA) (blue line). This is a very common technical level that many market participants watch. It is simply the average price of the index over the past 200 days. It is not surprising to see a pullback stop here, and it was very positive that the market held this important level.
  2. Volume increased on the decline, but has fallen on the rebound. Granted, volume is not nearly as important as it used to be in market analysis, but we would prefer to see volume increasing as the market is rising. Declining volume is a sign that there is lack of conviction in the recent rise.
  3. The market has bounced to a key 50-62% retracement level. This means that the market rise this week has recouped just over half of the previous decline. This is also a very common technical level that many people (and computers) watch.

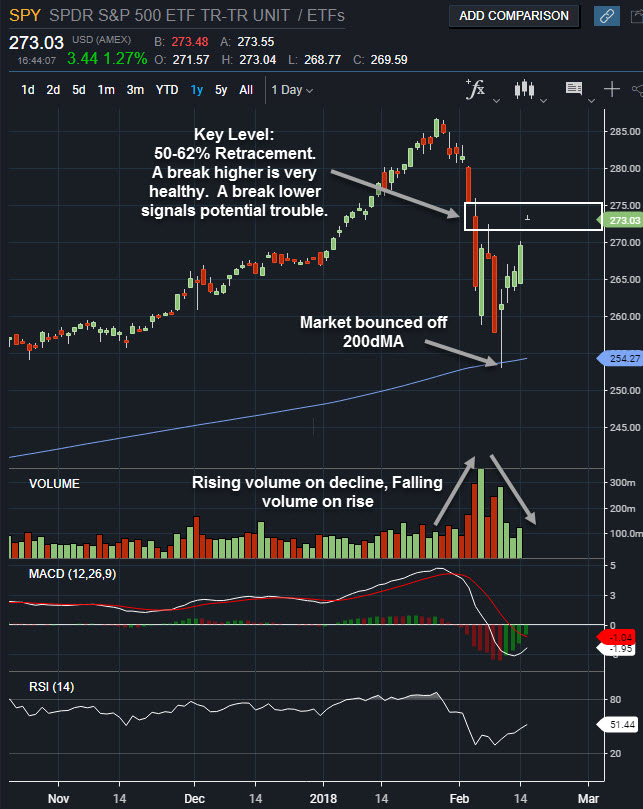
If the market can sustain a break above the 50-62% retracement level, chances start to greatly improve that the market volatility is behind us. However, if the market starts to move lower from this level, the likelihood rises dramatically that we see the market back near the lows of last week, and potentially lower.

Thus, we believe we are currently in the most important 1-2 days during this entire volatile time. In fact, it is likely the most important two days the market has had since early 2016.

We stress that we have both entry and exit signals in place for our clients, and we are not attempting to guess which way the market will go from here. Any new exposure to stocks we add for clients will subsequently have very tight stop losses here.

Fixed Income

The bond market continues to show signs of stress. In fact, bonds are underperforming stocks so far this year, and showed no positive movements during the selloff. We have discussed rising yields many times, but we continue to stress that the fixed income markets have risks today that have not been seen in almost four decades.

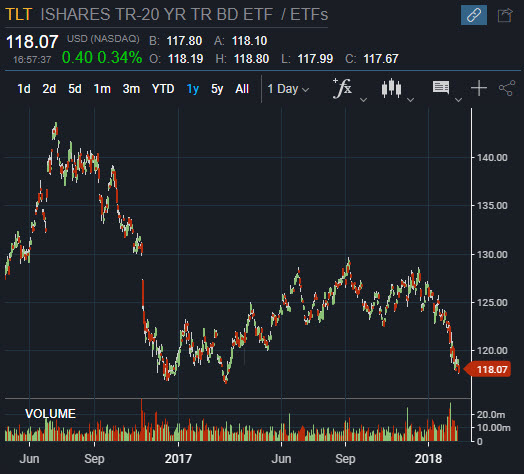
The chart below shows the ticker TLT, which is a fund that holds long-term US treasury bonds. The price has fallen 18% over the past year-and-a-half, as yields have moved above 3%.

Common wisdom would suggest that US Treasury Bonds would perform very well in an environment where stocks fell 12% in a week. The right side of the chart shows that there was no movement into these supposed safe havens.

Price breaking down here also suggests entering into a period of increased selling pressure on bonds, with a continued rising rate environment. We think this scenario is very likely.


Bottom Line

We are taking a prudent and disciplined approach to this period of volatility. We hope the market continues to move higher, and hope we get signals to increase client exposure to risk. But as we’ve said before, hope is not an investment strategy.

The next 1-2 days in the markets are critical to near-term performance, and we are watching very closely.

Disclaimer This presentation is for informational purposes only. All opinions and estimates constitute our judgment as of the date of this communication and are subject to change without notice. > Neither the information provided nor any opinion expressed constitutes a solicitation for the purchase or sale of any security. The investments and investment strategies identified herein may not be suitable for all investors. The appropriateness of a particular investment will depend upon an investor’s individual circumstances and objectives. *The information contained herein has been obtained from sources that are believed to be reliable. However, IronBridge does not independently verify the accuracy of this information and makes no representations as to its accuracy or completeness.

Filed Under: Special Report

Special Report: Dow Jones Biggest Point Decline in History

February 5, 2018

The stock market has had a violent two-day selloff, resulting in the S&P 500 down 8.24% from the all-time high reached last week.  In this Special Report, we look at the reasons behind the selloff, what we have done in client portfolios, and what to expect next.


What Happened?

The Dow Jones Industrial Average was down 1,175 points today (the largest point decline in history), following a 665-point selloff on Friday.

So what drove this selloff?

First of all, stock markets are very complex systems, and there is usually no one “thing” that moves markets up or down. We have been watching various technical indicators that showed a stretched market that was vulnerable to a pullback. This is exactly what we are seeing now.

What is most surprising is how violent this move has been. We think these are the following reasons for the selloff:

  1. Overextended Market Conditions. Various measures we watch to understand the underlying health of the market were showing signs of a well-overdue pause in the strong uptrend from last year. We discuss these items in the next section below.
  2. Increased Computer Trading. There are many algorithms that participate in buying and selling of stocks, and this has led to an increase in the velocity of sell orders in the past decade. Once selling begins, it can snowball into increased selling across various markets.
  3. Political Risk. A new Fed chair was officially sworn in, and given the impact the Federal Reserve has had on asset prices in recent years, there could easily be profit taking on this news. Political uncertainties continue around various FBI investigations, and the tax cut has now become old news.
  4. Decreased Liquidity.  Almost every selloff in markets is driven by changes in liquidity.  What has been a fairly liquid market over the past year shows us that when liquidity is reduced, markets fall.

The chart above shows the Dow Jones Industrial Average since last summer. The massive selloff of the past week is reflected on the right of the chart. What was a calm, consistent move higher has changed rather dramatically.

There is an old saying the markets “Go up the stairs and down the elevator”. That certainly is the case right now.

It’s All About the Flow

Bottom line, market prices are ultimately about the amount of buyers and sellers in the market. We refer to this as asset flow.  There are very large investing groups in the markets whose strategies can move asset prices. One of these large investor types are called Risk Parity funds.

Goldman Sachs released a report today that discussed the potential for continued selling pressure over the next week due to these types of systematic trading funds. If their conclusion is correct, then small cap stocks and emerging market stocks may see the brunt of the selling pressure near term.

The past week has had a market with many more sellers than buyers. Fortunately, there has not been a dramatic increase in volume, suggesting that we are seeing a lack of buyers causing the markets to decline, not necessarily an increase in the amount of sellers. That doesn’t make the decline less painful, but is does suggest the selling pressure is not as bad as what the market declines show.


What Did We Do Today?


We adhere to a disciplined risk management process, designed to help our clients withstand these kinds of shocks through the use of our different investment strategies. Although the markets have seen major selling, our investment process has prepared us for how to handle this kind of move. Our process includes:

  • Aligning our clients’ investment portfolios with their individual goals. Do not take unnecessary risks.
  • Unlike most wealth managers, we are not afraid to move to cash to wait things out. We do this in an unemotional and disciplined way, only when our signals tell us to (see more about this in the paragraph below).
  • We have exit strategies in place on every position, so that we know when to get out and move on to something else.
  • We have been shifting our bond focus to funds that take better advantage of rising interest rates, and these funds have been mostly immune to the recent pullback.
  • We have re-entry signals in client portfolios, so that funds moved to the sidelines have a strategy to get back invested. This also includes clients with cash on the sidelines looking to invest.

Ok that’s nice, but what did we actually DO?

Today, we had sell signals occur in our proprietary trend model, and exited our S&P 500 index position for the first time since last August. The proceeds were moved to cash. We also had other sell signals trigger on various individual stock positions. On the whole, our clients had anywhere between 10% to 18% of their portfolio move from stocks to cash this morning, before much of the fireworks began this afternoon.

The last time our trend model had a sell signal was in August. This portion of client portfolios were in cash for 10 days before getting a re-entry signal. In our work doing back-testing of our strategies, this sell signal had times where it was in cash for months before having a new buy signal. Bottom line, we are going to listen to our signals and act accordingly.

Previous Steps Taken for Clients

It is not simply what we did today that is important. Over the past two months, our investment signals have consistently moved our clients stock exposure into large-cap US stocks, and out of the more aggressive areas of the market such as Small Caps and International stocks. The market has been giving signals to maintain exposure to stocks, but in the more conservative areas of the markets. We listened to these signals, acted upon them, and as a result our clients had very little to no exposure to international stocks and small caps, where the brunt of the selloff has happened.

Overall, we continue to monitor portfolios very closely many times throughout the day and have been taking steps to prepare for draw-downs such as today. We have exit and re-entry strategies in place, and we will execute our strategies with discipline.

Is the selloff over?

Honestly, we don’t know, but what we do know is we are prepared and ready for whatever the markets throw at us next. We list a few of the potential outcomes below.


What to Expect Next?

Every market selloff is slightly different. But we believe strongly that analyzing past markets will help give context as to what may be in store next.

We have written about this multiple times over the past few months. See our previous reports:

  • What Do Market Tops Look Like?
  • Have Investors Fallen Asleep at the Wheel?

What our analysis of previous market cycles reveal is that markets tend to undergo a longer-term process when forming major market tops. Maybe this time is different, but it usually isn’t.

What we expect is to see:

  • Continued volatility in the very near term as markets find their footing.
  • Given the violent nature of this pullback, we would not be surprised to see snap-back rallies that are also equally strong.
  • Increased uncertainty as investors nerves become more frayed.

We hope this is not the start of a larger bear market, and our analysis of previous cycles suggest it is not. But hope is not an investment strategy. We have put in the work so our clients can have peace of mind that we are taking every prudent step to address a variety potential market outcomes, good and bad.

Please let us know what questions you have. We welcome the dialogue and look forward to acting in your best interest.


Disclaimer This presentation is for informational purposes only. All opinions and estimates constitute our judgment as of the date of this communication and are subject to change without notice. > Neither the information provided nor any opinion expressed constitutes a solicitation for the purchase or sale of any security. The investments and investment strategies identified herein may not be suitable for all investors. The appropriateness of a particular investment will depend upon an investor’s individual circumstances and objectives. *The information contained herein has been obtained from sources that are believed to be reliable. However, IronBridge does not independently verify the accuracy of this information and makes no representations as to its accuracy or completeness.

Filed Under: Special Report

2018 Outlook

December 21, 2017

It’s that time of year again…the talking heads and ivory tower financial geniuses all disguise their wild guesses as well thought out analysis as to where markets will be at the end of next year.

Without question, there is value in thinking deeply about where markets may be headed. However, we believe that an effective outlook report helps identify potential catalysts that could change the direction of various markets, not a platform for a current day Nostradamus.

In this report, you won’t find specific projections on where the markets will be 12 months from now. (Spoiler alert…nobody knows).

What you will find is a collection of what we believe to be the most important characteristics of the current environment that have the highest potential to give us clues on what may be in store for 2018.

We hope you enjoy our Outlook Report, and welcome your feedback and discussion.

We also hope you and your loved ones have a safe and joyous holiday season, and a very prosperous 2018!

[maxbutton id=”5″ url=”https://ironbridge360.com/wp-content/uploads/2017/12/IronBridge-2018-Outlook-1.pdf” text=”2018 Outlook Report” ]


Filed Under: IronBridge Insights, Market Commentary, Special Report

Tax Reform Proposal: Corporate Tax Cut, Some Simplification and the Potential Market Impact

November 3, 2017

On Thursday, November 2nd, members of the US House of Representatives revealed an overview of their proposed tax bill.

Tax Reform Proposal

The plan announced on Thursday is only a proposal. This must pass the Senate to become law, and there may be changes to this proposal when all is said and done.  However, now that we are starting to get specific proposals, we can begin to identify the important points to determine which of our clients may need to take action.

We have not had a chance to fully analyze the proposed changes, and we are not tax advisers. But as fiduciaries, we feel it is important to present highlights of the proposal so our clients can begin to understand potential changes of tax reform, both positive and negative, and to begin conversations with their tax advisers about their best course of action.

The link below is to the House of Representatives Ways and Means Committee summary report of the proposed legislation. We do not view this link as an objective view of the proposal, but rather provide it as a reference for those who would like to view the source.

[maxbutton id=”1″ url=”https://ironbridge360.com/wp-content/uploads/2017/11/WM_TCJA_PolicyHighlights.pdf” text=”Summary of Tax Reform” ]

Proposed Individual Tax Changes

From an initial glance, there are no obvious winners and losers from this plan. The tax code is ridiculously complicated, and this plan may serve to simplify things a bit. But whether it will result in a reduction or increase of an individual’s net tax costs appears to be very dependent on how many itemized deductions a household takes.

Here are the notable changes:

  • Individual tax rates lowered for low- and middle-income Americans to Zero, 12%, 25%, and 35%; keeps tax rate for those making over $1 million at 39.6% (see the chart below).
  • Standard deduction increases from $6,350 to $12,000 for individuals and $12,700 to $24,000 for married couples.
  • Home mortgage interest deduction remains the same for existing mortgages and maintains the home mortgage interest deduction for newly purchased homes up to $500,000, half the current $1,000,000
  • State and local taxes (including property taxes) deducted up to $10,000
  • Alternative Minimum Tax repealed
  • Child Tax Credit increases from $1,000 to $1,600
  • Child and Dependent Care Tax Credit preserved
  • Earned Income Tax Credit preserved
  • 401(k)s and Individual Retirement Accounts unaffected
  • Capital Gains rates remain unchanged

What could this mean?

Before taking action on anything with tax implications, consult your tax adviser.

LARGE PURCHASES: Large purchases, such as homes, boats, etc, may have a bigger positive tax impact on certain people if purchased in 2017.

PROPERTY TAXES: A proposed cap of a $10,000 deduction of property taxes may have a very large impact on our clients, especially given home values and property tax rates in the Austin area. Travis County allows for people to pre-pay property taxes for multiple future years.

MORTGAGE INTEREST: The proposal would cap mortgage interest deduction for a home value at $500,000, down from $1,000,000. It appears that existing mortgage balances may be grandfathered.

Again, this is not law and these are only proposed changes. We will continue to monitor this and have discussion with our clients prior to year end regarding potential implications of your individual situation.


Proposed Corporate Tax Changes

The biggest beneficiary of the reform bill appears to be large corporations. Particularly those with large retained earnings overseas.

Highlights of the potential business/corporate tax reform:

  • Corporate tax rate lowered to 20%, down from 35%
  • Tax rate on business income reduced to no more than 25%
  • Individual wage income distinguished from “pass-through” business income
  • Allows businesses to immediately write off the full cost of new equipment
  • Multinational companies would, generally, no longer pay taxes on their active foreign income.
  • Interest Deduction capped at 30% of cash flow

All in all, it appears to be a net positive for companies, with the exception of those carrying high debt loads. See the next chart for an overview of the proposed business changes.


Potential Market Impact

This tax reform proposal is not news to the market. In our view, much of the potential impact may already be priced into stocks at this point.

The chart below shows the performance of the two baskets of stocks relative to the S&P 500. The top part of the chart is the Goldman Sachs high-tax basket of stocks. These stocks are the companies within the S&P 500 that have the highest net tax rate.

Following an initial surge after the 2016 election, high tax stocks have struggled to keep up with the overall market. The same is true for companies that do not have overseas exposure, specifically small-cap stocks.

The bottom part of the chart shows the Russell 2000 performance against the S&P 500. The Russell 2000 is an index of smaller company stocks that almost exclusively do business within the United States, and therefore have little if any earnings held overseas.

Again, these stocks surged after the election, but have struggled to keep pace for most of the year.

Part of this relative performance can be attributed to changes in currency. The US dollar has weakened most of this year, so larger companies with overseas operations have benefited from the currency appreciation of their overseas earnings.

But some of this could be from the market having doubts about the President’s ability to get a tax reform bill passed.

Our internal market signals have been showing improvements in small and mid-sized companies the past two weeks. We continue to monitor the market’s reaction to these developments.

Our view is that one should not attempt to anticipate how the market will react to the potential legislation. Instead, adhere to strict signals which ultimately include movements attributable to tax reform.


Bottom Line

From our initial analysis, this tax reform is best viewed as a corporate tax cut, with some simplification of the individual tax code. We do not view this proposal as an individual tax cut.

We suggest our clients take this same view, and should not expect meaningful tax relief come April. It could easily mean an increase in tax liability for many of our clients.


Disclaimer This presentation is for informational purposes only. All opinions and estimates constitute our judgment as of the date of this communication and are subject to change without notice. > Neither the information provided nor any opinion expressed constitutes a solicitation for the purchase or sale of any security. The investments and investment strategies identified herein may not be suitable for all investors. The appropriateness of a particular investment will depend upon an investor?s individual circumstances and objectives. *The information contained herein has been obtained from sources that are believed to be reliable. However, IronBridge does not independently verify the accuracy of this information and makes no representations as to its accuracy or completeness. IronBridge does not provide tax advice.

Filed Under: Special Report

  • « Go to Previous Page
  • Go to page 1
  • Go to page 2

Footer

LET'S CONNECT

  • Email
  • Facebook
  • Instagram
  • LinkedIn
  • Twitter

AUSTIN LOCATION

6420 Bee Caves Rd, Suite 201

Austin, Texas 78746

DISCLOSURES

Form ADV  |  Privacy Policy  |  Website Disclosures

  • Home
  • Difference
  • Process
  • Services
  • Insights
  • Team
  • Clients
  • Form CRS
  • Contact Us

Copyright © 2017-Present by IronBridge Private Wealth, LLC. All rights reserved.