In this issue we dig deeper into the possible market outcomes following the recent volatility, explain why market corrections are not healthy, and review portfolio changes and positioning.
[maxbutton id=”5″ url=”https://ironbridge360.com/wp-content/uploads/2018/02/IronBridge-Insights-2018-02-23.pdf” text=”View PDF” ]
Executive Summary
On Thursday, February 15, 2018 in our interim update we proclaimed “the next two days are the most important since 2016”. This is because the market was in the midst of a perfectly normal retracement in price after a swift selloff. The recent snap back rally was expected and is something that occurs after every big selloff, but what comes next in our opinion is the real key to the market’s intentions.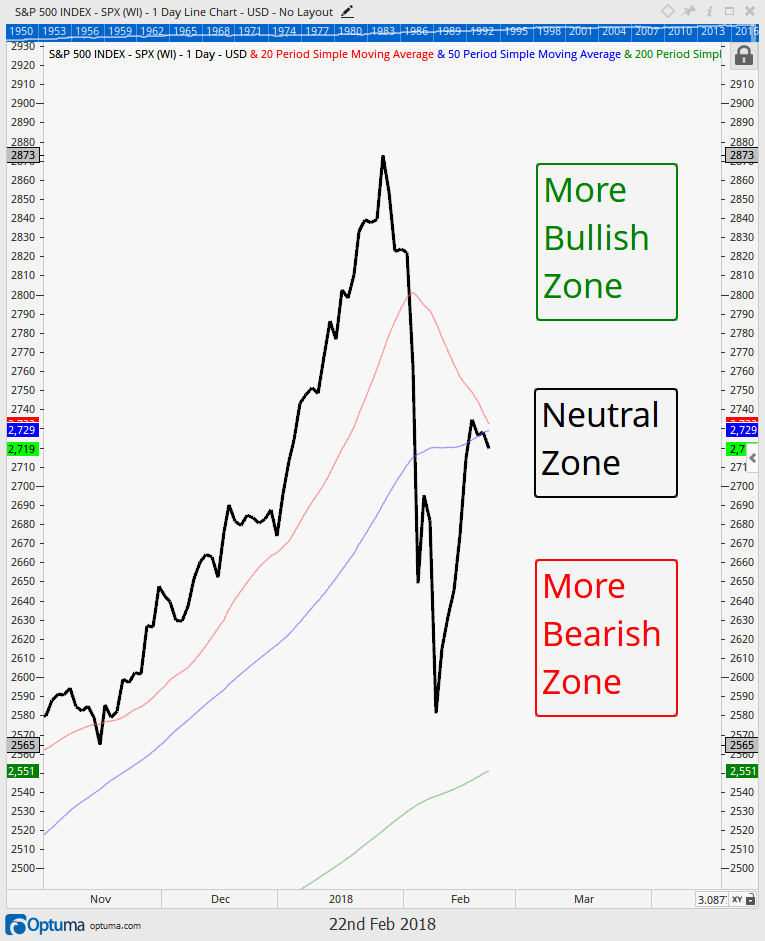
Historically, where price is today is where either counter-trend rallies failed and prices resumed their downtrend, or the market proved the selloff was over by powering higher through key moving averages and price levels.
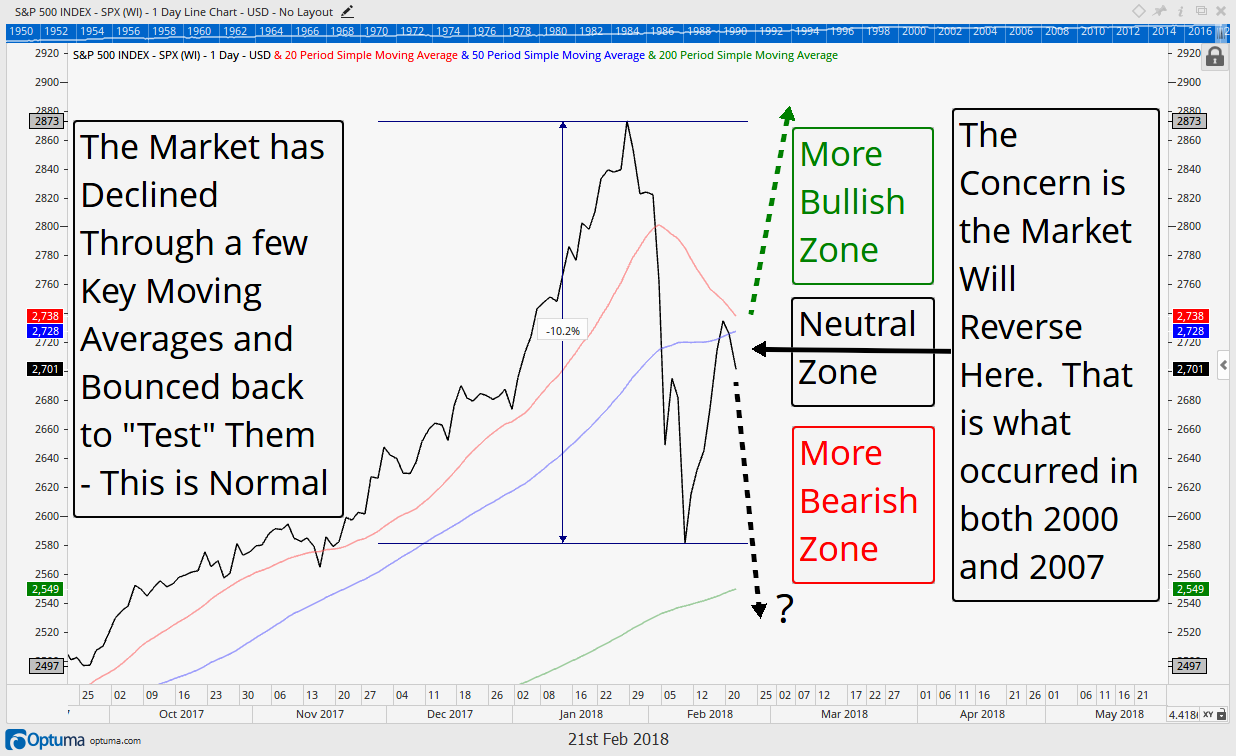
Since that update, the market’s rally has continued to stall for more than a few days at its key moving averages as shown by the chart below and in more detail in our Market Microscope section. We continue to anxiously wait for the culmination of this perfectly normal counter-trend bounce as the time has come to “do or die”.
To us, nothing has been proven by the market, yet, other than the fact the short term trend of the market has indeed turned down. That fact will remain until price can regain its key moving averages, and ultimately make its next new all time high. In the meantime we remain with an elevated cash amount waiting for the market to nudge us one way or the other.
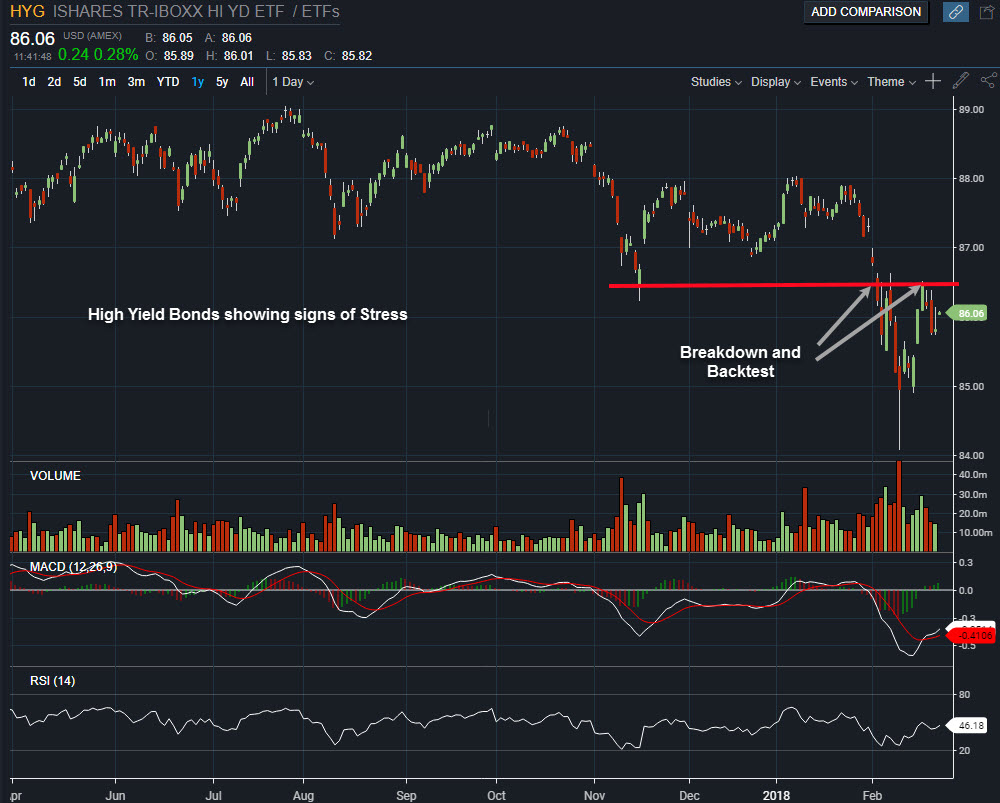
In our Portfolio Insights section we discuss the latest correction and challenge some of the popular terms, such as “healthy correction”. We also have started to reel in our fixed income holding’s credit risk. One thing we do know is that if the equity market is rolling over, so too will be the credit markets rolling over, and we are trying to get ahead of that curve, in case it too is on the horizon. The High Yield Bond market’s chart does not look healthy.
FIT Model Update: Market Correction
![]()
For the past seven months, our signals have almost exclusively been telling us that while the fundamentals and sentiment portions of our model were showing an over-valued and over-bought market, the technical indicators still showed strength. That has now changed with the recent 10% market pullback.
Currently, all three primary inputs are now flashing warning signs as we are, at a minimum, within a short term market correction, waiting for confirmation of the bottom. In a more worse case, at the beginning of a deeper bear market. Technical conditions can change quickly, and we are watching closely.
Market Microscope
The Market has Regained some of its Losses…Now What?
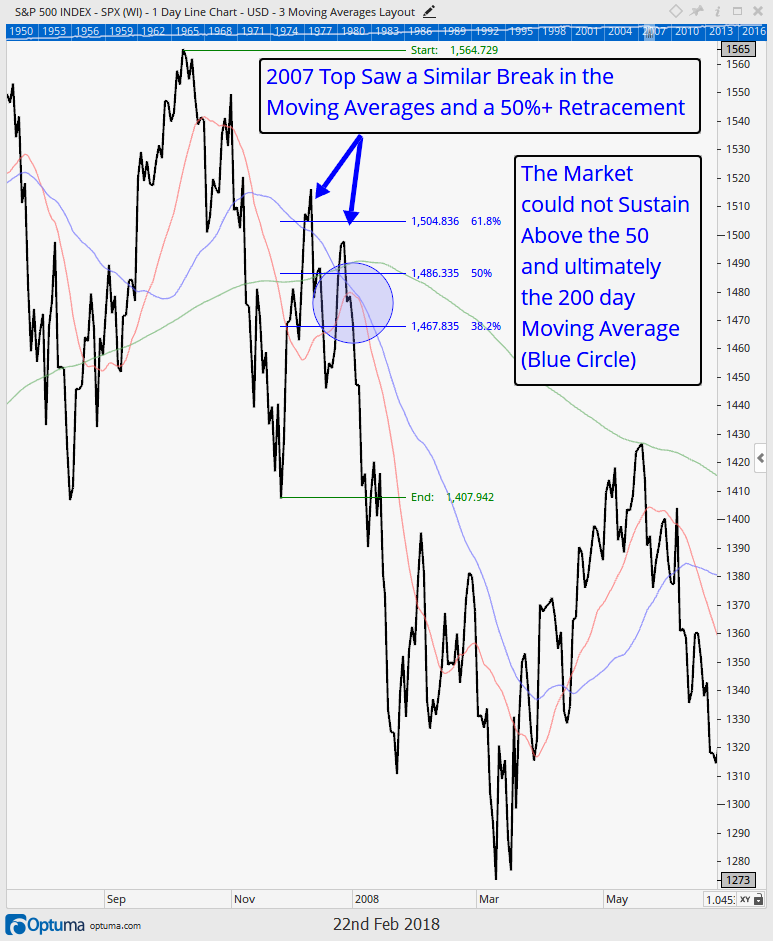
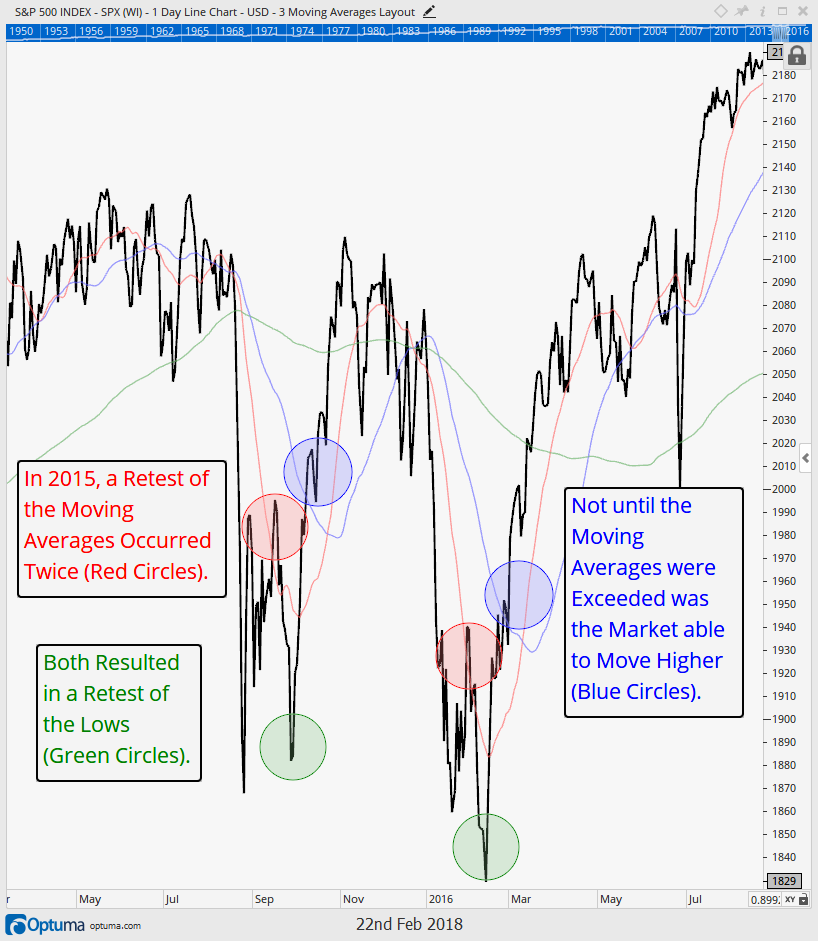
Below are a few recent examples of market pullbacks. On the first chart below is the 2015 minor market top, and on the next chart is the 2007 major market top. Both of these tops started out similarly, and also look, in their early stages, very much like the recent decline in the markets witnessed over the last few weeks. Other similarities of these tops include having rather swift initial sell-offs, “V Shaped” bottoms, and an initial bounce that ultimately tests moving averages and typical retracement levels.
In the case of 2015’s pullback, the initial selloff ultimately lead to a 14% drawdown from all time highs. Shortly after the initial “panic” selloff, stocks bounced, but they met resistance at the 20 day moving average (the initial red circle in the chart below). This led to another test of the low (initial green circle).
Ultimately stocks rose from there, but they still never made a new all time high. This resulted in the formation of a series of “lower highs”, which is one of two official components to a downtrend (the other being a series of “lower lows” accompanying the “lower highs”). Prices soon fell back below all the moving averages and again met resistance on the bounce, ultimately succumbing to the final low in the move. Not until a break and sustained move above the 20 and 50 day moving averages, and then ultimately the 200 day moving average, did the market prove it was resuming its uptrend.
The second chart above shows that 2007 saw a similar setup with an initially steep selloff (a very similar to today (-10%) decline), and subsequent bounce into typical retracement levels (50% to 61.8%). Similarly moving averages were tested, but price could not sustain above them (as shown in the blue circle). Ultimately a series of lower highs were formed that were never broken out of and price fell back through all the moving averages, setting up the initial warnings of the soon to come bear market.
The stock market is in a very similar and precarious situation right now, which is why we labeled two days recently, “the most important since 2016”. Will this selloff be like 2015/2016 and breakout above the moving averages? Or, will it remain below them, poised for a retest of its lows (and potentially more downside) like 2007?
This key binary decision point is why we continue to feel we are at an extremely important market juncture here.
Shown below, the market’s recent drawdown of 10.2% has now bounced 50% and into the same key moving averages that helped guide the way in 2007 and 2015. Thus far price has been rejected at these moving averages. If Price can move above the 50 and 20 day moving averages that would be a bullish signal. However, if it remains below them, it opens the door up for another retest of the early Feb lows, at a minimum.
The next chart shows one more example for us to look at, from the year 2000. That year also saw a swift drop from its highs, followed by a bounce in prices to around 50% and into the moving averages. Notice (in blue) that price failed to overtake the 50 day moving average, which resulted in more selling, a formation of lower highs and lower lows in price, and ultimately a 2.5 year bear market.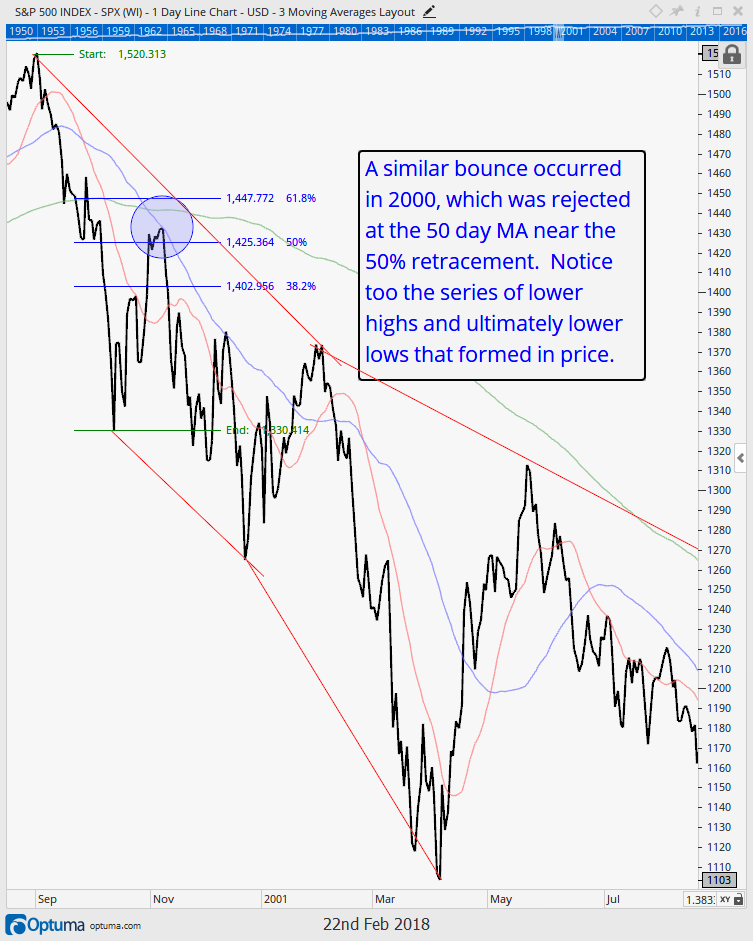
Portfolio Insight
“Healing is a matter of time, but sometimes also a matter of opportunity.” – Hippocrates
It always amazes us to read the market commentary that gets recycled during different parts of the market cycle. One that we’ve read many times over the past few weeks is the ol’ “Corrections are Healthy” mantra.
There is nothing healthy about the destruction of capital.
The intentions are good by those who say this, and we understand the theory…the market has become frothy, and price declines serve to reset expectations, allow an overheated economy to cool, work off overbought conditions, allow inventories to reset, and/or value to better be found. This theory is similar to the Broken Window Fallacy, which we wrote about following the devastating hurricanes last fall (read it HERE).
But this theory neglects the real effects of market declines. One is very tangible: loss of capital. The other is more cerebral: increased uncertainty and the loss of “mental capital”. Markets and economic activity are performed by humans, and we are not rational beings at all times. (Washington DC continually reminds us of this fact.)
Mental capital includes the various behavioral finance issues that all investors experience. Once mental capital is fully expended, investors throw in the towel. This typically happens at the end of a long downtrend, which we refer to as “capitulation”, or panic selling.
Almost everyone has experienced this at some point, and if you haven’t, you probably haven’t been investing very long. It is the retiree who sold in March 2009, and is still waiting to get back in. It’s the tech investor who bought at the peak in the late 90’s and sold at the bottom in 2002. It’s the reason many people say “you can’t time the market”.
But managing risk is not about timing the market. It is about surveying probabilities. It is about investing in favorable times, and choosing to reduce risk when the odds of unfavorable times are increasing. The odds have increased that we are now entering into one of these potentially unfavorable times. Taking steps to manage risk helps protect both real and mental capital.
Portfolio Updates
We have made two primary shifts in portfolios over the past few weeks:
- Reduced Equity Exposure
- Increased Credit Quality in Fixed Income
As discussed in our interim updates and our last ‘Insights’, we have had multiple sell signals in our equity exposure in the past two weeks. We stress that this is likely to be a temporary allocation shift until our models give us new buy signals. But thus far, we have not received new buy signals in any of our equity strategies that we are monitoring daily.
Our buy signals are not designed to find the absolute bottom of a correction, as it is impossible to know at the moment an ultimate market low occurs. Our buy signals are designed to invest with the wind at our back. We want the probabilities of success to be in our favor. We believe this is our most important fiduciary duties to our clients. If we are risking our clients’ capital, we must have a reason to believe the odds are in our favor that we can generate positive returns. There is a popular saying in the trading circles that, “picking bottoms is for losers”, and we tend to agree.
On the surface, if may seem counter-intuitive that higher prices present better investment opportunities. But this is exactly the case in the current market environment. While the pullback was indeed violent, the internal market stats are not currently strong enough to create conditions in which our models say “buy”. So for now, the equity markets are in “no man’s land”, which we discussed in-depth in the Market Microscope section. We currently are waiting for the market to resolve itself either higher or lower. In the meantime, we will exercise prudence and patience with our clients’ hard-earned capital.
In a perfect world we would sell near the beginning of a downtrend and reinvest below the level that we initially sold out. In that case we would continue to outperform the market, and that is certainly one of our goals. There is risk that we ultimately re-buy at slightly higher prices (called whipsaw risk), losing some ground to the market, but that is a risk we are willing to take, especially when measured against the potential downside potential. Additionally we have other strategies in place with goals of offsetting this whipsaw risk. As our clients know, we have remained largely vested in our individual security names as well as some specific sectors, which have done well during this turbulence.
Fixed Income
Fixed income, on the other hand, continues to send a very clear message: rates are moving higher.
When investing in fixed income, there are essentially two types of risks investors can take: Interest Rate Risk, and Credit Risk. There are many other nuanced ways to measure risk, but these are the two big ones.
Interest Rate Risk means that an investment’s value will change due to a change in the absolute level of interest rates (source: Investopedia). More specifically, if interest rates rise the investment will lose value, and if interest rates decline it will gain in value. Longer-dated investments have more interest rate risk than those with shorter maturities.
We have been positioning clients for a rising rate environment for many months by focusing on investments with very short maturities. We have already been minimizing interest rate risk.
However, to generate higher yields, we had been taking on some credit risk. This is the risk we have addressed more recently as we have shifted some of our fixed income funds.
As shown in the chart above, high yield bonds (which we have tried to minimize ownership of) have declined along with the equity markets. The breakdown and retest of the support level over the past two years is a warning sign that credit risk may not be a risk worth taking any longer. In response, we have increased credit quality as another way to manage risk.
One final thought on fixed income. We discussed back in the January 11, 2018 issue as well as in our February 12, 2018 issue, how bonds and stocks actually tend to fall in price together during periods of stress. Notice how in the chart above HYG fell in price from its January highs to its February lows. High yield credit fell along with equities during this time, helping prove that diversification alone will not protect you from market selloffs.
If you are not our client, you should ask your advisor what your portfolio will look like if yields continue to rise and equities continue to fall?
Our clients have unique and meaningful goals.
We help clients achieve those goals through forward-thinking portfolios, principled advice, a deep understanding of financial markets, and an innovative fee structure.
Contact us for a Consultation.
Neither the information provided nor any opinion expressed constitutes a solicitation for the purchase or sale of any security. The investments and investment strategies identified herein may not be suitable for all investors. The appropriateness of a particular investment will depend upon an investor’s individual circumstances and objectives. *The information contained herein has been obtained from sources that are believed to be reliable. However, IronBridge does not independently verify the accuracy of this information and makes no representations as to its accuracy or completeness. Disclaimer This presentation is for informational purposes only. All opinions and estimates constitute our judgment as of the date of this communication and are subject to change without notice. > Neither the information provided nor any opinion expressed constitutes a solicitation for the purchase or sale of any security. The investments and investment strategies identified herein may not be suitable for all investors. The appropriateness of a particular investment will depend upon an investor’s individual circumstances and objectives. *The information contained herein has been obtained from sources that are believed to be reliable. However, IronBridge does not independently verify the accuracy of this information and makes no representations as to its accuracy or completeness.

