Markets have calmed from the high volatility that has characterized 2018 thus far. However, the bond market has been showing consistent signs of stress, and traditional diversification is once again causing broadly diversified portfolios to suffer from underperformance. We call this “diversification fatigue”, and it is once again proving you can have too much of a good thing.
[maxbutton id=”5″ url=”https://ironbridge360.com/wp-content/uploads/2018/06/IronBridge-Insights-2018-June-22-1.pdf” text=”View PDF” ]
FIT Model Update: Market Correction
![]()
The number of covenant lite loans that were issued in 2017 set a record. This is very interesting considering the last peak in covenant lite loans was in 2007, just before the financial crisis.
Covenants are placed on bonds to help give the lender comfort that they will get their money back. If more lenders are offering bonds with fewer covenants then it means they are extremely optimistic. This is a concern because we know that market tops always occur when optimism is rosiest. Is optimism rosy enough to mark another stock market peak? Time will tell, but the good news is we continue to have our strategies that will also warn us so.
Investment Strategy
When Should You Adjust your Exposure?
When Should You Adjust Exposure?
You have a diversified portfolio, maybe you meet with your financial advisor regularly, and are shown your “pie chart” at each meeting. But the returns just don’t seem to be keeping up with what you expect, or there are so many different holdings in your portfolio that you don’t know where to start. How do you know if you are really diversified and when to adjust exposure and make changes?
In its most basic form, successful investing involves doing more of what is working and less of what is not. Traditional diversification goes against this basic tenet, as it promotes holding assets that aren’t working as well with a goal of protecting your portfolio during turmoil. Diversification is at its heart a risk management tool, not a returns boosting tool.
Take recently for example, the US stock market has surged since the 2009 lows, beating almost every other asset class in the process. A portfolio that had assets other than US stocks suffered as a result. If you weren’t diversified and held only U.S. Stocks, you did very well, but if you were diversified you did less well. So, should you just put your assets in US stocks, have no diversification, and forget about it? While that’s what an increasing number of people have done over the past 10 years (known as passive or index investing), this is not the appropriate response. There still of course is risk in such a strategy, and your portfolio also likely has other goals beyond growth, like yield or stability.
What is an appropriate response is to better understand the reasons why certain investments are in your portfolio and if they really are providing diversification. And even more importantly, to have a process that allows your portfolio to adjust exposure to various assets within a pre-defined range to maximize the benefit of diversification.
In our view, diversification does provide benefit in not having too many eggs in one basket as you don’t want to overly expose your hard-earned assets to singular risks (known as idiosyncratic risk). But, unfortunately many investors fall into the trap of diversifying just for the purpose of diversifying. And, in that case they still have what is known as market risk. Having different assets in a portfolio for the sole reason of having different assets in your portfolio is not a strategy that in and of itself provides diversification. If the stock market falls 50% and you hold a bunch of different stocks, diversification won’t help you.
Adjusting exposures (aka active management) can supplement diversification.
When to adjust exposure is a question not easily answered. However, we believe that you can use a series of rules to help your portfolio gain exposure to assets that are behaving better than others. And more importantly, you can identify the conditions that allow more favorable times to make the necessary adjustments and also diversify better into non-correlated assets (such as cash).
- Identify Long-Term Trends. We see two major long-term trends in play right now: Interest Rates are moving higher, and that we are late in the investment cycle. Identifying trends is crucial, and can help direct investment decisions such as holding timeframes and exit strategies.
- Identify Shorter-Term Trends. We use advanced mathematical models to help identify shorter-term trends. Without sophisticated techniques that have been tested and show likelihood of success, investment decisions based on short-term trends is not advised.
- Do Not Chase Performance. Don’t follow the hottest investment idea. Bitcoin is the best example over the past few years of a possible desire to adjust exposure. US Technology companies are not far behind, although we have seen that market change its trend yet.
- Understand When You’re Making Emotional Decisions. Human error is the biggest cause of investment mistakes. Whether being too confident that the market is over-valued, too confident that the market is cheap, or too confident in the potential direction of an asset, making a decision based on gut-feel that is nothing more than a guess is not a good idea. (This also applies to large firm investment committees as well.)
We believe we are currently in an environment that is favorable for active management and actively adjusting exposures. Two of our top adjustments have been staying away from international stocks, and staying away from fixed interest rate bonds.
 International Stocks continue to Underperform
Entering 2018, a common theme being spewed from the large investment firms was the almost certain proclamation that international stocks will finally begin to consistently outperform US stocks. After all, 2017 was an impressive year: Emerging markets were up 37%, and Developed stocks were up almost 26%. Both outperformed US stocks. But, as we have pointed out numerous times in this newsletter, the primary reason for foreign stocks outperformance in 2017 was because of the weakening Dollar. In 2018 the Dollar has gained almost 4%, and that has put a lot of pressure on international stocks.
Here’s a look at year-to-date performance of various asset classes. Notice international and emerging market stocks are underperforming U.S. stocks significantly.
- US Stocks (S&P 500): up 3.2%
- US Stocks (Dow Jones): down 0.34%
- US Stocks (Russell 2000): up 9.5%
- International Stocks (EAFE): down 1.29%
- Emerging Markets Stocks: down 3.03%
- 10-Year Treasury Bonds: down 2.24%
- High Yield Bonds: down 0.52%
- REITs: down 1.92%
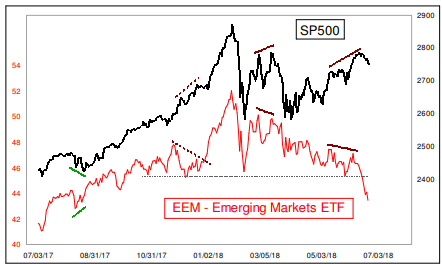
2018 is a great example of diversification fatigue. Most large investment firms recommend portfolios that are very static and rebalance only to a set percentage. They usually don’t tweak exposure much. We, instead, manage to exposure and recognize the little diversification benefit one really receives, for example, from owning both U.S. and International Stocks. The only real diversification comes from the currency. The chart below from McClellan Financial puts things in perspective. EEM (Emerging Markets) has pulled back 15% from its highs while the S&P is only down 4%. What has being diversified in international stocks really provided you? International stocks haven’t participated on the upside and it won’t protect you on the downside.
If you have been over diversified in “hot” investments, such as emerging markets, then, unfortunately, it has been a drag on your portfolio’s performance.
Market Microscope
The Bond Market is Grumpy
The bond market is said to be smarter than the stock market. Why is this?
- The bond market is much bigger than the stock market. The U.S. Bond Market has over $40 Trillion in outstanding debt, while the U.S. Stock Market, even with its excellent performance since the financial crisis, is still smaller, just $30 Trillion in size.
- The retail investor largely is not involved and that may mean those making decisions in the bond market are more sophisticated (or at least they pretend to be). Except through ETFs and mutual funds, retail investors don’t typically invest in bonds. For example, there is no 4 letter ticker to invest in Apple’s $100B in debt, but there is a ticker for Apple’s equity (AAPL).
- Bond holders come before equity owners during liquidation and payment events. This typically makes the bond market a more conservative place to invest as bondholders get paid interest and principal before equity owners get paid dividends.
- Bond price fluctuations and interest rates have a direct effect on company earnings and thus equity prices, but equity price fluctuations do not directly affect company earnings or bond prices. A company’s bond price affects it more directly than its equity price.
- Bond prices are less reactive and volatile due to the above reasons. Prices move slower and are more stable, helping bring volatility down and also allowing for more comfort around the longer term investment horizon.
- Sometimes the bond and stock market confirm one another’s movements, and other times they don’t. It is those other times where investors would do well to pay attention, because if something is awry in the equity market, the bond market has often already sniffed it out. We’ll look at some examples of this below.
If we can agree that the bod market may be smarter than the stock market, then it makes sense that we should be looking at the bond market as often, if not more often, than the equity market. We could also conclude that movements in the bond market may actually be more important than movements in stocks. So what is the bond market showing us?
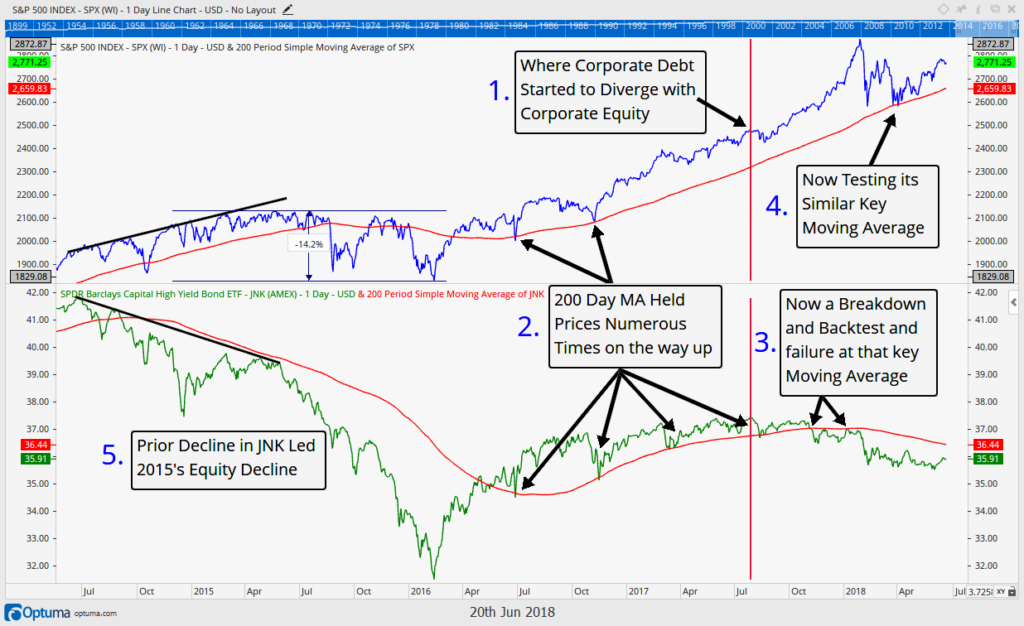
First up, a chart we have highlighted before, showing the high yield bond market’s proxy, JNK (at the bottom), versus the S&P 500 (at the top). The lower prices in the bond market in 2014 was a warning to the equity markets well before the 2015 equity selloff. Bonds were selling off while equities kept rallying, and that was a warning to the equity market.
Today is a similar story. Unlike equities, JNK remains weak, sitting below its 200 day price average and showing no improvement since the equity low in early April. High yield bonds suggest we must question the current equity rally.
One argument for the bullish equities case could be that high yield debt is just a small segment of corporate bonds. What about investment grade and other corporate debt?
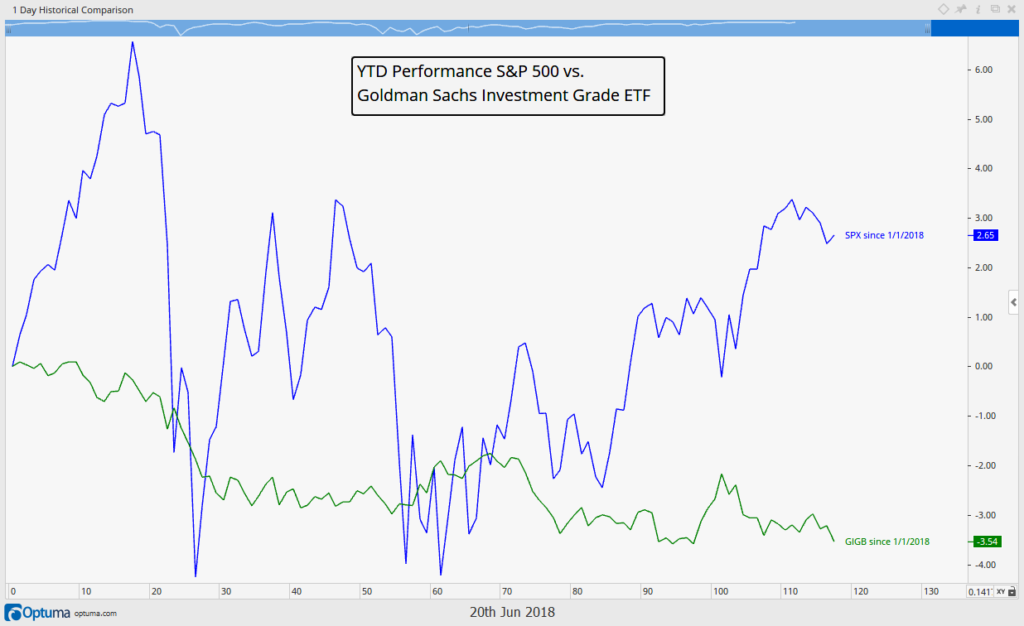
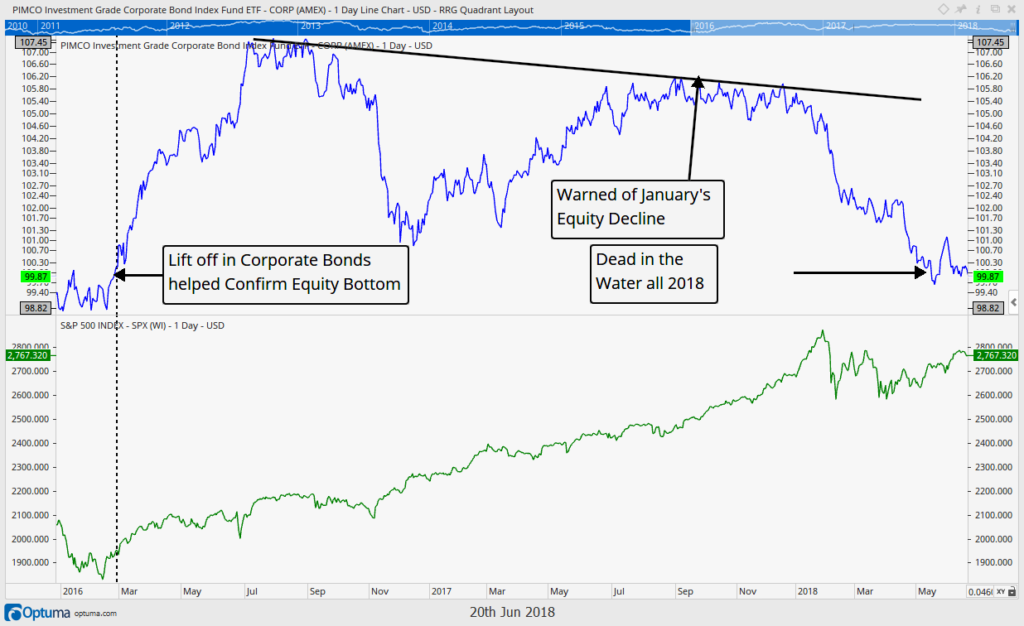
The next chart shows the performance of investment grade bonds through Goldman Sach’s Investment Grade Corporate Bond ETF (GIGB, in green) versus the S&P 500 (SPX, in blue). This chart shows a similar story, investment grade bonds are down 3.5% year to date versus the S&P up 2.6%. Year to date, corporate bonds are hurting, and as history reveals, this underperformance often eventually bleeds into equities. On the following page, a zoomed out version going back to 2016, reveals a similar equity market “tell” by investment grade bonds. A peak in corporate bond prices in July 2016 was followed by a lower price peak one year later. This occurred while the equity markets kept making new highs. The bond market was not confirming equity strength, and it all came to fruition in February 2018 when equities joined bonds and sold off 12% peak to trough.
The corporate bond market was not making new highs,even though equities were, and that was a problem. If the bond market can warn us of market tops, then why can’t it also warn us of market bottoms? The longer term chart on the following page also gives an example of this.
Do you remember the market decline of 2015? That (almost 20%) pullback put a lot of investors on edge. For one it was the largest pullback in years, but it also occurred during a lot of global and fiscal uncertainty (sound familiar?). However, one way to gain confidence that an equity bottom had formed was to look at the corporate debt market. Just as the corporate debt market was a good warning siren when bonds did not confirm stocks on the way up, it was also a good siren for confirming the bottom as corporate debt confirmed the move in equities.
After the 2015 decline stocks started to move higher in early 2016. Simultaneously investment grade bonds (and high yield bonds – see first chart) also started to move higher in price. This helped solidify the bullish case and shows how powerful moves can occur when the corporate debt market is confirming the corporate equity market. Contrastingly, when there is not a confirmation it often warns us that something is awry and our guard should be up.
Right now our guard indeed remains up because corporate debt is not confirming the recent moves higher in equities. This is likely why the equity market has struggled to move higher the last five months.
Until corporate bonds start to also move higher in price, we probably shouldn’t expect too much from equities.
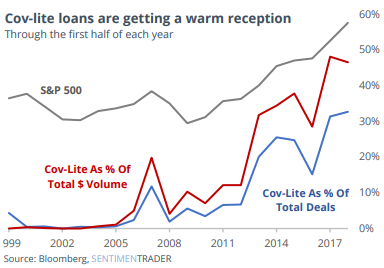
An interesting add on to all of this is the bond market’s down year is occurring as companies issue the most covenant -lite (cov-lite) loans in their history. Covenants are the “protections” bond issuers put into place to make sure companies don’t veer too far from their promises and cash flow projections.
When bonds are “covenant-lite” it means issuers aren’t demanding as much risk protection and thus are more bullish in their outlooks. The chart below shows the cyclicality of this and also reveals the last time covenant-lite loans were all the rage was in 2007, just before the financial crisis.
Is it possible for us to conclude, given the massive amount of cov-lite issuance lately, investors have even rosier outlooks now than they did just before the financial crisis?
Cov-lite loans seem to be abundant later in the cycle (1999, 2007, and now). There is certainly an apparent cyclicality with them and it is not a coincidence that Cov-lite issuances rise during bull markets and decline during bear markets.
It will be interesting to see, with bond prices in 2018 down over 3% how that affects the amount of covenant-lite issuances. The falling bond price alone reveals an elevated risk in the market, so it is likely this latest covenant-lite bond boom is also slowing.
Finally, just like in 2008, the massive amount of cov-lite loans will probably only exacerbate any problems that may arise in the event of an economic slowdown.
Bottom line…the bond market is not a market that should be ignored. Our interpretation of the current state of the bond market suggests that equity market risks will likely remain high during the coming months.
Invest wisely.
Our clients have unique and meaningful goals.
We help clients achieve those goals through forward-thinking portfolios, principled advice, a deep understanding of financial markets, and an innovative fee structure.
Contact us for a Consultation.
Neither the information provided nor any opinion expressed constitutes a solicitation for the purchase or sale of any security. The investments and investment strategies identified herein may not be suitable for all investors. The appropriateness of a particular investment will depend upon an investor’s individual circumstances and objectives. *The information contained herein has been obtained from sources that are believed to be reliable. However, IronBridge does not independently verify the accuracy of this information and makes no representations as to its accuracy or completeness. Disclaimer This presentation is for informational purposes only. All opinions and estimates constitute our judgment as of the date of this communication and are subject to change without notice. > Neither the information provided nor any opinion expressed constitutes a solicitation for the purchase or sale of any security. The investments and investment strategies identified herein may not be suitable for all investors. The appropriateness of a particular investment will depend upon an investor’s individual circumstances and objectives. *The information contained herein has been obtained from sources that are believed to be reliable. However, IronBridge does not independently verify the accuracy of this information and makes no representations as to its accuracy or completeness.


