What will be the real effects of the new tax legislation?
In this issue we discuss what companies may do with the extra funds from the tax cut, look at the announcements made thus far, and take another look at the hot stock market.
[maxbutton id=”5″ url=”https://ironbridge360.com/wp-content/uploads/2018/01/IronBridge-Insights-2018-01-26.pdf” text=”View PDF” ]
In This Issue:
PORTFOLIO Insights: What will Companies do with the Projected Tax Savings, and How will it Impact your Portfolio?
There are five likely ways corporations will use any savings from the tax reform. We discuss the most likely one in more depth.
MARKET MICROSCOPE: What is the Impact from the Tax Cut?
One persistent theme with the Trump tax cuts has been around the savings that will occur at the corporate level. No doubt there will be some savings, but how much really? One stat we have seen shows that of 25 companies that have reported their expected tax savings, those savings were 8.7%.
MARKET MICROSCOPE: US Stocks: To the Moon!
The stock market has been incredibly strong. The S&P 500’s hot start to the year, by one measurement, suggest a cool down over the next few months.
On Our Radar
Trump Taxes: The tax bill has passed as companies continue to dissect how changes may affect them. We take a deeper look at tax savings expectations in our Market Microscope.
Earnings: 4Q Earnings season has begun, and companies have a high bar to continue the growth seen in 2017.
Federal Reserve: The Fed is expected to raise rates 3 more times in 2018 as the bond market has already started to price this in.
Davos Economic Forum: The economic minds of the world met this week in Switzerland. One of their efforts is to coordinate global growth. President Trump’s more protective agendas have been a hot topic of discussion.
Government Shutdown: The government shutdown was a non-event and it likely will continue to be uneventful unless there is a more prolonged shutdown.
Economy: 4Q GDP rose by 2.6%, well below estimates above 3%. However, this is a preliminary number and will be revised in the near future.
January Barometer: Have you ever heard the saying, “so goes January, so goes the year”? This adage is a result of the statistical tendency for the full year market performance to follow the month of January’s. If January is positive, then typically the rest of the year was…at least until 1985. Since then the market’s full year performance has had little statistical correlation to how January performed.
FIT Model Update: Uptrend

Fundamental Overview: Many year end S&P price targets are already being hit as we expect the banks to readjust these targets higher. When prices rise quicker than earnings, P/E ratios also rise. This is what we are seeing today with a trailing 12 month price to earnings ratio (P/E) now above 25x, resulting in an earnings yield of 4% (E/P). With 5 Year Treasuries now pushing 2.5% it’s only a matter of time before a corporate bond yields more than its equity counterpart, flipping the reward to risk paradigm.
Investor Sentiment Overview: The latest sentiment measurement to join the club of extremity is the amount of leverage being used to buy equities. Rydex funds was one of the first mutual fund families to offer leveraged funds. The current ratio of leveraged long dollars to leveraged short dollars has gone parabolic, now almost 4x as much, and the largest spread in its history.
Technical Overview: The S&P 500 is up over 6% thus far in January, well above the average price paid of $2,658 in December. This is the farthest distance from the prior month’s average since March 2016. Back then returns one month later were positive, but 3 months later they were flat. Discussed in more detail in the Market Microscope, since 2009, 7 of the last 9 times the market was this stretched resulted in zero to negative gains at some point within the following 3 months.
Portfolio Insight
Tax Changes are Affecting Corporate Profits
“A conflict of interest may be defined as a set of conditions in which professional judgement of a primary interest, such as making decisions on the merits of legislation tends to be unduly influenced by a secondary interest, such as a personal financial gain” -Dennis Thomson, Brookings Institute
Corporate earnings are an important factor in the health of the economy and markets. How will the new tax law affect earnings and how should you factor this in to your investment portfolio?
At their core, markets are forward-looking. Professional investors aren’t as concerned with what has already happened as they are about what may happen in the future.
By definition, earnings are backward looking. The announcements we receive from companies give us their actual financial results for the previous quarter. Granted, most companies provide guidance as to what their best estimate of the next few quarters may hold, but many times this guidance is more of a cat-and-mouse game with analysts than true projections for coming quarters. This makes most earnings seasons relatively boring with little surprises.
This earnings season is different. There has not been corporate tax reform in a very long time.
We are not going to discuss the merits of this tax legislation from a societal, budgetary or political standpoint, but we are anxious to hear how it will impact the bottom line of various companies, industries and sectors.
We discuss this more in the Market Microscope section below, but so far, our initial analysis shows an increase in earnings of 8.7% for those 25 companies that have actually provided estimates of the direct impact from the tax cut. However, guess how much the S&P 500 has risen since the tax cut was passed? It has risen 8%!
The real question is….what will companies DO with this potential extra 8.7%?
In our view, companies are likely to do some combination of the following actions:
- Stock Buybacks: This is when a company uses corporate funds to repurchase their own company shares. This can have a positive impact on stock prices by adding new “buyers” into the market (increased demand), as well as reducing the number of shares available to trade (reduced supply).
- Special Dividends: These are one-time payments made to shareholders, typically initiated on the “suggestion” of the largest shareholders, and would likely be done by those companies that already have a relatively high dividend yield.
- Mergers/Acquisitions: Companies may acquire smaller competitors to increase market share, or acquire strategic partners to allow entrance into a new market.
- Capital Expenditures/Efficiency Improvements: Investment in labor-saving automation to reduce costs.
- Employee Bonuses: Using extra funds to the benefit of employees.
While there have been companies announcing employee bonuses, they are likely doing so to generate positive publicity, and to help improve workplace morale. What employees get paid is driven by the marketplace for that particular position and what that employee’s responsibilities and skills can provide to an employer. Wages are not driven by the amount of free cash flow within a corporation, so we believe that wage growth due to tax policy is likely to be temporary.
Instead, the most likely use of that cash will be continued stock buybacks and increased dividends. In fact, companies have already been announcing increased buyback programs. So let’s take a look at how buybacks have affected markets in the past.
One of the most interesting aspects of stock buyback programs is that they tend to correlate very well with the stock market cycle.
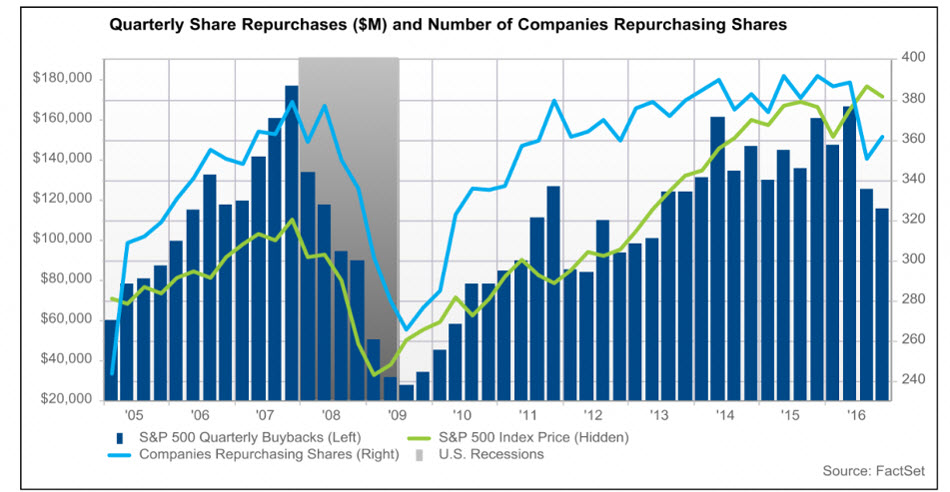
The chart below shows the dollar amount of buybacks by S&P 500 companies in dark blue, the number of companies repurchasing shares in a lighter blue, and the S&P 500 in green.
Upon inspection, some interesting things appear.
First, both the number of companies repurchasing shares and the dollar amount of those repurchases tended to lag the performance of the S&P. In other words, share repurchases appear to follow the market, not be a leading indicator of future prices. This happens both when markets rise and when they fall.
Second, companies tend to buyback the most shares near market peaks while buying the least amount of shares near market bottoms. In other words, a higher market LEADS to increased buybacks, and a lower market LEADS to decreased buybacks. In some ways this makes sense, as economic downturns lead to reduced cash on corporate balance sheets. Corporations simply don’t have the cash to do buybacks. But, how do you explain the extreme amount of buybacks at the opposite end of the spectrum?
Why do companies buy back their most shares at their highest prices and valuations?
Notice the most share buybacks ever was in the 3Q of 2007, the exact same time as the top of the markets, and just before the average share price fell 50%+. This was the exact wrong time to buyback shares, yet CEOs and boards, etc did it anyways, to an extreme! They certainly weren’t putting shareholder dollars to good use then. It would have been better for them to pay attention to valuations and wait for a better buying opportunity, like in 2008 or 2009, when almost no company was doing buybacks.
There have also been periods where increased buybacks did not lead to higher stock prices. In the chart above, increased buybacks in 2011 did not result in a higher market. In fact, the market was flat for most of 2011 and 2012. Again in 2014 and 2015, increased share repurchases occurred when the market was flat to down. Conversely, the decrease in buybacks in both dollar value and number of companies in 2016 did not lead to lower markets. In fact, both 2016 and 2017 were excellent years for stocks. It appears to us that increased buybacks are something that happens in conjunction with prevailing market trends, not a leading indicator, but more of a confirming or lagging one.
So how should you factor in the tax changes into your portfolio?
Given how strong the market has been in the past few months, it may have already been priced into your portfolio. But as we get more clarity into which sectors and companies will benefit most from the tax changes the market will reward and punish as it sees fit. Instead of trying to predict what will happen with the tax law changes and how they affect the market’s prices, we have designed strategies to listen to these changes and adapt as necessary.
Near term, the trend of the market is higher, and will be until proven otherwise by a breakdown in its price, but as we discuss in our next section, the market is also very stretched and may be due to take a bit of a breather. That does not mean you should move to cash. It means you should have a strict risk management policy for your holdings and be prepared to take profits if and when the trends change.
Market Microscope
Higher Prices Due to Tax Cuts?
The recent changes to the tax code, specifically the corporate side, have received a lot of attention lately. The hype surrounding the changes, in some ways seems to be just that as we are not seeing that significant of a jump in 2018’s earnings expectations, at least not yet. It could be a case where companies are still trying to figure out the impacts, or it could be a case of companies with the good news simply barking the loudest.
Earnings & Taxes
Was December 2017’s 1.5% and January 2018’s 6%+ stock market returns driven by the passing of the tax code revisions? Perhaps. What about 2017’s full year S&P 19% return? Was such a great return a result of expected future tax savings for investors? That’s certainly a possibility, but unfortunately it is impossible to tell exactly why the market has rallied as it has, just as it is impossible to ever prove exactly why the market does what it does. However, what we can look into with a little more conviction is the amount of tax savings the market is expecting as a result of these revisions. If the tax savings are real then it is likely they are providing some benefit to the markets.
We received the following graphic from a research analyst that was proposing significant improvements in future company earnings, and rightly so. Thus far 25 of the 500 S&P companies have proclaimed they would see an 8.7% benefit to their bottom lines because of the tax law changes. If that holds across the board, an 8.7% jump in earnings would be great news for the market. But, that would require the 475 other companies to also raise their estimates.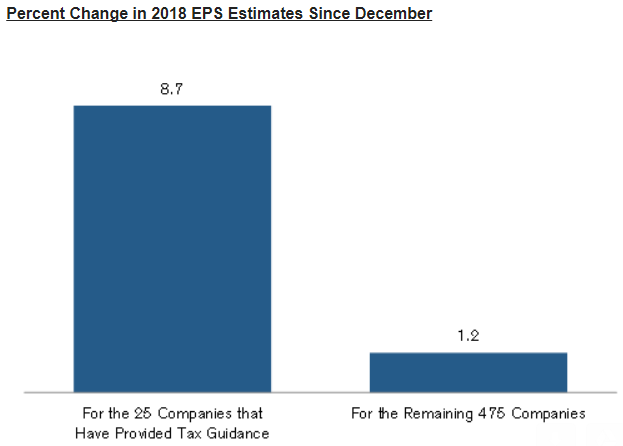
The graphic hints at the reality of the situation. At least thus far, only a few of the 500 largest companies will see great benefit from the tax law changes, but 475 others either will not, don’t know yet, or aren’t communicating their expectations yet.
If we do the math, the graphic to the right equates to a weighted expected bump in Earnings per Share, or “EPS” of 1.6%, which is nice, but we would hardly consider it justified for the hype that has surrounded it.
The concern is the much anticipated tax revision in reality will benefit just a small percentage of the S&P while the rest see little real benefit (as depicted by the chart) and the 1.6% weighted average calculation.
It could also be a case of companies with good news barking the loudest (or soonest) while those companies with little (or negative) news remain mum. That may be a best case scenario as we wait to see if there are any more positive announcements, but thus far it seems the bang from the tax buck may not be as great as expected.
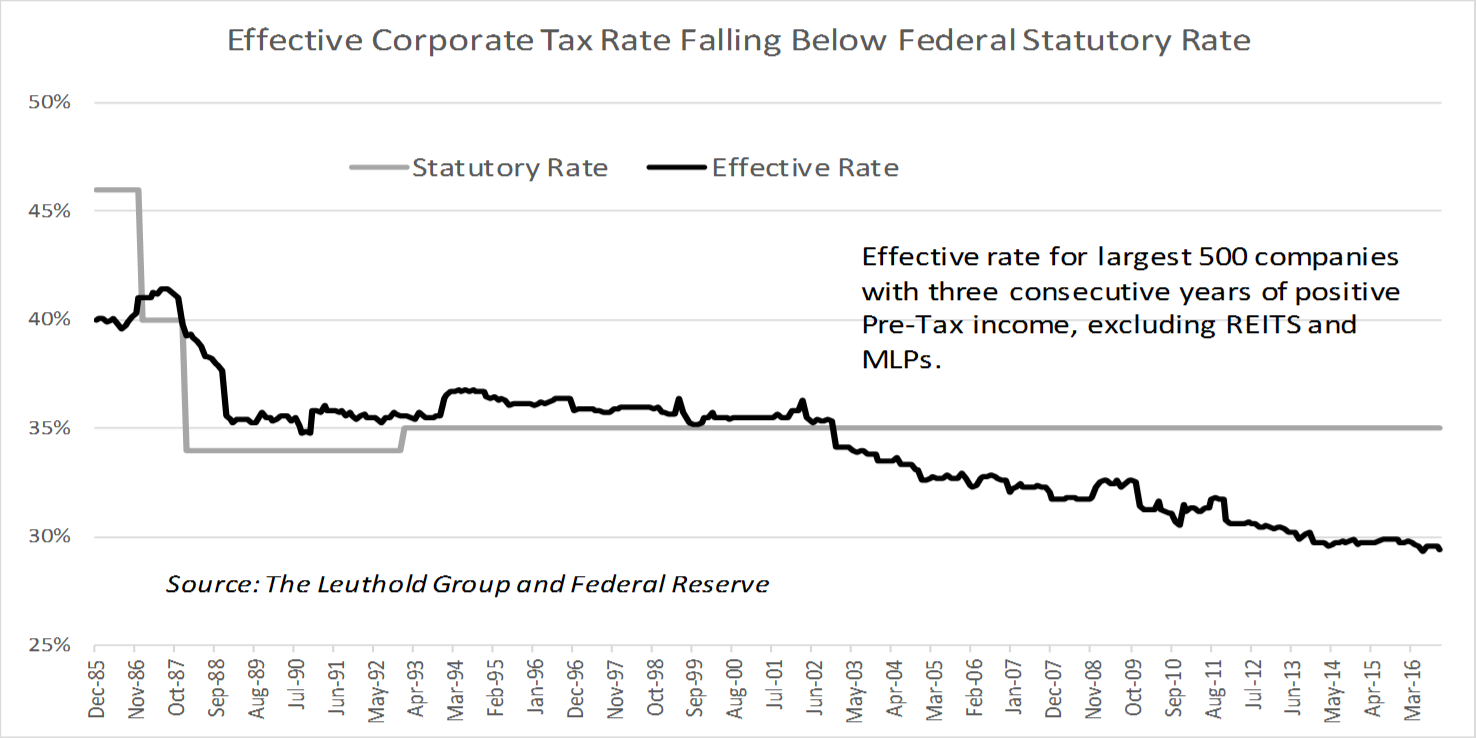
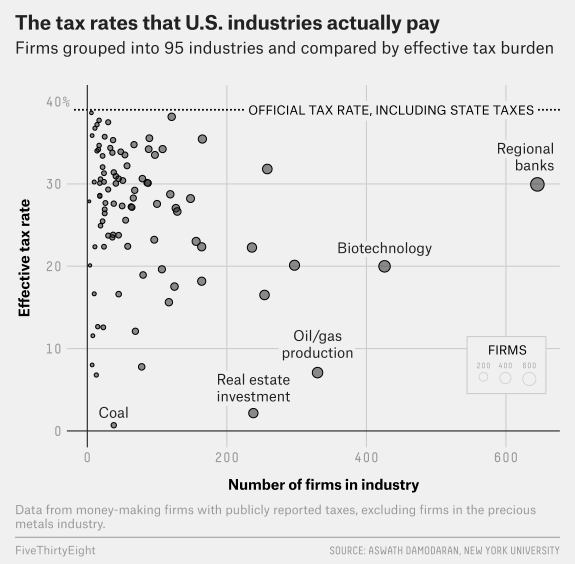
The next two graphics below show in detail what most already know; that the U.S. statutory tax rate is the high point on the scale, and most companies don’t pay near that rate. The U.S. Corporate tax rate did not used to be 35%, as implied. It actually was an average 29%.
The graphic below tracks the effective tax rate of the 500 largest companies through time. The effective rate in 2016 was already down to 29% (and trending lower), so at a maximum the tax savings would be at most 8% on average (29% less the new 21% rate).
The next graphic provides a little more detail around industry. Biotechs already had an effective tax rate of 20%, so it is likely they see little benefit as a group from the changes. REITS and energy related companies may end up paying more. Standard and Poor’s does a great job consolidating all the company earnings estimates from all of the projections made by analysts which are available every day on their website.
Standard & Poor’s data is updated as estimates change and actual earnings replace estimates. Today’s 2018 earnings estimates are highlighted in the final chart to show the full year estimate as of January 24 of GAAP earnings of $139.67.
The table to the right starts with what were October’s 2018 full year estimates, and then December’s, and finally today’s.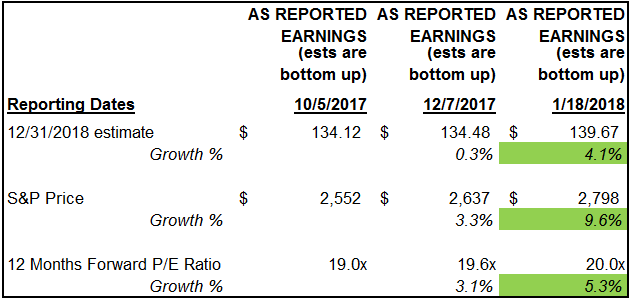
Today’s earnings estimate for 2018 is indeed higher than the $134.48 estimate on 12/7/2017, prior to the tax bill’s finalization. This equates to a 3.7% increase since the passing of the bill, and a 4.1% change since October, as it does look like earnings are getting some boost from the tax changes. How much of this is the actual result of taxes, it’s impossible to know for sure, but the jump in EPS does look at least partially driven by taxes. But just as important as earnings, price has been rising even faster than EPS, as highlighed in green.
The S&P is up 9.6% since early October. This suggests that even with the 4.1% boost in earnings, price remains well ahead of it, rallying faster than earnings, and continuing to push valuation ratios ever higher into the stratosphere.
EPS has grown 4.1% but prices have grown 9.6%, pushing forward P/E ratios up another 5.3% higher. The market is either baking in further earnings growth, or it is just continuing its “irrational” ways by largely ignoring fundamentals.
Stock Market
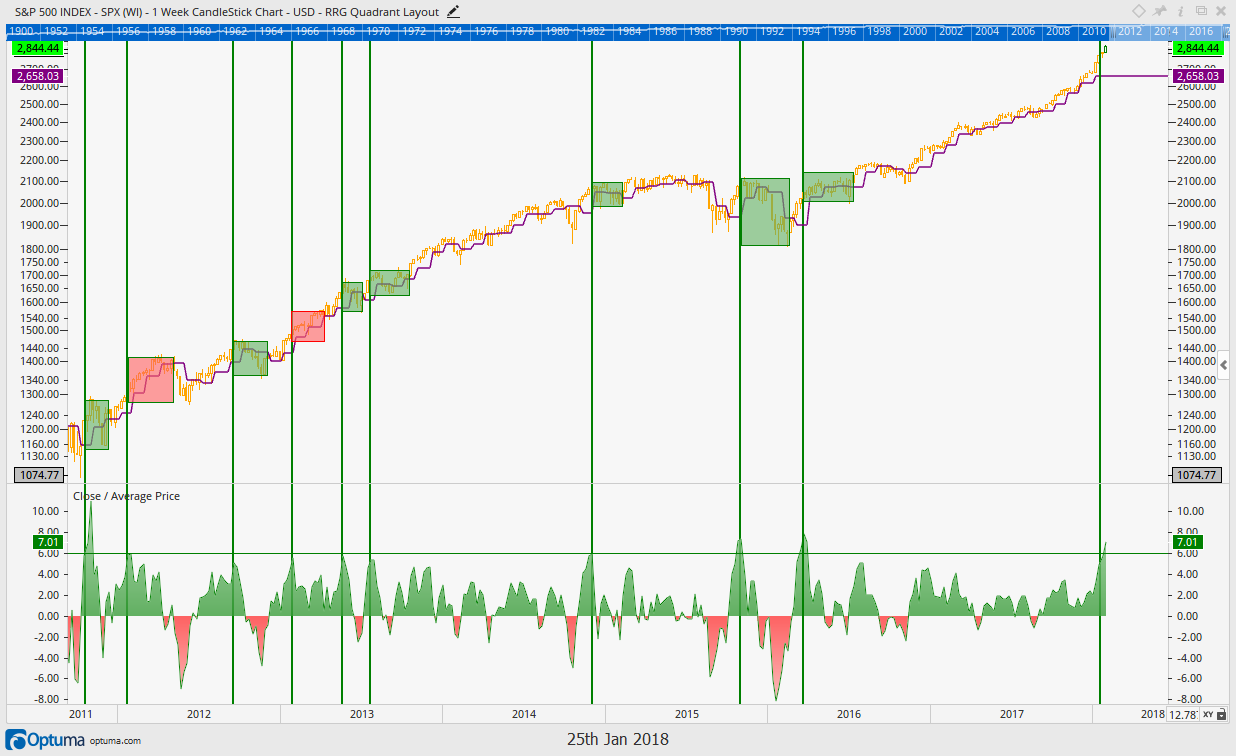
The chart below shows the S&P 500 (in orange) along with the prior month’s average price (in purple) since 2011. The bottom indicator reveals the percentage distance price is away from its prior month average. The indicator is a kind of momentum indicator that helps reveal overbought and oversold conditions.
Price as of 1/25/2018 is now 7.01% above December’s average price, and this is interesting because price being this far from the average has only occurred a few times since 2011.
Shown on the chart are vertical lines which reveal the prior times price rose 6% or more above the prior month’s average price. This has occurred 9 times during this timespan. What is interesting is what the market did following these readings.
7 out of 9 times the market made no positive ground or was lower at some point in the following three months. These occurrences are shown in green. The other two false signals resulted in 1) the market rallying for more than 3 months more, but then eventually pulling back to the price levels of the initial signal 6 months later. The other signal, in early 2013, was simply one that did not work.
Another takeaway from the chart is with prices now over 7% above their prior month’s average, today joins just 3 other occurrences in that same 7 year span (2011’s, 2015’s, and 2016’s). All three of these instances resulted in the market being flat to down from those levels at some point within the following 3 months.
So, what does it mean? It means the market is stretched here. It has probably run too far too fast and could succumb to the powers of mean reversion. It also does not necessarily mean a market decline is around the corner. Note this indicator reading >7% occurred prior to the largest pullback during the timespan, the late 2015 top that culminated with the 2016 low, but the market being more than 7% away from the prior month’s average price also occurred in 2011, resulting in just a small pullback of a few percent.
We remain bullish but are watching signals like this to help us apply rigor around when we allocate new capital to the markets. Blindly buying when the market is already 7% beyond its prior month’s average price has not been a historically great decision, so we don’t mind having some patience here and letting the market provide us a better reward to risk profile.
Our clients have unique and meaningful goals.
We help clients achieve those goals through forward-thinking portfolios, principled advice, a deep understanding of financial markets, and an innovative fee structure.
Contact us for a Consultation.
Neither the information provided nor any opinion expressed constitutes a solicitation for the purchase or sale of any security. The investments and investment strategies identified herein may not be suitable for all investors. The appropriateness of a particular investment will depend upon an investor’s individual circumstances and objectives. \n *The information contained herein has been obtained from sources that are believed to be reliable. However, Ironbridge does not independently verify the accuracy of this information and makes no representations as to its accuracy or completeness. “,”m”:[{“s”:0,”n”:”c”,”v”:”#333333ff”,”e”:798},{“s”:0,”n”:”fc”,”v”:”Regular”,”e”:798},{“s”:0,”n”:”f”,”v”:”Arimo”,”e”:798},{“s”:0,”n”:”s”,”v”:9,”e”:798}]}”>Disclaimer This presentation is for informational purposes only. All opinions and estimates constitute our judgment as of the date of this communication and are subject to change without notice. > Neither the information provided nor any opinion expressed constitutes a solicitation for the purchase or sale of any security. The investments and investment strategies identified herein may not be suitable for all investors. The appropriateness of a particular investment will depend upon an investor’s individual circumstances and objectives. *The information contained herein has been obtained from sources that are believed to be reliable. However, IronBridge does not independently verify the accuracy of this information and makes no representations as to its accuracy or completeness.
