In our previous report, we discussed how earnings for the next two quarters are likely to be some of the worst numbers in history. Does that mean markets will fall in response? Not necessarily. For it’s not the actual economic numbers that matter…it’s how the actual numbers differ from their expectations that truly drive prices.
Plus, we identify three potential scenarios that could unfold over the coming months.
“Suffering has been stronger than all other teaching, and has taught me to understand what your heart used to be. I have been bent and broken, but – I hope – into a better shape.”
-Eleanor Roosevelt
The impact of the COVID-19 virus continues to effect us all. Our thoughts and prayers go out to those who are suffering from health conditions, financial hardships or simply from loneliness. May blessing be with you all.
In our last issue of Insights, “Dare we Look at Earnings?”, we tried to take an early look at the potential impact that the unprecedented shut-down is having on company earnings. Bottom line, as one would guess, earnings are likely to be horrific.
Should we then assume that markets will also be horrific when these earnings are announced?
Not necessarily.
Markets do not move on economic results alone. Data points, whether corporate earnings, unemployment claims, or COVID-19 statistics, do not necessarily move markets by themselves. Rather, it is much more important to understand how the ACTUAL data differs from the EXPECTED data. This is what moves markets.
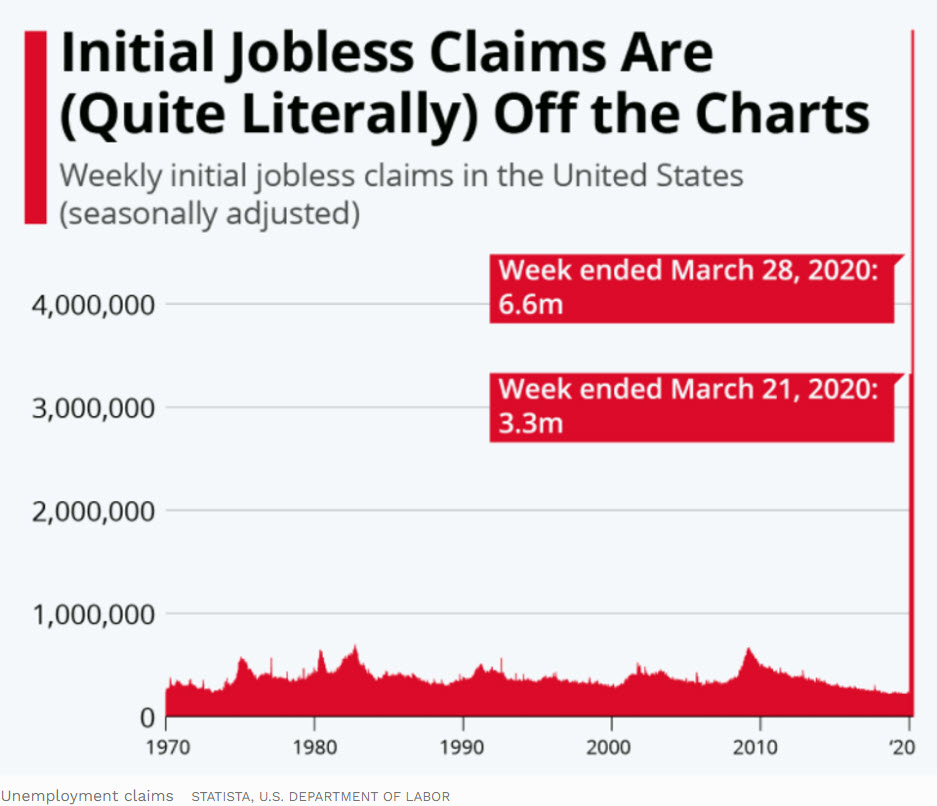
Case in point…last Thursday saw a staggering 6.6 million people file for initial unemployment claims. And the week before over 3 million people filed. This morning, another 6.6 million people filed again. Combined there were nearly 17 million people who filed for unemployment in the past 3 weeks.
These numbers, as shown on the chart below, are literally off the charts.
It is almost as if this chart was made by an entry-level statistician that made some sort of awful mistake.
This chart goes back to 1970. Look at the recessions in the early 1980’s, and especially in 2008. The highest number of weekly claims during the financial crisis was just over 600,000 people. Today’s data doesn’t even seem real in comparison.
What do you think the market would do in the face of such negative data? One would assume that the market fell at least 10%.
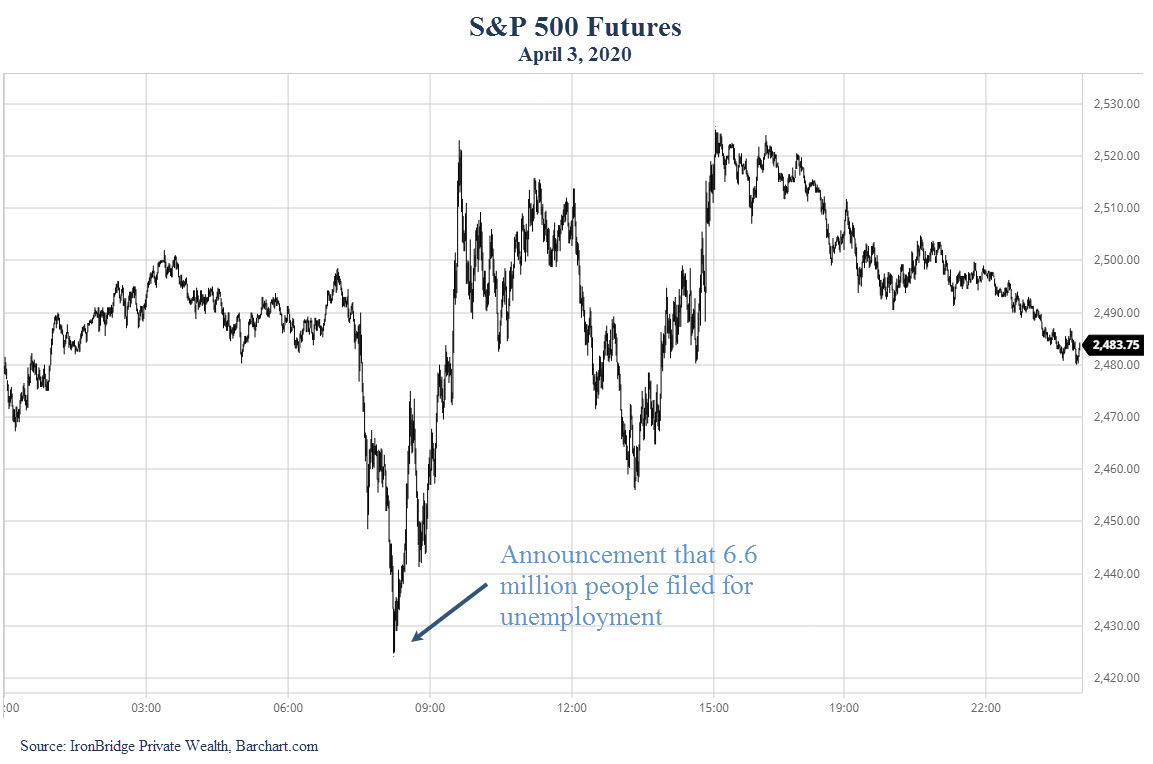
Last week when the first 6.6 million figure was announced, the market went up over 2%. Today, another 6.6 million unemployment figure was announced and the market rallied 1.5%.
This also doesn’t seem real to many people. How possibly could markets rise in the face of such terrible news? Are these market participants just evil psychopaths? How could prices seem so disconnected from reality?
Look at the chart below. This is the chart of S&P futures on April 3, 2020, when the unemployment claims number came out. The moment the data was announced, markets began to rally.
The market rallied because it was expected. The actual numbers were unknown, but people knew it was going to be absolutely terrible. And they were.
The other factor is that as data is announced, one tiny bit of uncertainty is removed. Two weeks ago the market had absolutely no idea how our shelter-in-place would effect the economy. We are now starting to see the effects. While they are bad, it now at least becomes KNOWN. One of the biggest components of fear is the fear of the unknown. And when that fear is removed, markets can become constructive once again.
The next logical question is: What is the market expecting?
Markets are incredibly complex systems. Billions of shares change hands every day through hundreds of millions of transactions. We’ve said many times that to claim to know what will happen with any certainty is foolish.
But we can take our best guess at what the market is expecting based on data and estimates that are widely known or talked about. Let’s go through the list:
Near-Term Expectations:
- Well publicized reports by JPMorgan and Goldman Sachs project GDP for the 2nd quarter to decline somewhere around 30%. To put this in context, GDP fell 4.3% during the 2007-2009 financial crisis. Not 43%, but 4-point-3-percent. GDP fell 25% in the great depression. The magnitude of this is hard to fathom.
- COVID-19 cases are expected to skyrocket. Deaths in the US are estimated to be between 200,000 and 500,000 by the time this is done, which puts the number of people infected between 15-30 million.
- Earnings are expected to be horrible. Some people are projecting earnings to be negative for the entire S&P 500.
- Volatility is expected to continue to be extreme.
- Unemployment is expected to be somewhere between 10-15%. It peaked at 10% during the financial crisis.
Aye yi yi…where’s that margarita?
With all this bad news and uncertainty, what will happen next?
We don’t know what will happen, but let’s look at three possible scenarios that make the most sense to us so we can prepare for different outcomes.
Three Possible Market Scenarios: Bullish, Neutral and Bearish
Scenario #1: The Worst is Over (Bullish)
By the worst is over, we mean that we’ve seen the lows in the stock market for this awful period of time. We fully expect the number of infections and deaths to rise dramatically. And we expect the economic numbers will also deteriorate over the coming weeks.
This does not mean that stocks can’t go up.
Ultimately, this scenario relies on two things: science and liquidity.
The first catalyst for an optimistic resolution is via medical science.
There are countless companies and individuals searching for a cure or some way to help reduce the lethal effects of COVID-19. The last time there was this much focus on one goal was in the manufacturing sector during WWII. This solution is worth billions of dollars to whomever produces it (at least). The person or team who finds it will be rewarded handsomely, and will most certainly be declared a global hero.
The last time a global pandemic struck the globe was the Spanish Flu of 1918. There may be some similarities, but the primary difference is that medical treatments have advanced dramatically over the past 100+ years. Life expectancy in 1900 was roughly 48 years old for men and 50 years old for women, according to the book “A Profile of Death and Dying in America”. Today, life expectancy is pushing 80 years old.
How people are dying is also changing dramatically. The next chart looks at the leading causes of death in the US over the past 120 years.
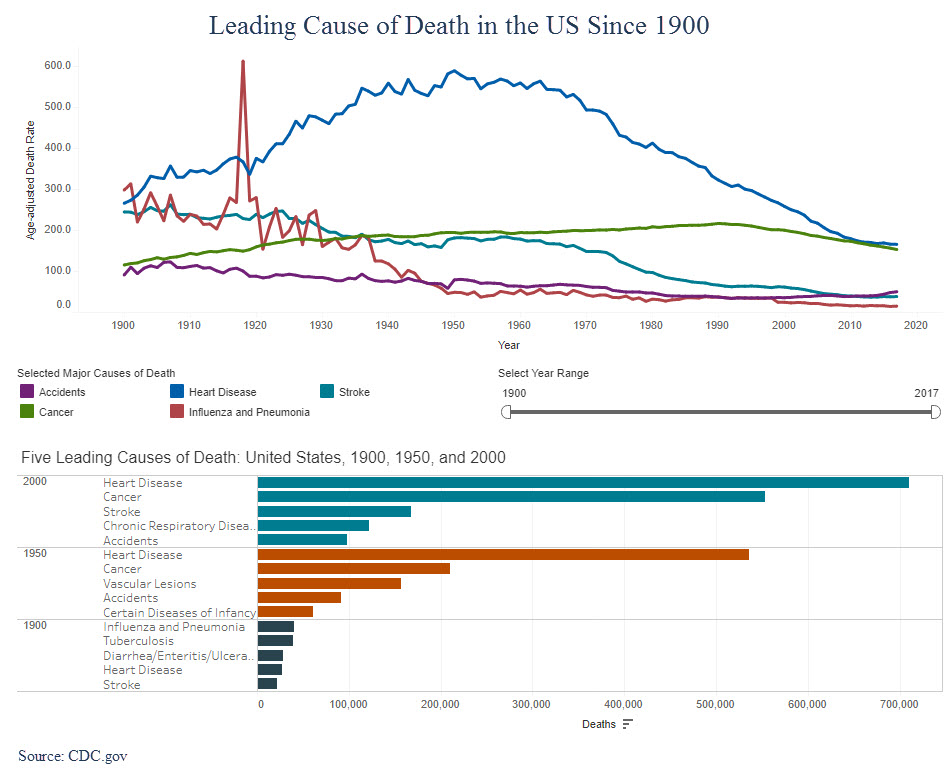 In 1900, most deaths were attributable to the flu, pneumonia, tuberculosis and diarrhea. Most of these caused some sort of infection that could not be controlled, and the person lost his or her life.
Today, medical science has virtually eliminated these causes of death. If we can get a medical breakthrough against COVID-19, we could easily see a very strong rebound in both the economy and the markets.
The second catalyst that could help the bullish case is liquidity. By liquidity, we mean money being printed by the government and central banks.
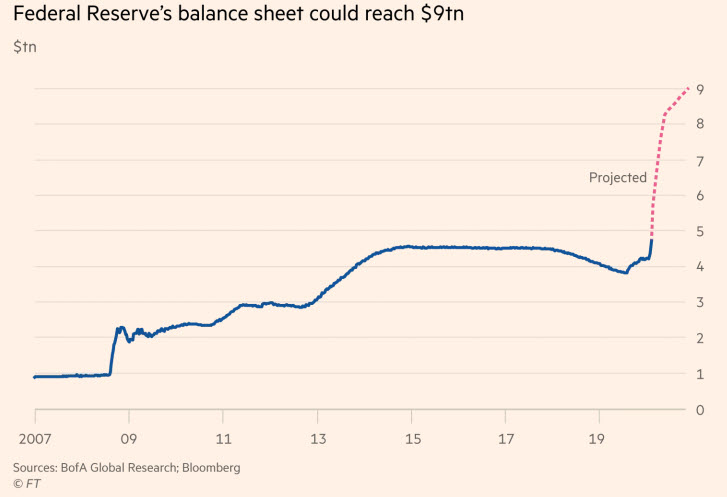
Last week Congress passed a $2 Trillion disaster bill to help individuals and businesses get through this period of time. At the same time, the US Federal Reserve announced they would print $4 Trillion and flood the markets with this artificial capital.
And just this morning, and additional $2.5 Trillion of stimulus was announced by the Fed.
These numbers are stunning. The chart below shows the historical Fed balance sheet since 2007, and the projected balance sheet through the end of 2021.
Over the past two weeks there has been over $8 Trillion dollars in stimulus announced that is scheduled to get into the economy and the markets within the next few months.
To put this is context, over the entire 10 years following the ’08 financial crisis, the Fed printed a total of $4.5 Trillion. This liquidity made its way into the financial markets and helped produce one of the largest and longest bull markets in history.
Maybe this is finally the time when the Fed loses its ability to increase market prices (similar to what happened in Japan over the past 3 decades). But if now is not the time, this could be a tremendous tailwind to asset prices over the coming years.
This injection of liquidity could very well be the secret weapon that allows the market to recover relatively quickly, even in the absence of a medical breakthrough or a fast economic recovery. And this market recovery could occur while the real economy remains in shambles.
Scenario #2: The Worst is Over, but the Recovery is Delayed (Neutral)
This scenario is based on the economy recovering, but not as strongly as we all hope. This is the “U” or “W” scenario we discussed in our previous report.
This scenario seems very logical to us.
The economy will start to loosen up. We will go back to socializing in restaurants, and spending time in public places. We will go back to work and school.
But we could be a bit tentative. Maybe we don’t go out quite as much as we used to. Maybe the virus makes a comeback because we let our guard down. Or maybe most of us are still practicing a modified form of the current “social distancing” that results in slower economic activity.
In this scenario the economy improves, but instead of it happening in May or June, it is pushed out until later summer or early fall. Businesses that were forced to shut down don’t reopen. People who had jobs before don’t have them after. People remain cautious about large gatherings, travel and other activities.
This would result in a stubbornly high unemployment rate. Consumer spending would be weaker. Government stimulus certainly has a limit, although the election year could push politicians to extend things out further than would normally happen.
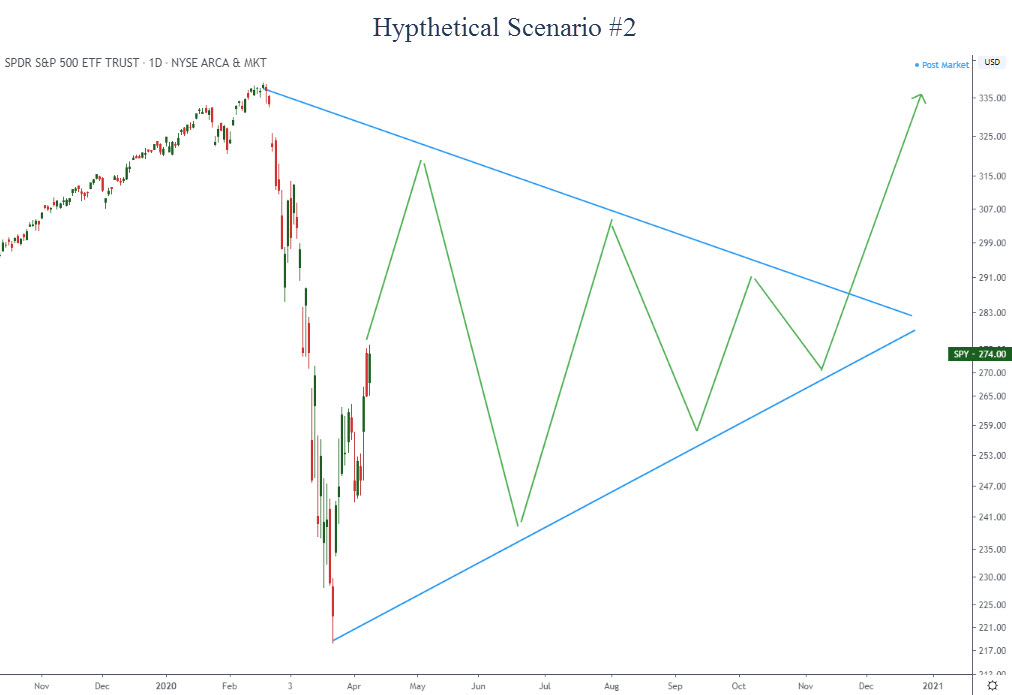
From a market perspective, we would likely see large swings higher and lower, but no real progress either way. Somewhat like the hypothetical chart below.
This obviously is a complete guess, but this type of pattern does tend to occur late in investment cycles. This would be an environment full of starts and stops that would certainly take its toll on investors. Good economic and COVID developments would be followed by bad developments. As soon as it appears we are in the clear, something negative happens, and vice-versa.
Ultimately the economy would recover and markets would resume moving higher, but it would take longer than we hope.
Scenario #3: Depression (Bearish)
Frankly, we don’t even like thinking about this scenario. But we must consider it and be prepared for it if it happens.
This suggests we are only in the early innings of the damage. In this scenario, there is no medical breakthrough, efforts such as shelter-in-place fail to contain the spread of the virus, patients who recovered get infected again, and the economic damage is deeper and lasts longer than anyone expects.
If this were to begin to become reality, it would likely start with a strong move lower that is equal to or greater than the large drop we saw from February to March. Ultimately, this scenario would result in a market that declines somewhere between 50-75% from its peak.
As uncomfortable as this scenario is, unfortunately it is still a possibility.
However, one of the main things that puts this scenario as a very low likelihood is the $8 Trillion of liquidity getting pumped into the markets and economy. This alone reduces the probability dramatically, where we should not expect that to be the likely outcome. However, we would be foolish to ignore this possibility.
Conclusion
In summary, as the news gets reported on the virus and the economy, remember that it is not just the news itself that drives the markets. It is the expectations of what reality may be that is the true driver of prices.
Bottom line, we need to remain unemotional about the future direction of the markets, and open to different potential outcomes. It is incredibly important during uncertain times like these to have a disciplined, rules-based approach to portfolio management that can adjust to changing circumstances without having to guess what will happen next.
Invest wisely!
Our clients have unique and meaningful goals.
We help clients achieve those goals through forward-thinking portfolios, principled advice, a deep understanding of financial markets, and an innovative fee structure.
Contact us for a Consultation.
Neither the information provided nor any opinion expressed constitutes a solicitation for the purchase or sale of any security. The investments and investment strategies identified herein may not be suitable for all investors. The appropriateness of a particular investment will depend upon an investor’s individual circumstances and objectives. *The information contained herein has been obtained from sources that are believed to be reliable. However, IronBridge does not independently verify the accuracy of this information and makes no representations as to its accuracy or completeness. Disclaimer This presentation is for informational purposes only. All opinions and estimates constitute our judgment as of the date of this communication and are subject to change without notice. > Neither the information provided nor any opinion expressed constitutes a solicitation for the purchase or sale of any security. The investments and investment strategies identified herein may not be suitable for all investors. The appropriateness of a particular investment will depend upon an investor’s individual circumstances and objectives. *The information contained herein has been obtained from sources that are believed to be reliable. However, IronBridge does not independently verify the accuracy of this information and makes no representations as to its accuracy or completeness.
