The S&P 500 has broken out and hit a new all time high as we will allocate any remaining cash so that we may participate in the renewed bull trend. Also, we continue our discussion on the theme of over-diversification. It is a real thing, and many investors have seen how real it is in 2018 with many portfolios underperforming because of their allocations into investments such as international stocks, high yield debt, and emerging market equities. There is no such thing as investing nirvana, but we do break down the reasons for diversifying and suggest a new way to approach it.
[maxbutton id=”5″ url=”https://ironbridge360.com/wp-content/uploads/2018/08/IronBridge-Insights-2018-08-24-Investment-Nirvana.pdf” text=”View PDF” ]
FIT Model Update: Bull Market
![]()
The amount of unsecured personal loans issued has ballooned to over $120B. Borrowers are using the proceeds to pay off other loans, renovating their homes, or as a Barclays offer promotes, “take a trip”. According to TransUnion 1.5 million of these loans were issued to borrowers with credit scores under 601, otherwise known as subprime. Statistics without context don’t provide much value, but comparing the $120B issued in this market today to the prior peak in 2007 shows an almost doubling of its size. It does seem there is a credit boom right now.
Portfolio Insights
The Trend is Your Friend
“The Waiting is the Hardest Part.” – Tom Petty, Musician
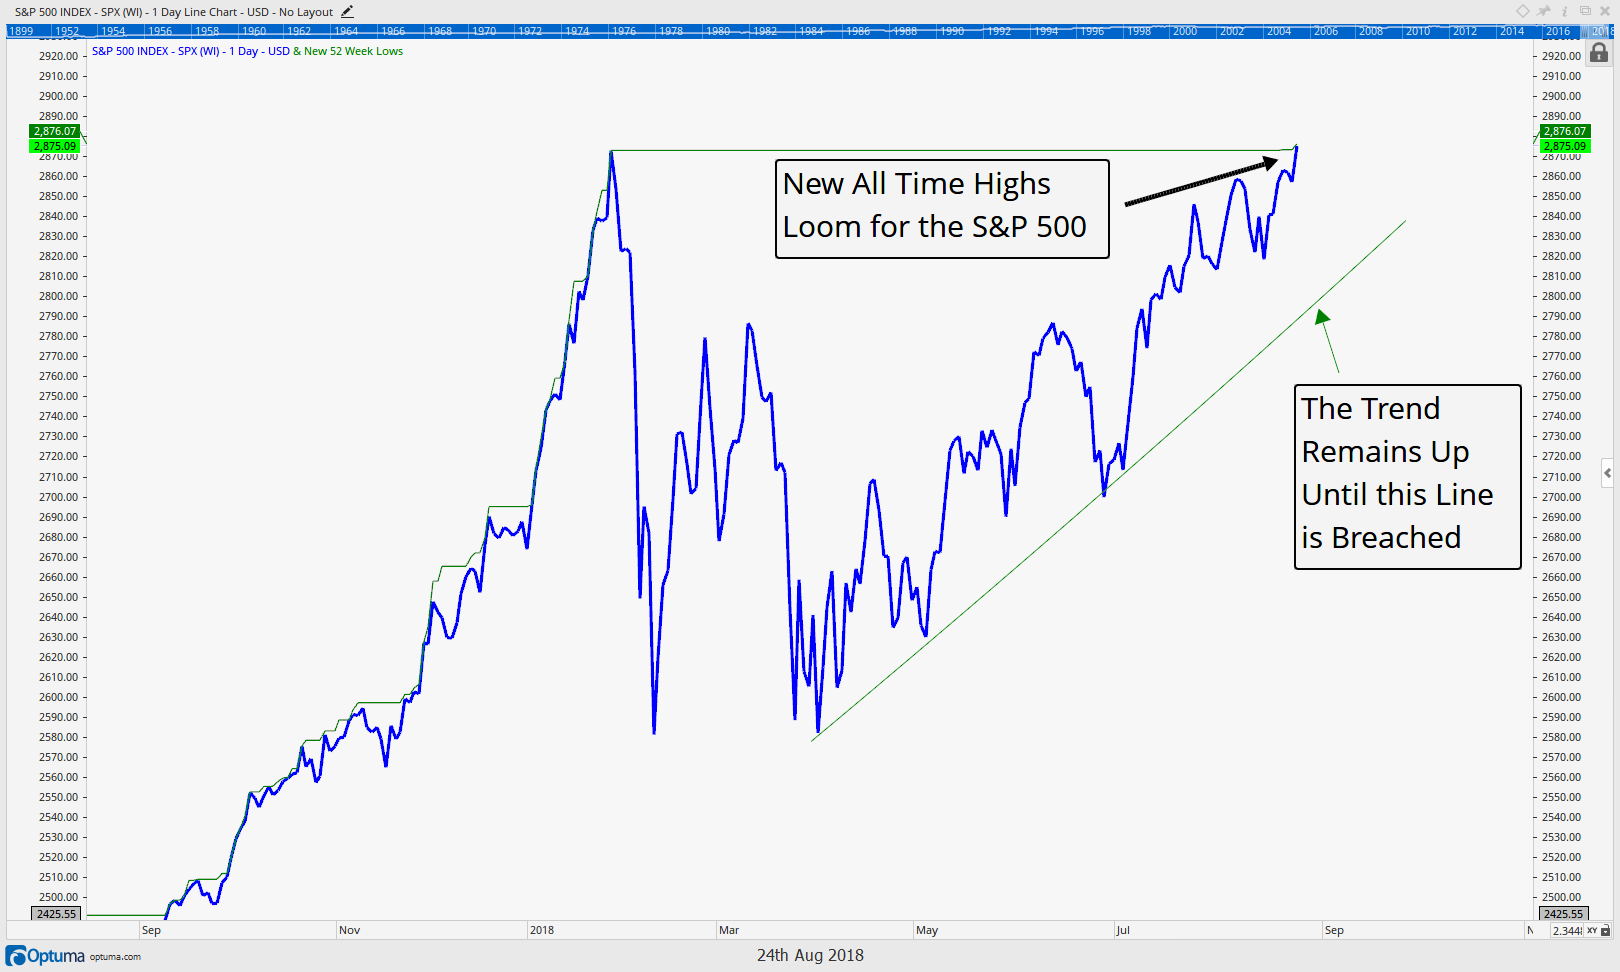
The market just completed the next major market signal, a breakout to new all time highs on the S&P 500. This move, in our opinion, removes the immediate risks that have been elevated since February and allow us to put to work the remainder of any cash on the sidelines.The chart below shows that we have just made a new high in the S&P 500.
When price makes a new high it shows us that buyers are overwhelming sellers or said another way, that demand is overwhelming supply. As long as demand is greater than supply prices will rise.
Does a new all time high relieve us of all the risks we have been focused on since February? No, of course not, and on our radar for risks to the bullish trend remain the following:
- Our July 27th ‘IronBridge Insights’ discussed the weakened state of breadth. Still, even this close to a new all time, less than 65% of S&P 500 stocks are above their 200 day average prices. The gap between the S&P’s new all time high with over 35% of its constituents in bear markets (price<200 day moving average) is large.
- The Dow and NYSE are still not participating in the new highs seen by the Small Caps, Mid Caps, Nasdaq, and now S&P 500.
- In the June 1st and July 13th issues we called out the potential tech and Amazon bubble driven by Passive Investment vehicles. That risk remains as a small list of stocks continue to fuel the S&P 500 higher.
However, the fact of the matter is the market’s longer term bullish trend is now resuming, and we want to continue to participate in it. Next week we may get the opportunity to start putting the remainder of our cash to work as we identify certain areas of strength.
Discussed in our next section, one area may actually be international stocks, after a long lull from our screens. Other areas of strength we have been seeing are in small and mid-cap stocks as well as some of the largest large caps.
Market Microscope
Investment Nirvana
“Diversification is protection against ignorance. It makes little sense if you know what you are doing.” – Warren Buffet
Just a Cop-Out
We see a lot of portfolios in our business. Most of them are pretty much the same. Allocate a lot of one’s capital to domestic equities, a lesser amount to domestic bonds, a smaller, yet sizable amount to international equities, and the remainder in other, supposedly non-correlated assets such as commodities, real estate, bonds, or alternatives.
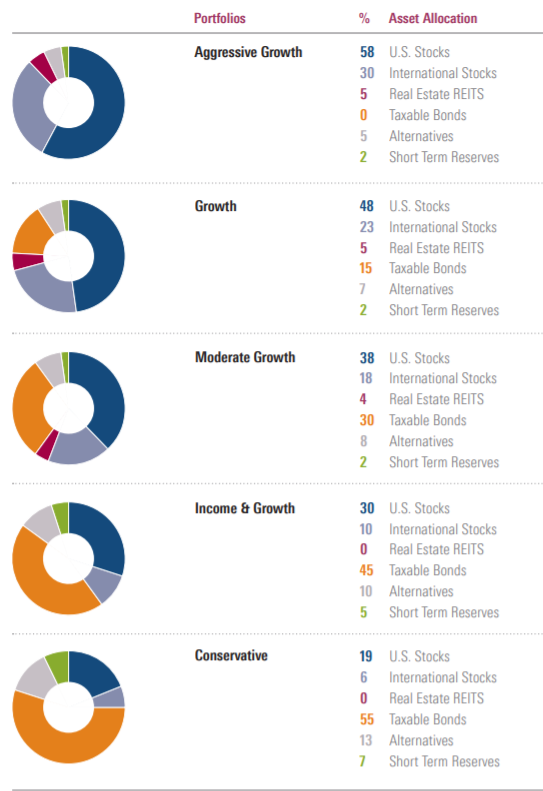
The chart below, from Morningstar, shows typically suggested portfolios with diversification out of U.S. Stocks and into International Stocks, REITS, Taxable Bonds, Alternatives, and cash at varying degrees, and this indeed is how 95%+ of portfolios look.
The primary mathematical driver for diversification is called “correlation”, defined as a mutual relationship or connection between two or more things. It is our job to specifically focus on correlations among different assets in a portfolio. Historically, correlations between assets and more broadly, asset classes, was wide, and often negative.
However, the whole idea of diversification breaks down as correlations move closer and closer toward 1 (correlation is measured between -1 and 1), and, unfortunately, a move closer and closer toward 1 is what has been occurring over the past decade across most asset classes. The biggest wake up call to this was the financial crisis, when just about every asset out there fell in price together. Most banks struggled as an example because, for the first time ever home values across the entire country fell in price together. There was little protection from being diversified, and unfortunately it seems not much has changed as markets across the globe continue to generally rise and fall together.
In a simplistic example, if two assets have a correlation of 1, there is zero statistical difference between their price movements. When one moves 1%, the other will move 1%. In this example, there is zero benefit in owning both of these assets…you might as well just own one. This is similar to the financial crisis scenario where all assets fell in price together. There was little protection from owning international stocks, homes, oil, gold, silver, private equity,or most other investment assets. They all fell in value together at the same time, and an investor’s only real protection was that some fell a little less than others. But the point is a positively correlated portfolio rises and falls together.
A negatively or zero correlated portfolio, however, would have fared much better in such a scenario. If two assets have a correlation of -1, then when one rises 1%, the other is expected to fall (-1%). But if your portfolio was completely negatively correlated, which implies a 100% hedged portfolio, it would get nowhere as gains in one asset would be completely offset by losses in another. Ideally a correlation near 0% is where portfolios should be to maximize diversification value…a portfolio where asset classes are completely independent of one another. However, that’s not the world we live in, and it’s especially not the one we have lived in since the financial crisis.
A correlation of 0 suggests assets have the maximum risk protection and they also have the maximum performance opportunity, as they all independently could rise with no outside factor affecting more than one asset’s returns. They also could all independently not fall when one particular asset is falling in price. A portfolio with a correlation of 0 is nirvana and is what true diversification strives to accomplish.
However, we do not live in an investment nirvana, quite the contrary. Instead investors have been duped into thinking that a pie-charted/diversified portfolio is something that is needed at all times. In reality this diversified portfolio, as Warren Buffett says in the quote we have chosen to represent this article, is what your advisor does when they don’t know what they are doing.
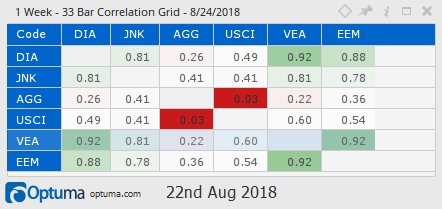
Diversification is probably more of a cop-out. It’s what your advisor relies on to cover his or her you know what when stocks fall. By being diversified, the adviser hopes the other assets in the portfolio will help buffer drawdowns, and pre-financial crisis, this largely would have worked. The typical advisor would throw you into one of the pie charts shown previously in hopes the diversification will help them weather the storm, but this research was based on price analysis decades ago, and the markets have indeed changed. Today, the correlations have shifted so much that the strategy is failing. The markets are much more inter-related and connected and the only asset that over the long run still has a correlation near 0 is cash or cash equivalents. There also are limitations of diversification such as the fact that correlations are backwards looking and can and do change on a dime. Correlations after all are just statistical formulas built from prior price movement history.
The table above shows the correlations of the popular asset classes from a “diversified” portfolio so far this year in 2018 (33 weeks). Every single asset is positively correlated, with the only ones remotely close to a zero correlation, commodities (USCI) coupled with bonds (AGG). Developed international stocks (VEA) are 92% correlated with the Dow and Emerging Market Stocks (EEM) are 88% correlated. Thus, there has been very little diversification benefit in owning DIA (Dow Jones Average), VEA, and EEM. Junk Bonds (JNK) are also in the same bucket, offering very little correlation, and thus diversification, with worldwide equities.
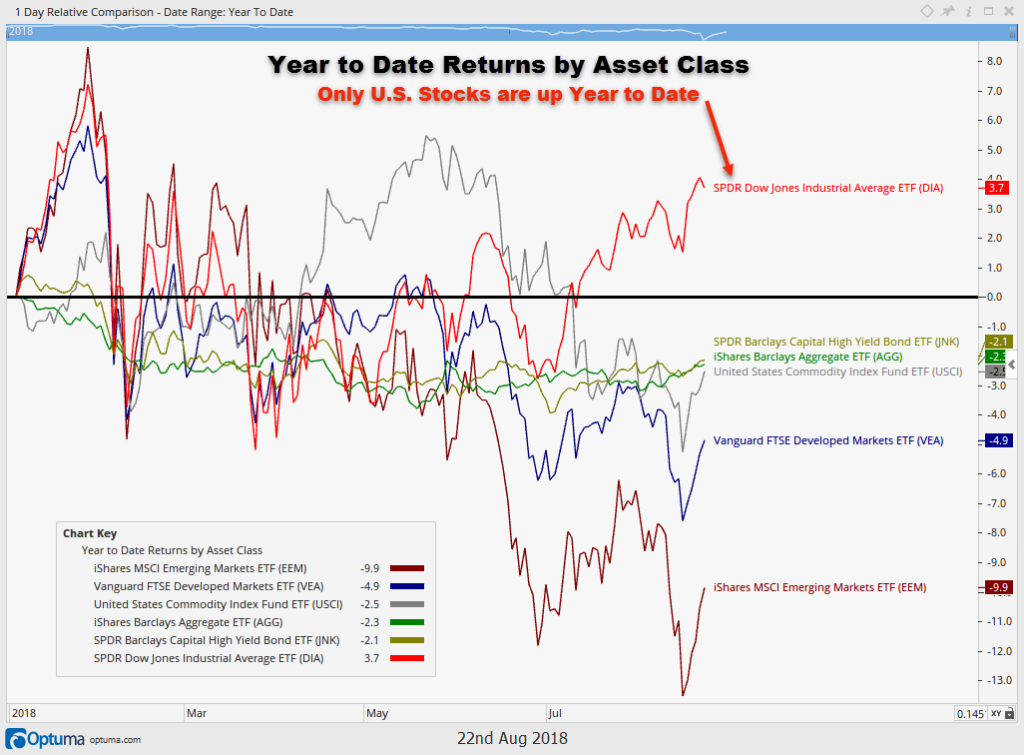
In fact, the next chart shows how being “diversified” in 2018 has really hurt portfolios, more so than helped them. Not only are correlations high, offering no real diversification value, but prices of most assets are falling in price together.
Only U.S. stocks have positive returns thus far in 2018. So, we have a case where diversification has not protected portfolios from the downside, quite the opposite, diversification has been the cause of the downside with those assets all falling in price together. Diversification does not work when assets are highly correlated, and 2018 has been a perfect case study for diversification fatigue and how being diversified, in and of itself, is not an investment strategy.
Finding Investment Nirvana
One final chart reveals what we think is a smarter way to think about diversification and security inclusion. Why hold highly correlated assets in a portfolio for the sole purpose of diversifying out risk, when the definition of high correlation means they are not diversifying out risk? The time to diversify is when correlations are low, not when they are high.
Instead, more concentration in what is working and less correlated assets works better than broad diversification across things that are highly correlated and/or not working. This is what Buffett meant in his quote. He concentrates his investments…the definition of not diversifying.
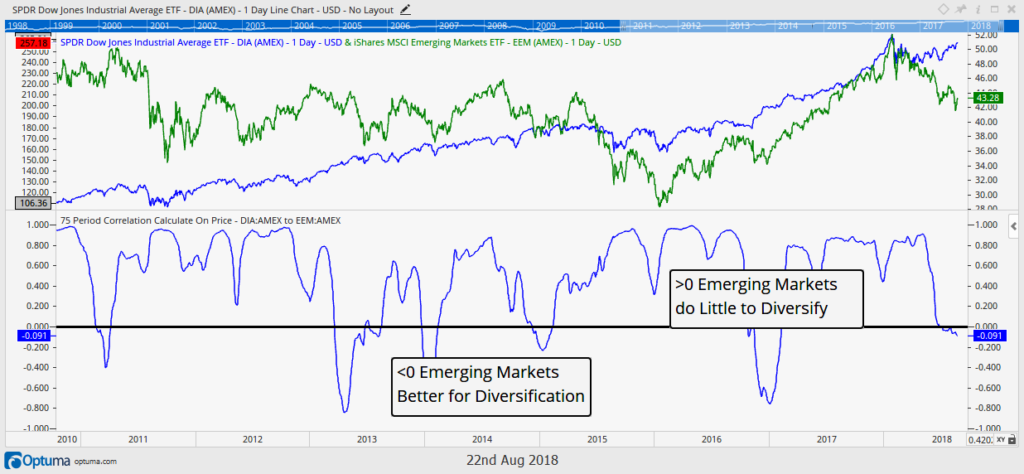
The final chart suggests that instead, at the turn of the year, when most other advisors were very bullish on international and emerging market stocks (shown in green), they would have been better off staying away from this asset class and remaining in U.S. stocks (blue line). With the extreme correlations as shown in the 2nd section of the chart, they were getting little, if no, diversification bang for their buck. These advisers essentially were taking a lot of risk in being in international stocks for no extra expected reward.
Contrast this to right now, when emerging market stocks have finally become uncorrelated with U.S. equities. At a minimum adding emerging market stocks to a portfolio today would at least provide a non-correlated asset class, potentially helping the diversification argument, and maybe even offering outperformance over the U.S. Instead, asset managers who stick with the pie chart at all times will just be clawing back from losses already incurred, continuing to underperform along the way. In hindsight these diversifiers would have been better waiting until now to add international and emerging market stocks to their pie charts.
A correlation of zero is closer to investment nirvana, at least from a diversification perspective. At a minimum we now finally have a diversification reason to own international equities, and that indeed has been rare over the past 8 years, with quarterly correlations between emerging and U.S. markets below 0 for only the 6th time in 8 years (final chart).
Will international and emerging market stocks cross our screens for portfolio inclusion, is a whole other story, but at least now they are adding value from a non-correlated asset aspect.
Invest wisely.
Our clients have unique and meaningful goals.
We help clients achieve those goals through forward-thinking portfolios, principled advice, a deep understanding of financial markets, and an innovative fee structure.
Contact us for a Consultation.
Neither the information provided nor any opinion expressed constitutes a solicitation for the purchase or sale of any security. The investments and investment strategies identified herein may not be suitable for all investors. The appropriateness of a particular investment will depend upon an investor’s individual circumstances and objectives. *The information contained herein has been obtained from sources that are believed to be reliable. However, IronBridge does not independently verify the accuracy of this information and makes no representations as to its accuracy or completeness. Disclaimer This presentation is for informational purposes only. All opinions and estimates constitute our judgment as of the date of this communication and are subject to change without notice. > Neither the information provided nor any opinion expressed constitutes a solicitation for the purchase or sale of any security. The investments and investment strategies identified herein may not be suitable for all investors. The appropriateness of a particular investment will depend upon an investor’s individual circumstances and objectives. *The information contained herein has been obtained from sources that are believed to be reliable. However, IronBridge does not independently verify the accuracy of this information and makes no representations as to its accuracy or completeness.

