NOTE TO CLIENTS
All of us at IronBridge are working from home over the coming weeks during Austin’s shelter-in-place order. Fortunately, we have had remote work capabilities for years. We will continue to serve your needs in an uninterrupted manner with access to our full suite of resources as if we were in the office.
The primary difference is the possibility probability of screaming kids or barking dogs in the background.
Earnings season for Q1 begins late next week. Needless to say, they will be bad. But even in the midst of the corona-chaos, it ultimately is a game of expectations versus reality. Let’s take look at some of the preliminary estimates so we can be prepared for what may come. We also look at previous 30% declines, and discuss the possible shapes the eventual and inevitable recovery may take.
“When you look fear in the face, you are able to say to yourself, ‘I lived through this horror. I can take the next thing that comes along.'”
-Eleanor Roosevelt
No doubt we have all been affected by the Covid-19 Pandemic. As we draft this newsletter, for instance, we are doing it from our respective homes. Where we live, in Austin, Texas, feels like a ghost town. We imagine your town feels similarly (and somewhat eerily) quiet. Entire parking lots are empty when they were typically packed, and we think it is safe to say for many, business is not as usual.
However, technology today is truly showing its positives and allowing many businesses, like ours, to continue rather seamlessly, able to provide services to our clients, even with these extreme circumstances. Once beyond the obvious logistical challenges everyone is facing, for many businesses, like ours, business actually is continuing in a lot of ways as usual.
There are clearly going to be winning and losing businesses that result out of all of this, with many already popping up in one camp or another. Some, like the airlines, are certainly at risk, as their entire industry is facing their biggest challenge ever. Are we going to see nationalized airlines again? How long until international travel will return to levels recently seen? What about domestic travel? Other industries, like streaming video providers and home delivery companies, are likely to have their best quarters ever. Certain companies have benefited greatly from the shift from co-located to isolated work environments.
Previous 30% Declines
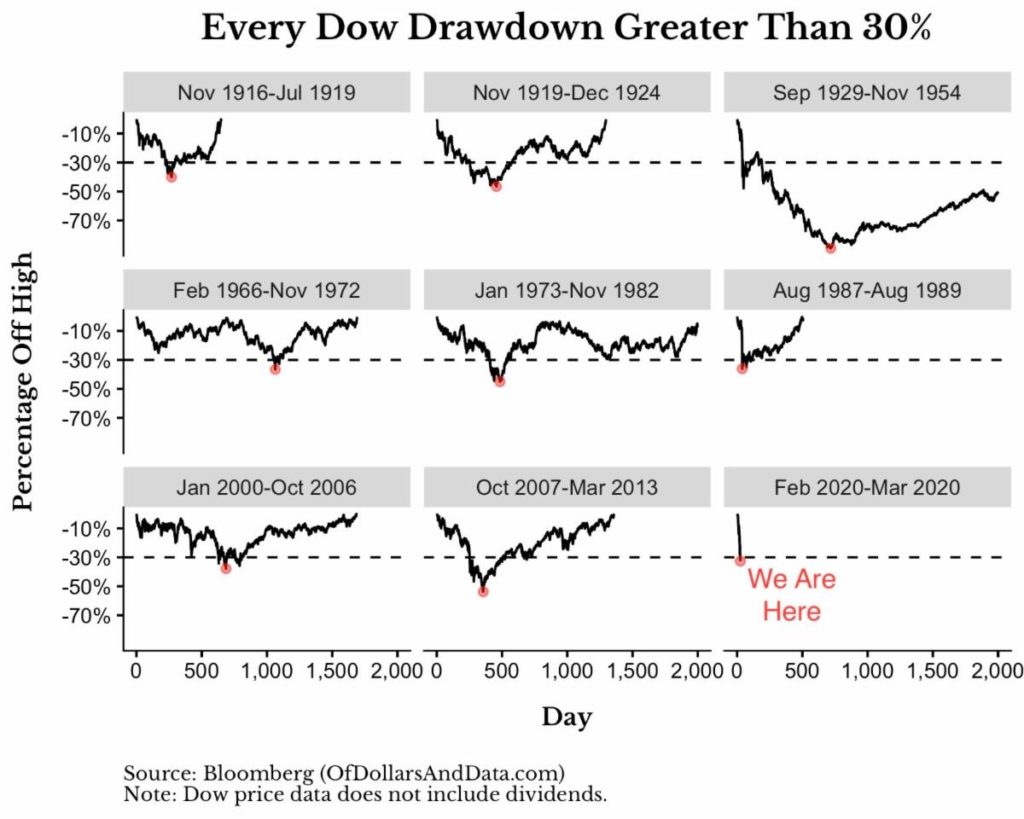
Over the past month we issued multiple reports highlighting how unprecedented the decline in the equity markets has been, and we can now add one more to the record books. What we just witnessed was the fastest decline of over 30% ever in the modern history of America’s stock markets.
The chart below shows this comparison of all the past 30% declines. For this reason, some are now comparing the current decline to the roaring 20s that resulted in the great crash of 1929, morphing into the great depression. From a purely market history perspective the current decline does look a lot like that initial move lower in 1929. If not 1929, then the 1987 crash. These three periods are on the right side of the graphic below and they clearly stand out as different from the other 30% drawdowns. The other periods took their time to get to the 30% mark. 1929, 1987, and 2020, the three most notable market crashes in history, each had remarkable speed in their declines.
Uncertainty reigns supreme. Individuals are digesting just how swiftly everything has changed. Governments are dealing with new threats. Businesses are dealing with the new norm, specifically how to quantify the impact of Covid-19, and that may be the biggest change as far as the markets are concerned. The uncertainty that still exists is apparent in all aspects of life here in America and across the world.
What similar time period should we use as the appropriate analog? Is it the roaring 20s that turned into the Great Depression that had a similarly rosy economic backdrop that then turned greatly negative? Or, is it 1987, a crash that occurred in the midst of a bull market and rather strong economy (there was no recession in the late 80’s).
The financial crisis had a debt and leverage catalyst that took 1.5 years to threaten the solvency of the world’s banks, so that doesn’t seem analogous to today. Case in point, we just witnessed over 50% of the entire financial crisis’s declines in just 5 weeks, so this seems much different. Perhaps now is not like any prior time period, which is just another peg on the massive uncertainty board we are currently looking at.
This uncertainty that surrounds the next few months is unprecedented, and until we start to get some certainty about the future we should expect the recent volatility (both up and down) to continue.
Dare we Look at Earnings?
How uncertain is the world about the future? So uncertain that many companies have stopped providing earnings guidance and hardly any have come out with an estimate of lowered guidance for the 1st quarter or the rest of the year. They just don’t know how bad it is going to affect their companies yet, and with one week left before we kick off Q1 earnings, we are about to clear up a little of that uncertainty.
Earnings will ultimately be the tell of whether or not we truly are entering another recession, or, are we actually on the cusp of an economic depression (hopefully not)? Earnings results in the first quarter and full year expectations will be a big tell as to how bad this thing may get.
Earnings forecasts for the S&P 500 are generally derived two ways.
- Bottom-up. This method begins at the individual company level, and the sum of earnings for each company is used to predict the overall earnings of the S&P 500 itself. At this point there are very few companies providing updated guidance for the 1st quarter (or the rest of the year for that matter), so all we have is their original forecast’s from the first 6 weeks of 2020. No doubt these will be drastically changing over the coming weeks.
- Top-down. This occurs when an analyst looks at historical earnings of the S&P 500 and then adjusts them up or down based on macro and other factors.
Let’s look at both of these earnings estimates.
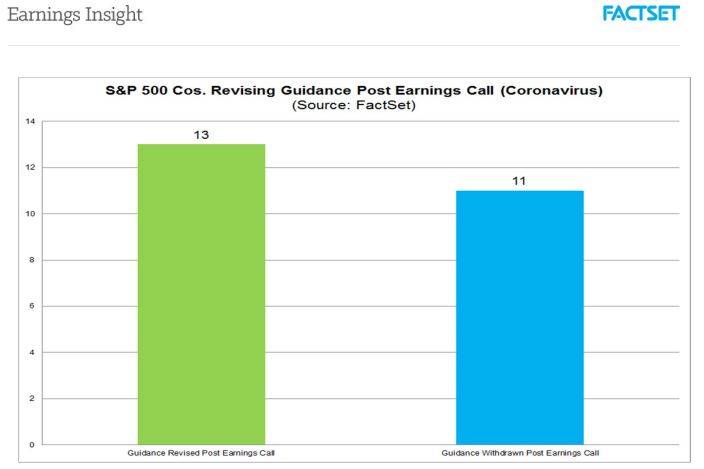
The first chart below shows just how quiet companies have been in adjusting their 1Q earnings estimates in light of the Corona Virus. Most companies provided this original earnings guidance in January and early February, during their full year and 4Q 2019 updates as they are required to report earnings within 45 days of their quarter end.
Since then, only 13 of the 500 S&P 500 companies have adjusted their earnings with only 11 companies withdrawing guidance completely.
Shown by the green bar on the chart above, some of the 13 firms adjusting their guidance lower include: Ralph Lauren, Apple, and Coca-Cola. However, many of these updates were provided prior to March, prior to the virus hitting Europe and North America a lot harder.
The one firm that provided the most recent update, Expedia, had this to say on March 13, 2020, “With the outbreak spreading significantly since Expedia’s fourth quarter earnings call on February 13, 2020, we now expect the negative impact in the first quarter related to COVID-19 to be in excess of the $30-$40 million range provided at that time.” Well that’s helpful! So basically, “things have gotten worse over the last month”.
Shown by the blue bar on the chart above, many of the 11 firms withdrawing guidance for 2020 are travel related companies such as Expedia, American Airlines, and Royal Caribbean. Withdrawing guidance means the company is no longer sticking to the numbers they provided and are not providing any new number, compared to the companies that are “revising” and providing new updated numbers.
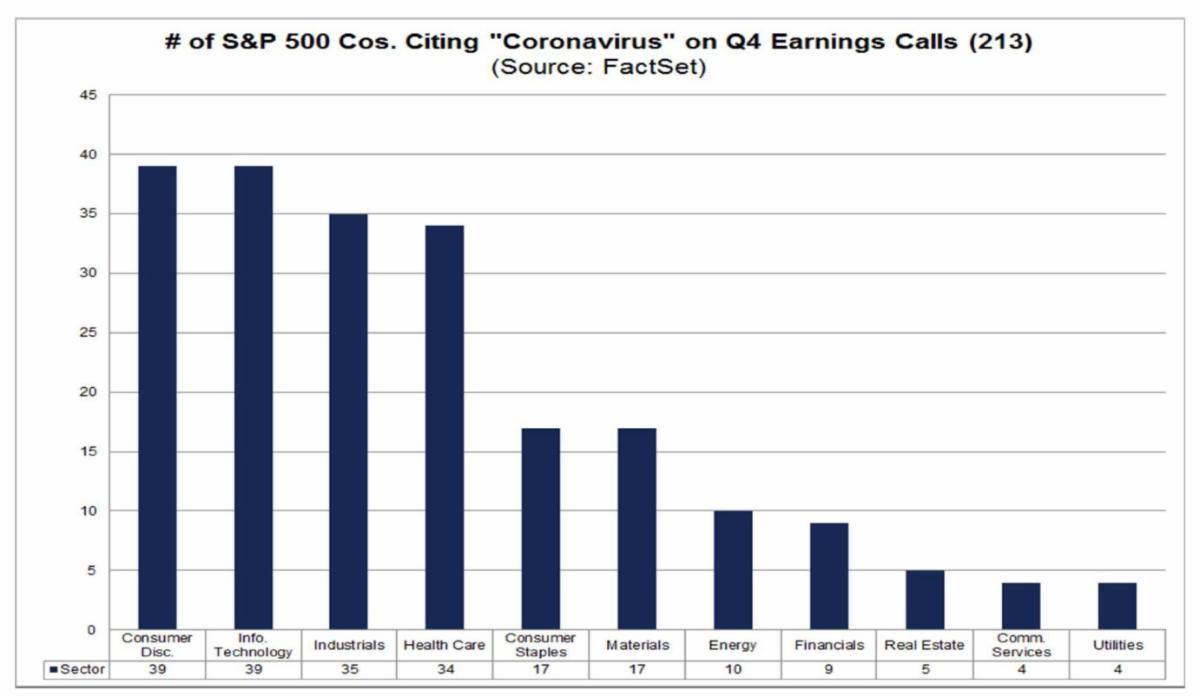
In fact, less than half of the companies in the S&P 500 mentioned the Corona Virus in January and February. The chart below shows that only 213 of the 500 companies mentioned either Corona or COVID-19 in those earnings calls.
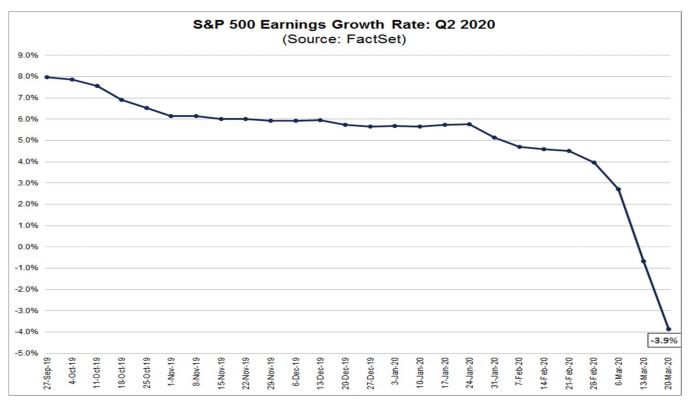
There is no doubt that will change during earnings season beginning next week. Prior to the unprecedented events of March, earnings for Q1 were expected to decline 2.9% from a bottoms up perspective.
Looking forward to Q2, from a bottoms up perspective, the scenario is similar. Very few companies have pre-announced any updates to their earnings. Companies are likely waiting until their 1st quarter earnings call to provide guidance, but it is also probably safe to say that a lot of companies simply do not know how their earnings are going to be affected during this forced period of lightened commerce. It may even come to fruition that they also won’t know how the rest of the year is going to look.
Don’t be surprised if we see a lot of companies withdrawing guidance for the year in the month of April, which could bring more uncertainty back to the markets.
Taken as a whole, from a bottoms up perspective, most companies have not provided any updates and thus bottoms up numbers are no doubt overstated, but by how much? This is where the tops down estimates might be helpful.
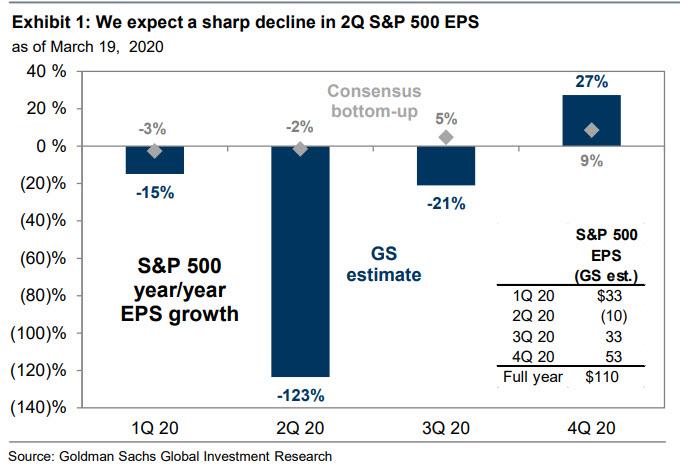
A few firms have taken a stab at just how much Corona Virus is going to affect bottom lines. Goldman Sachs is one of them, and it is not pretty.
The chart below shows what Goldman expects 2020 earnings to look like as of the week of March 23, 2020. They expect a whopping 123% decline in S&P 500 earnings in Q2 which would result in a full year Earnings estimate of just $110, a decline of 21% from 2019. (Earnings that fall more than 100% simply mean that the S&P 500 companies will lose money as a whole).
This also includes a massive assumption around Q4, with an estimate of $53 in earnings per share, which would be the biggest quarter ever by the S&P, by a long shot ($36 was the previous largest quarter). After such a deep pullback in demand, one would expect a strong snapback, so perhaps it is possible. But the reality is we could possibly see a whopping 20-30% decline in earnings for 2020.
Joining Goldman in their outlook, JP Morgan has a slightly more dire forecast of economic activity. They are now assuming a 30.1% decline in GDP in the 2nd quarter of 2020, with an unemployment rate average of 12.8% per this article by Fortune. For comparisons, Goldman is assuming a 24% drop in GDP in the 2Q.
It seems pretty safe to assume the 2nd quarter is going to look awful. And that’s an understatement. Given the potential drop in earnings, the stock market may actually be thinking rationally about all of this. Yes, it happened much faster than anyone thought possible, but so has the expected drop in earnings and economic output.
From a valuation standpoint, on Dec 31, 2019 the S&P’s valuation was 23.2x its earnings estimate of $139 to get to a price of $3230. If we assume Goldman’s earnings target of $110 for the year and a similar valuation multiple of 23x trailing earnings, then an S&P price of $2,530 seems reasonable. The S&P is right at that $2,530 price as we type on Friday, March 27.
What Shape will the Recover Take?
The million-dollar question remains: How long will this last?
Most economic recoveries occur in patterns that look like either a V, W, U or an L. Let’s assume that March and April are likely to be the two of the worst months in US economic history. What will the recovery look like?
A “V” recovery is one where the rebound in activity roughly equals the decline. This would imply that the violent decline in earnings will be followed by an equally violent rebound in activity. Maybe people will be tired of being cooped up for a month. Maybe the stimulus package will keep people from being evicted, and maybe the businesses that are shut down today will reopen to a line of customers out the door. This is the scenario we hope for. This would lead to a surprisingly strong stock market, and make the current environment a tremendous buying opportunity.
A “W” recovery initially looks like a “V”. Then there is some sort of relapse, where the markets and economy become weak again before ultimately rebounding. This may very well be the shape that this recover takes. The initial drop has been extreme for both markets and the real economy. A strong snap-back is logical. However, if the virus is initially contained through social distancing measures, but makes a strong comeback once people start going back to normal, we could easily find ourselves in the same situation over the summer or fall. Opportunities would still ultimately surface from this scenario, but there would be another period of very high volatility upon the second bout of uncertainty.
A “U” recovery would eventually get the economy back to previous levels, it just might take a little longer. This would suggest that the virus uncertainties extend into the summer, and more slowly work their way higher. In this scenario, there is no real snap-back in the economy or the markets, it simply remains weak for longer than a few months. This weakness could take 6-12 months to have any meaningful rebound. Volatility would remain high, and uncertainty would also remain very high. Ultimately, the market would rebound, but it would be after a lengthy recession with very little positive signs. This environment would favor the tactical investment strategy where risk could be quickly added and removed from portfolios.
The “L” recovery is what we desperately hope to avoid. Given the enormous drop in economic activity we’re seeing right now, this would likely lead to an economic depression. If we remain in a lock-down environment beyond April, and extend into the summer months, the risks dramatically increase that we would not see a fast rebound at all. This would suggest that it would take years to get back to where we were, and starts to bring up even more parallels to the 1929 crash. This scenario would likely lead to long-term unemployment, consumer behavior that changes permanently, personal and business bankruptcies, stress in real estate markets, and a generally bad environment for longer than many people think possible.
What will happen? We wish we knew the answer. The optimistic viewpoint is that this mess was not started by an underlying problem in the economy, like what occurred in 2008. We also have unprecedented liquidity being injected into the markets by the various central banks across the globe. The US is about to flood markets with over $6 Trillion of liquidity. That could have a very positive effect on markets and keep the economic damage contained to a short period of time. Expectations surrounding the virus are very negative, thus any positive developments could help boost expectations, along with market prices and economic activity.
The more negative view is that uncertainty is the real devil here. In a world of instantaneous digital news, that devil can get into our minds very quickly. We should expect that reported cases of Covid-19 are about to skyrocket, as are death totals. This could have negative effects on people’s psyche beyond what is already in place today. The economic damage is real, and the longer it extends the worse the ultimate outcome will be.
Invest wisely!
Our clients have unique and meaningful goals.
We help clients achieve those goals through forward-thinking portfolios, principled advice, a deep understanding of financial markets, and an innovative fee structure.
Contact us for a Consultation.
Neither the information provided nor any opinion expressed constitutes a solicitation for the purchase or sale of any security. The investments and investment strategies identified herein may not be suitable for all investors. The appropriateness of a particular investment will depend upon an investor’s individual circumstances and objectives. *The information contained herein has been obtained from sources that are believed to be reliable. However, IronBridge does not independently verify the accuracy of this information and makes no representations as to its accuracy or completeness. Disclaimer This presentation is for informational purposes only. All opinions and estimates constitute our judgment as of the date of this communication and are subject to change without notice. > Neither the information provided nor any opinion expressed constitutes a solicitation for the purchase or sale of any security. The investments and investment strategies identified herein may not be suitable for all investors. The appropriateness of a particular investment will depend upon an investor’s individual circumstances and objectives. *The information contained herein has been obtained from sources that are believed to be reliable. However, IronBridge does not independently verify the accuracy of this information and makes no representations as to its accuracy or completeness.

