There are three primary components to market analysis: fundamentals, quantitative/technical analysis, and sentiment.
Sentiment analysis, sometimes known as behavioral finance, can play a major part in the market’s movements. Investors are emotional, and understanding the emotional status of the market can give insights into both the current and future market conditions.
“All through time, people have basically acted and reacted the same way in the market as a result of greed, fear, ignorance, and hope. That is why the numerical formations and patterns recur on a constant basis. Over and over, with slight variations. Because markets are driven by humans and human nature never changes.”
-Jesse Livermore, Famed American Investor
 Back on June 11 we looked at the markets and thought of the famous term, “climbing the wall of worry or sliding down the slope of hope“, and although we didn’t go into the broader topic of sentiment then, that famous saying is rooted by terms more in line with one’s emotions rather those more traditionally associated with the markets. The words worry and hope are descriptors of emotions and much more likely to be found as topics of discussion in a psychology textbook than in finance curriculum. But history teaches us that, although typically given less attention by the general public, sentiment and emotions are a major component to markets, personal life, and the business environment in general. We think it may even be a primary driver of business cycles.
Have you ever made an impulse buy? That’s an example of an emotional decision, and similar emotions to purchase can also affect investors. Have you ever bought a stock because you were afraid of missing out on gains? Notice “afraid” is an emotion and buying something out of fear could also be considered an impulsive action.
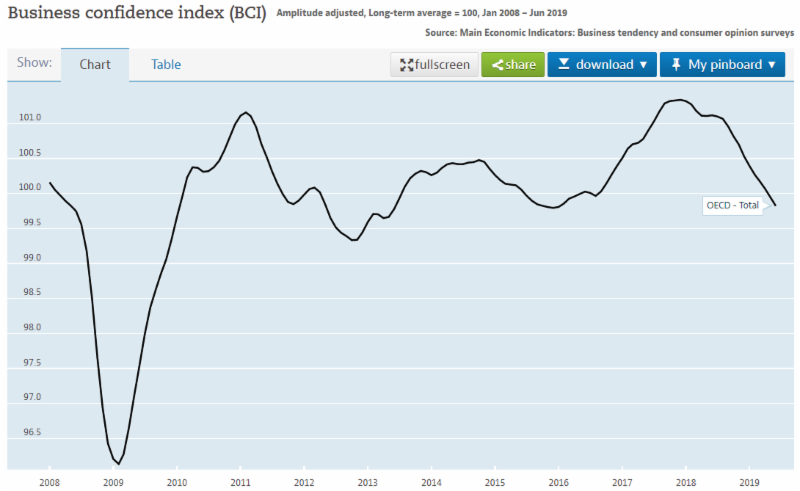
The “Business Confidence” Index is one way the government tries to track market sentiment. There are many of these indices out there, with one displayed below, but generally they are surveys provided by economists to business owners to attempt to get a “feel” for the business environment.
Confidence, after all, is a subjective state of mind, not an objective measurement found on a profit and loss statement. Economists have even figured out that, although they are not generally called out in their “ceteris paribus” models, confidence and emotions are a very important part of the business cycle. The index depicted below shows that confidence, too, moves in a cyclical nature. High at times, and low at other times.
Is sentiment currently elevated or is it depressed?
Like most things, it depends. If a person just got a new job, is making a lot of money, is happy with their life, and is “optimistic” about their future projections, they are probably more likely to buy a car, a house, a stock, etc.
On the flip side, if one just lost their job, had no income, and was overly pessimistic about their situation, would they be more likely to buy stocks or sell stocks?
2008 is a perfect example of the emotional psychology that comes along with stock market analysis. Very few thought about buying stocks on the way down during the financial crisis, and thus we saw nearly a 60% decline in the markets. There were probably other factors at play, but mood and lack of confidence were certainly major components.
Back in June in our “Wall of Worry” Newsletter, we noticed a negative sentiment backdrop at the time. The news was largely negative and there were countless reasons from the talking heads not to invest in stocks. Since then, however, the S&P has rallied to new all time highs. Sentiment was low, and that was a pretty good indicator that we could be bullish. But things change and the markets’ sentiment ebbs and flows now suggest a little more caution here.
Famous Trader Sir John Templeton is credited as coining the term, “Bull markets are born on pessimism, grow on skepticism, mature on optimism, and die on euphoria”.
The saying goes on…”The time of maximum pessimism is the time to buy, and the time of maximum optimism is the best time to sell”. This quote sums up sentiment analysis and what equation we are trying to solve. Are we currently at a time of pessimism, skepticism, optimism, or euphoria is a question we ask ourselves regularly.
One reason why many investors may stray away from sentiment analysis is because it’s not really that easy. Let’s elaborate. It’s easy to measure revenues and fundamentals (it’s just math), but it’s extremely hard to measure emotions, which are much more subjective and vary from person to person.
One’s optimism may be elevated, but is it high compared to anothers? If we told you we were super optimistic about stocks, and another portfolio manager said they were pretty optimistic, it’s entirely possible that the pretty optimistic manager could actually be more bullish than the super optimistic one. How? The super optimistic manager may have a bearish inclination or personality, so a super optimistic outlook may only mean a 50% allocation to equities whereas a pretty optimistic allocation by the other manager may mean a 70% allocation to equities. Have you ever met a “negative nancy”? If they told you they were really happy to be at a party would they be more happy than a more bubbly personality’s “pretty happy” to be at a party? Maybe, but maybe not, and thus we introduce the problem with surveys, with a jab at surveys in the cartoon below.
Surveys, such as those about business confidence, are one way to try to get a bearing on sentiment. But these surveys are influenced by an individual’s personal experiences or inclinations that particular day, week, or year.
There’s a risk of inconsistency. There can be a tremendous amount of bias in surveys and many of the traditional ways to try to measure sentiment.
This bias is certainly a reason to try to take the subjectivity out of emotional analysis and attempt to objectify it. It’s also a reason why many investors aren’t that versed in sentiment analysis. After all is said and done, the analysis itself still carries a level of subjectivity to it.
Extreme pessimism can always get more extreme just as optimism can always get more euphoric.
To us this is no different than the extremities in many other areas of finance, such as fundamental analysis (bond yields are at all time lows but could still go lower), valuations (expensive can always get more expensive), or technical analysis (oversold and overbought can always get more oversold or more overbought). Despite its subjectivity, we find sentiment analysis to be extremely valuable and a key component in measuring the longer term potential of investments.
Jason Geopfert at SentimenTrader.com is one of the partners we use for sentiment data. They, as much as anyone we have encountered, do a fantastic job of objectifying the subjective field of sentiment analysis. One way they do this is by utilizing objective data sources in the first place. There are plenty of ways to measure sentiment beyond potentially biased surveys. Some examples of the more objective indicators they provide include:
- Margin debt utilized by investors (how much leverage are investors taking?)
- The number of put options being bought compared to call options (how bearish or bullish are investors?)
- The amount of cash in accounts (how much cash is available to invest in the markets?)
- Insiders buying or selling (What is the “smart” money doing?)
- Volume and Open Interest (Is there increased or decreased activity?)
Jason and his team also utilize popular, but more subjective, survey sources such as:
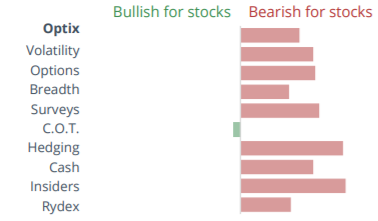
In addition, they categorize sentiment more broadly into ten categories (we’ll go into the numbers in a bit).
- Optix – Analysis of ETFs and their underlying holdings
- Volatility – What volatility measures are implying about the market
- Options – What options traders are doing with their money
- Breadth – What the market internals are showing
- Surveys – What surveys are suggesting about confidence
- COT (Commitment of Traders) – What the speculators and hedgers are doing
- Hedging -What’s the level of hedging going on
- Cash – How much cash is on the sidelines
- Insiders – What Insiders at companies are doing with their own shares
- Rydex – What Rydex Fund’s investors are investing in
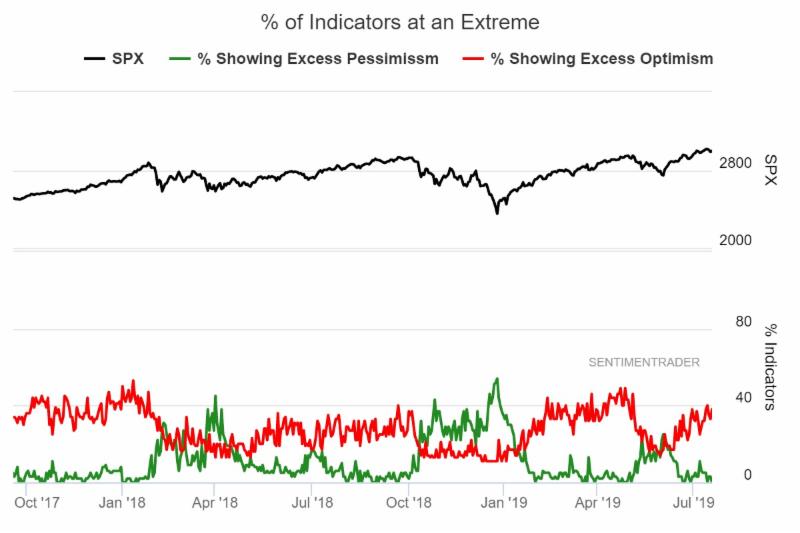
In each of these 10 categories they have a number of indicators that they have gathered data and tracked as an index over years and in many cases over decades. Because the site has a long history of indexed data they can also identify when these indicators are at various “extremes”. We think pictures indeed can be worth a thousand words, so below is the index of these aggregated indicators at “extremes”.
The SentimenTrader “% at Extremes” chart above reveals a few things pertaining to sentiment.
- The red line shows 38% of their indicators are currently posting an “Optimism Extreme”, which should be looked at as a bearish signal.
- The green line reveals 0% of indicators are currently posting a “Pessimistic Extreme”, which is also bearish (it’s a sign of excessive optimism/euphoria to have zero pessimism anywhere).
- 38% is historically a high number and is near the range reached at prior market tops. Recently, the May 2019 top coincided with 49% of their sentiment indicators near extremities, but the September 2018 top coincided with a peak of just 40% of their indicators near bullish extremes.
- 0% at pessimistic extremes is also a number associated with market tops. The chart helps reveal this. Notice the lows of 2018 were associated with pessimistic readings of 40%+ of indicators but market tops saw the % of pessimistic indicators drop near or to 0%.
- Point 3 is a good example of the subjectiveness that still exists in sentiment data, even after objectifying this data. Is 38% a high enough number to mark a top? It’s happened before, but then again, so has 49%, so there could be more rally to go before ultimately topping out. It doesn’t have to though.
- Based on their indicators the market is in an optimistic state. History suggests the market is likely closer to a top than a bottom.
Next is a breakdown of where each of the 10 sentiment categories currently stand. All but one are in the “very bearish” range.
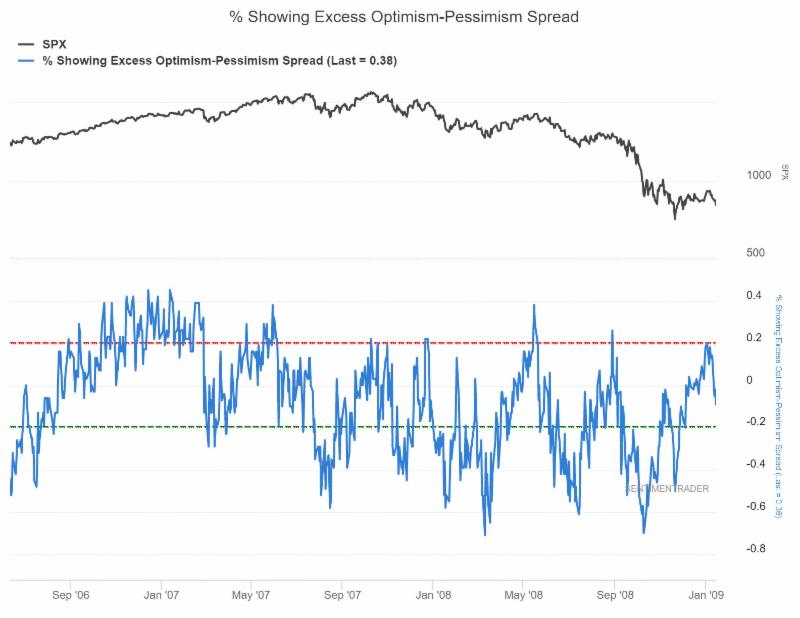
 One final chart we want to show is the same “% at extremes” chart as above for the 2007-2009 period. The only difference being the index in blue is the % of optimistic extremes less the % of pessimistic extremes. With the current reading of 38% optimistic extremes and 0% pessimistic, this indicator also has a value of 38% today.
Interestingly, the 2006-2007 period saw a similar level of optimistic extremes near the market tops as we have seen recently with a peak reading of 42% in late 2006, a second peak reading of 38% in June of 2007, and then a final peak, at the October 2007 stock market peak, of just 21%, reached again in December 2007, just before the bulk of the financial crisis occurred.
Sentiment was deteriorating in 2007, and this deteriorating nature of sentiment is also something analysts could (and should) take note of as it helps solidify another popular saying, “market tops are a process”.
Sentiment was deteriorating for a year prior to the ultimate stock market peak in 2007, but more importantly, sentiment was peaking when the stock market was peaking and troughing when the stock market was troughing.
It’s pretty clear to us that sentiment, emotions, behavioral finance, whatever you want to call it, is an extremely valuable tool.
Even during the 2008 crisis, when stocks were on their way to a 40%+ decline, spikes in optimism coincided with market tops as the chart above shows. May and August 2008 stand out. And, on the opposite end of the spectrum July and October 2008 also reveal a level of peak pessimism that helped align with those temporary market bottoms.
The market’s mood, indeed, does matter, and right now that mood is optimistic, potentially to an extreme. It’s certainly elevated to levels that have marked previous tops, so we are cognizant of that and watching for any prolonged downturn in stock prices.
Does it mean we are about to embark on another 2007 and 2008?
No, as sentiment remains a subjective tool where extremes can always get more extreme. But it does mean we should continue to monitor the situation intently. As a result we have continued to tighten the stop loss prices of our holdings to help us stay ahead of any potential trend change, just in case sentiment is once again leading the market and showing signs of another market top.
The good news is, if we are topping now or in the near future, we can also look for an extreme reading of pessimism to help identify an increased likelihood we are witnessing a bottom, just as December 2018’s reading of pessimism moved above 40% of indicators. A similar move would likely help mark at a minimum a near term bottom, as exemplified by both the recent time series as well as the one from the 2006-2009 period.
Invest Wisely.
Our clients have unique and meaningful goals.
We help clients achieve those goals through forward-thinking portfolios, principled advice, a deep understanding of financial markets, and an innovative fee structure.
Contact us for a Consultation.
Neither the information provided nor any opinion expressed constitutes a solicitation for the purchase or sale of any security. The investments and investment strategies identified herein may not be suitable for all investors. The appropriateness of a particular investment will depend upon an investor’s individual circumstances and objectives. *The information contained herein has been obtained from sources that are believed to be reliable. However, IronBridge does not independently verify the accuracy of this information and makes no representations as to its accuracy or completeness. Disclaimer This presentation is for informational purposes only. All opinions and estimates constitute our judgment as of the date of this communication and are subject to change without notice. > Neither the information provided nor any opinion expressed constitutes a solicitation for the purchase or sale of any security. The investments and investment strategies identified herein may not be suitable for all investors. The appropriateness of a particular investment will depend upon an investor’s individual circumstances and objectives. *The information contained herein has been obtained from sources that are believed to be reliable. However, IronBridge does not independently verify the accuracy of this information and makes no representations as to its accuracy or completeness.


