• Skip to main content
  • Skip to footer

IronBridge Private Wealth

Forward with Confidence

  • Home
  • Difference
  • Process
  • Services
  • Insights
    • IronBridge Insights
    • Strategic Wealth Blog
    • Strategic Growth Video Podcast
    • YouTube Channel
  • Team
  • Clients
  • Form CRS
  • Contact Us

COVID vs. The Fed

June 26, 2020

Something we at IronBridge have been discussing over the past month has been an expectation that COVID cases would rise following Memorial Day and the opening up of the economy and society. This is now happening. In financial markets, increased risks around COVID are battling the liquidity tsunami from the Fed. Who will win?


“Those who have knowledge don’t predict. Those who predict don’t have knowledge.”
-Lao Tzu, 6th Century Chinese Poet

Once again, COVID numbers are spiking.

And it shouldn’t come as any surprise.

At our core, humans are social beings. We crave personal interactions, and have a deeply rooted need to be a part of an accepting and protective group. There are various ways people fill this need, through religion, political affiliations, or something far more important like football (we are in Texas after all).

Being isolated for extended periods of time can wreak havoc on a person’s psyche. So it is no surprise that after 3 months of isolation, people want to get out and experience the personal interactions we so crave.

But instead of being cautious, wearing masks and practicing social distancing, many people simply said “forget it”, and went back to life as normal. This combined with massive protests have led to a surge in cases, particularly in people ages 20-40.

So here we are, once again, seeing parts of the economy either slow or be shut down. Today, the state of Texas required bars to close following the recent surge, and it is prudent to anticipate that in the near future other businesses will be shut down as well.

Due to these potential shutdowns, today’s economic environment is as uncertain as any we have experienced in our careers. And likely as uncertain as anyone alive has ever experienced.

But as we have witnessed over the past few months, markets can be strong in the face of great economic uncertainty. There continues to be a huge disconnect between the markets and the real economy.

When there are disconnects like we have today, it is very difficult to predict the direction which will prevail. Will the economy catch-up to the markets? Will markets fall to be more in-line with economic realities? Or will the disconnect continue?

To understand the potential scenarios at play, we must first attempt to gain clarity on the driving forces in markets today. This exercise is a very easy one.

It is COVID versus the Fed.

In one corner, we have the potential damage that an unchecked or extended COVID outbreak could cause to society, the economy and the markets.

In the other corner, we have the Federal Reserve pumping trillions of dollars into financial markets globally.

For now, we simply must ignore the economic data. Why? Mainly because there has been no correlation between market movements and economic data. Why should there be? Markets are forward-looking and built on expectations. Economic data is backward-looking and reflect activity that has already happened. Economists are reliably incompetent, so in an environment where economic data is incredibly uncertain, it does not make sense to apply this to market analysis. Economic data will obviously matter again in the future, but it is a distraction right now.

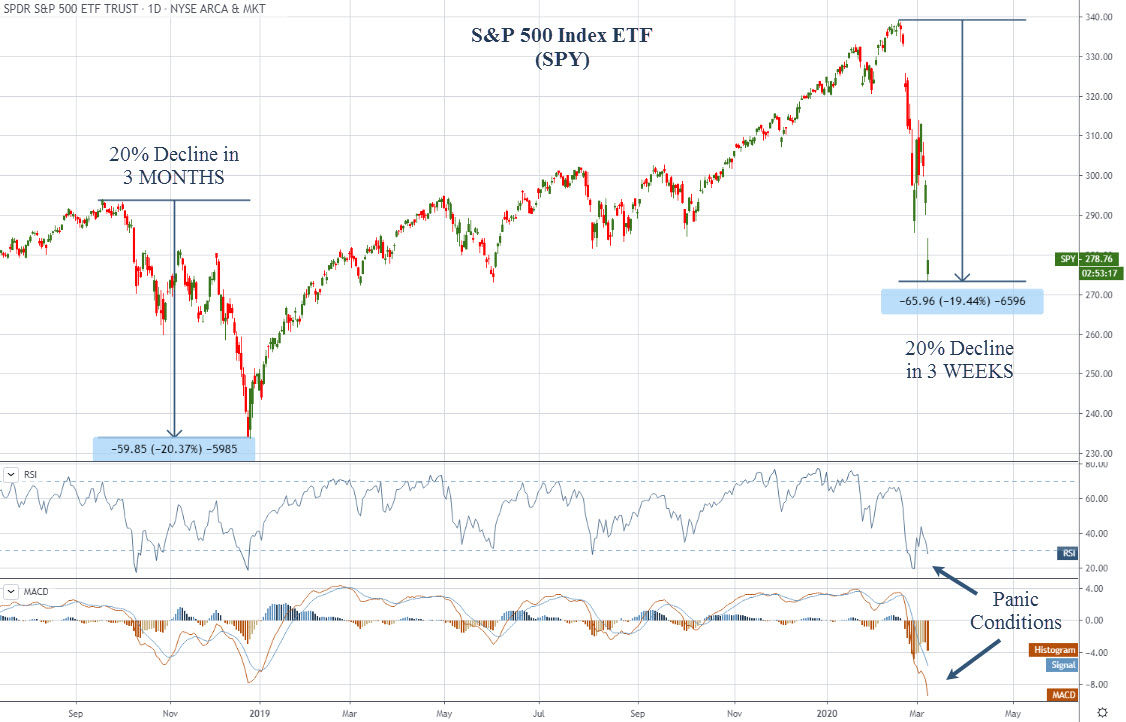
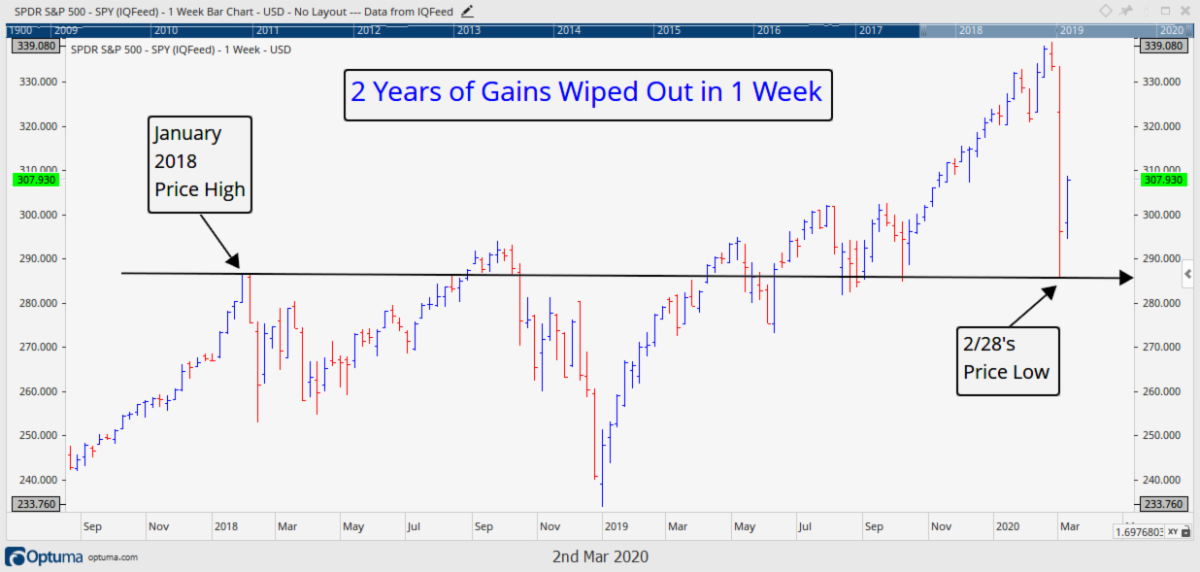
Before getting into the correlations between the stock market and both COVID and Fed data, let’s first look at the price of the S&P 500 Index this year.

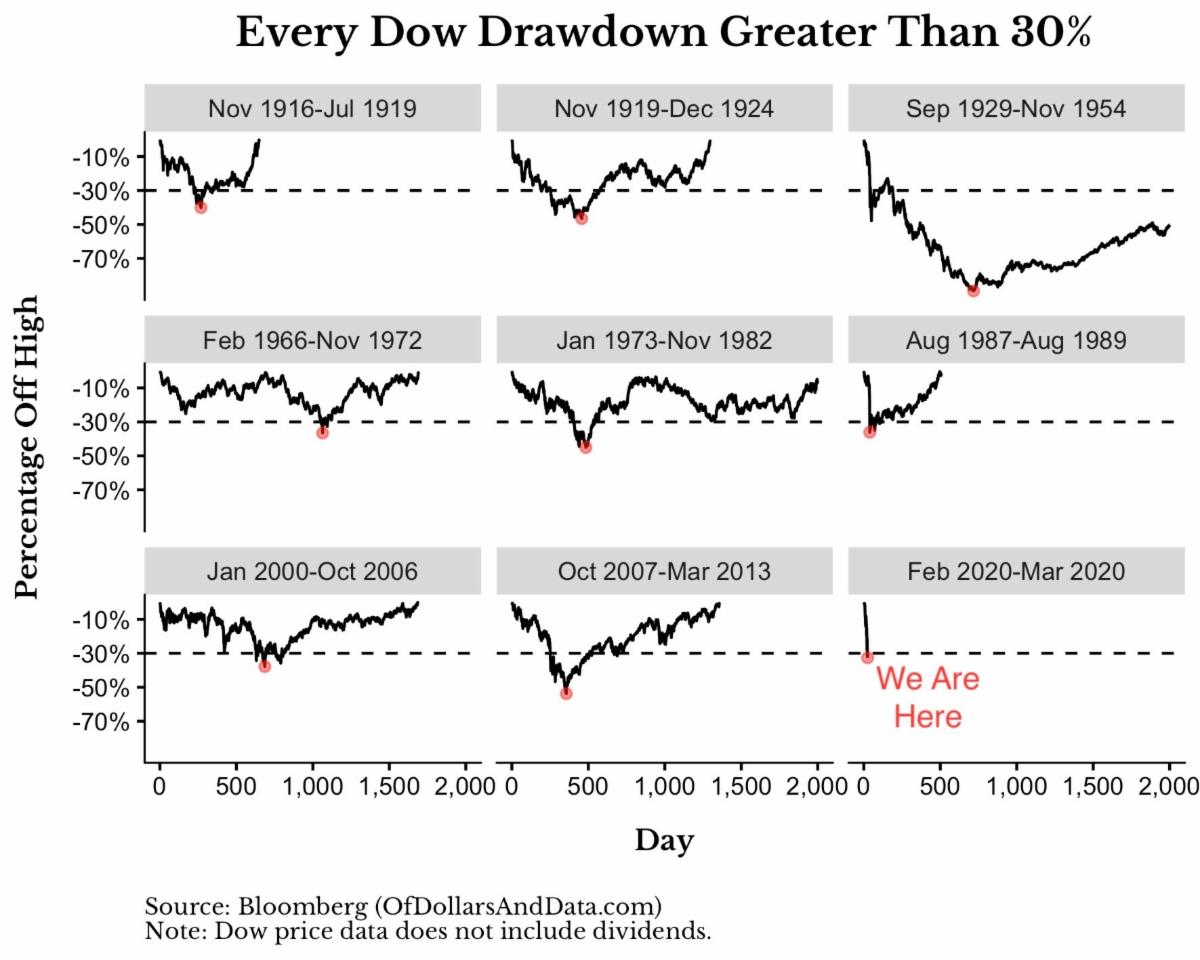
We are now in Round 3 of the heavyweight bout.

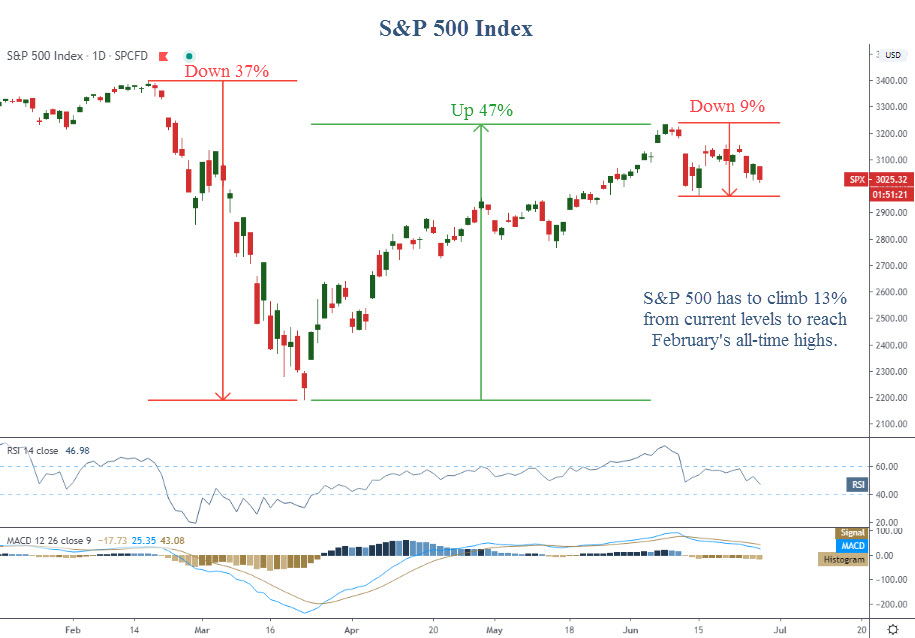
Round 1 was easily won by COVID. The uncertainties around the impact of the virus led to a market crash of 37% in just 6 weeks. Other areas fared much worse. Small caps were down 44% and some international markets were down over 50%.

But in Round 2, the Fed woke up. Following the March crash, we saw an eye-popping 47% rise between March and early June. That is a massive move, that more or less happened without much of a pause.

We are now in Round 3. COVID numbers have been rising, and markets have fallen 9% from recent highs.

But who is ultimately going to win…COVID or the Fed?

COVID versus the S&P 500

Let’s start with COVID.

The current bearish argument suggests that the rise in confirmed cases is causing market volatility. This may very well be the case, but let’s take a closer look.

The chart below from the COVID Tracking Project shows confirmed positive cases daily in the US, with a 7-day moving average in black. We have overlaid the S&P 500 index on top of this chart to give it some context. (We apologize that some of the S&P chart may be difficult to see. Click on the image to enlarge it.)

This shows a few interesting trends:

  • Daily confirmed cases didn’t begin to slow until two weeks after the market low.
  • Daily confirmed cases didn’t peak until almost a month after the low.
  • The steady decline in daily cases does appear to correlate with the push higher in markets in late May and early June.
  • The market began to fall before cases began to rise again.

Cases were steadily rising well after the market bottomed, and didn’t peak for nearly a month after the lows. Initially there was zero correlation between confirmed cases and stock prices.

However, things changed, and there was a decent correlation in May and early June when cases were falling and markets were rising. We could make that same argument over the past 3 weeks as well, as markets have moved lower as cases have once again risen.

If we looked at cumulative cases, instead of daily cases, there were roughly 200,000 total confirmed cases in the US at the market low in March. Today, we have nearly 2.5 million.

So an increase of 200,000 cases caused a 37% crash, but an increase of 2.3 million corresponded to a 47% increase in prices?

Bottom line, there must be a correlation. But the correlation is one of expectations around COVID cases, rather than actual reported cases.

This would make sense. If COVID statistics were unquestionable in their accuracy, we would have a much better sense of how markets actually correlated to the outbreak. But these statistics are suspect at best. Do we really believe the data from February and March? Testing was jokingly low at first, and is still under-reported in our opinion, although strides are being made in the right direction.

As is the case with many data points that are external to the markets, one can argue it both ways. On one hand, it’s difficult to conclude that an increase in cases won’t have any effect on prices. On the other hand, one cannot make a conclusion that a second wave will inevitably result in another market crash.

We must consider the Fed.

The Fed versus the S&P 500

As we referenced in our previous Insights publication, “Dispersion”, the Fed can and should take the credit for the huge rally off the lows. You can read this report HERE.

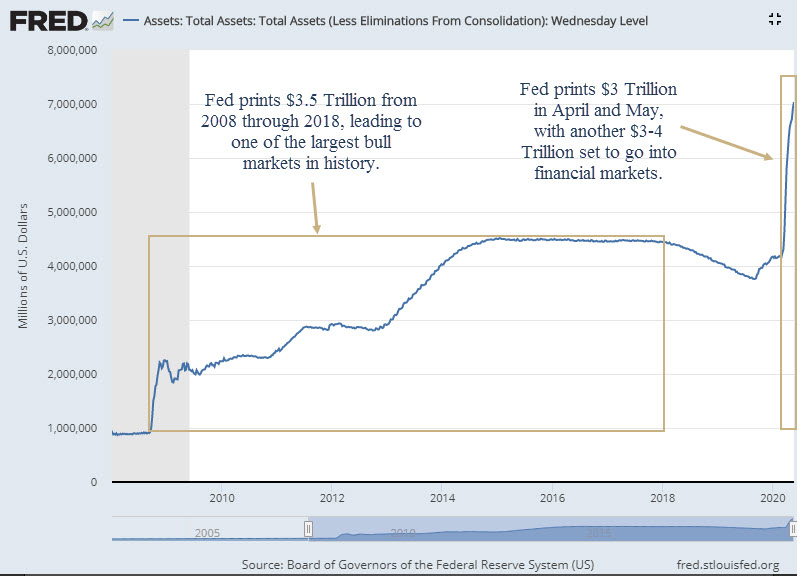
They have flooded the market with over $3 Trillion of liquidity. From the market lows, the Fed consistently added money to the financial system, directly resulting in a rising stock market.

But an interesting thing happened in early June…the Fed stopped printing.

Despite having announced that they would add over $6 Trillion into the markets, they paused at $3 Trillion. Maybe it was because they felt a 47% rise in markets was enough. Maybe they saw financial conditions easing and felt the prudent thing to do was to stop the madness. Maybe they needed to keep some dry powder in anticipation of a second wave outbreak.

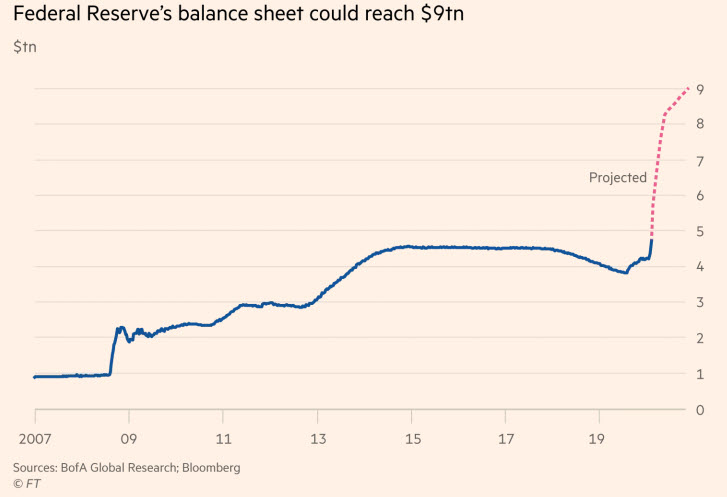
The next chart shows the Fed balance sheet versus the S&P this year.

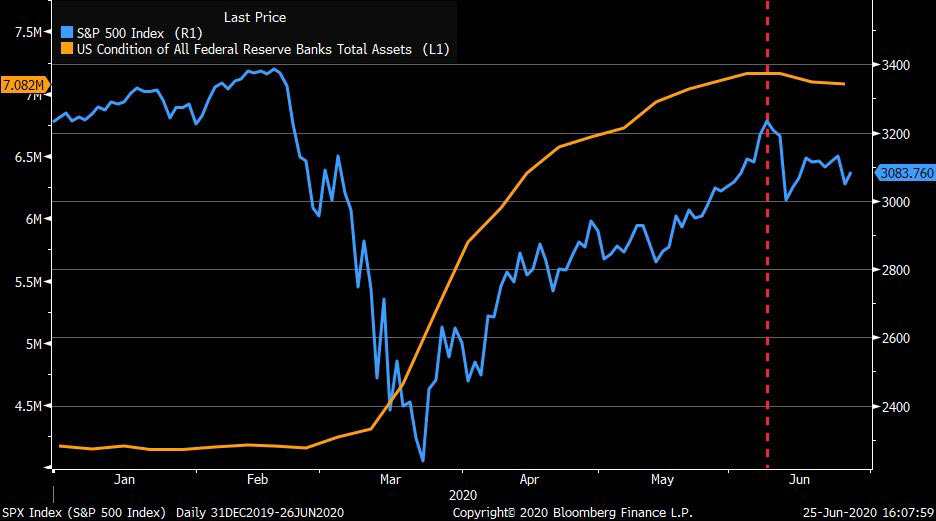
This shows an extremely clear correlation between the Fed and the stock market. Once the Fed started printing, stocks halted their decline and proceeded to explode higher. And when the Fed stopped printing, the market paused as well.

Regardless of the reasons behind the Fed’s actions, the result is crystal clear. The Fed has a direct impact on stocks. More than COVID, more than the economy, and more than corporate earnings.

So What Happens Next?

In our direct discussions with clients, and in our published reports, we consistently expected a large rebound when markets eventually bottomed. We have definitely seen that occur.

Client portfolios have been fully allocated for the most part of the past 3 months. And clients have benefited from a bullish environment that our signals identified.

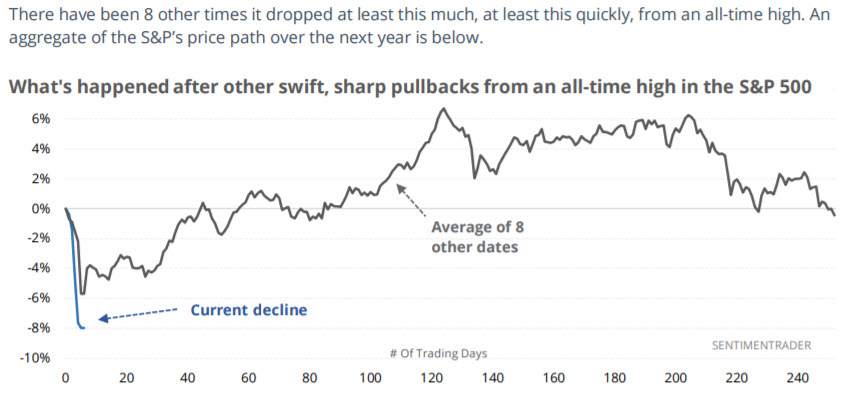
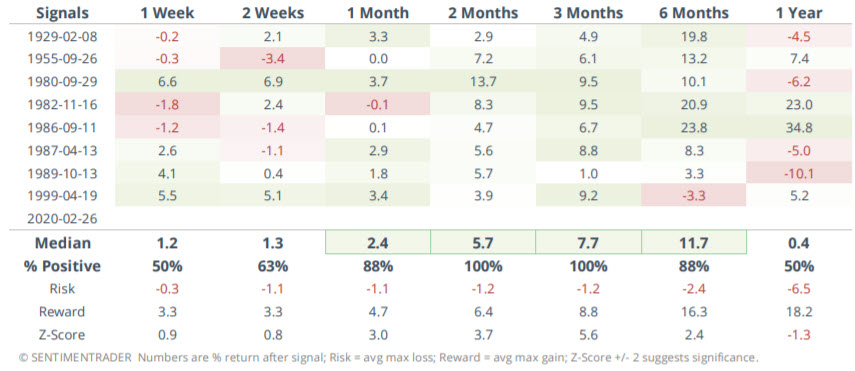
In the near-term, however, things are less clear. As uncertainty rises, it is natural for markets to become anxious. It is also very normal to see 8-12% pullbacks when things are normal, much less in the long, strange trip of 2020.

You never know when a small pullback will turn into something larger. March was a great example of that.

But to become too bearish following the recent rise in COVID cases does not appear to be the most prudent action.

Patience is the key. If you have cash, it can be prudently put to work, but let the market come to you. Don’t force exposure. Don’t chase stocks higher, but don’t wait too long either. Establish a process, and follow a predetermined plan.

On the flip side of it, patience is also key if your portfolio is invested. Don’t force your portfolio into cash with the expectation that things are going to fall apart. Establish risk management rules, and follow your plan.

We have been consistently raising stop losses in client portfolios in the event markets deteriorate once again. The market has rebounded tremendously, and we don’t want to give too much back.

However, a nearly 40% decline in markets is a major move lower. And major moves like that don’t tend to repeat very quickly. This is an unprecedented year, so we cannot ignore that possibility, but we should not expect it either.

In the short-run, what we should expect is slightly more volatility than we have seen in the past two months. However, we should not expect volatility to return to levels seen in March during the crash.

When the COVID outbreak began, uncertainty and panic were tangible. It was an ugly surprise, and no one knew quite how to handle it.

A second wave does not carry with it the same uncertainties. Yes, it may cause more death, and may cause continued economic hardship. These are awful things, and we’re living in difficult times. But the unknowns are fewer today than they were in March, and any market shocks should be much less painful than during the first wave outbreak.

So despite the COVID uncertainties, the elephant in the room remains the Fed. If chairman Powell unleashes the remaining $3 Trillion of liquidity, it will likely overwhelm markets once again.

In this heavyweight battle between the Fed and COVID, at least with regards to financial markets, we must give the edge to the Fed until proven otherwise.

Invest wisely!


Our clients have unique and meaningful goals.

We help clients achieve those goals through forward-thinking portfolios, principled advice, a deep understanding of financial markets, and an innovative fee structure.

Contact us for a Consultation.

Neither the information provided nor any opinion expressed constitutes a solicitation for the purchase or sale of any security. The investments and investment strategies identified herein may not be suitable for all investors. The appropriateness of a particular investment will depend upon an investor’s individual circumstances and objectives. *The information contained herein has been obtained from sources that are believed to be reliable. However, IronBridge does not independently verify the accuracy of this information and makes no representations as to its accuracy or completeness.  Disclaimer This presentation is for informational purposes only. All opinions and estimates constitute our judgment as of the date of this communication and are subject to change without notice. > Neither the information provided nor any opinion expressed constitutes a solicitation for the purchase or sale of any security. The investments and investment strategies identified herein may not be suitable for all investors. The appropriateness of a particular investment will depend upon an investor’s individual circumstances and objectives. *The information contained herein has been obtained from sources that are believed to be reliable. However, IronBridge does not independently verify the accuracy of this information and makes no representations as to its accuracy or completeness.

Filed Under: IronBridge Insights

Dispersion

May 29, 2020

A theme has developed over the past month that likely has a great deal of importance to investing over the next few years. It is called “dispersion.” We have seen financial markets disconnect from the real economy, and assets within markets are showing massive differences in performance. What does this mean and how can you take advantage of it?


“To lend to a bank, we simply use the computer to mark up the size of the account.”

-Ben Bernanke, 2009


It has been a month since our last Insights newsletter, and excluding the last few days, market prices have not changed very much. The market tornado from late February to mid-April all of a sudden became calm and somewhat pleasant weather over the past month or so.

There has, however, been a major theme develop over the past month. This is one of dispersion.

When we refer to “dispersion”, we are referring to an increased difference between various parts of the financial markets, as well as a growing difference between financial markets and the real economy. Let’s explore both.

Stock Prices vs the Real Economy

Let’s first focus on the dispersion between stock prices and the economy. This is the most notable characteristic of the current environment, and to many the most confusing.

Since late March, there has been a massive disconnect between asset prices and the real economy. Unemployment and GDP numbers will be shockingly bad this quarter. We have already seen more than 20 million people file for unemployment in the past month.

Yet, markets continue to be stubbornly and somewhat surprisingly strong.

Why?

The answer is simple…the Fed.

For the 10 years following the 2008 financial crisis, the Fed printed almost $4 Trillion that made its way into financial markets. This liquidity led to one of the largest and longest bull markets in history.

The Fed has printed another $3 Trillion…since April.

And the Fed is not done yet. They have announced an ADDITIONAL $3 Trillion that is scheduled to make its way into the markets over the next few months. This also doesn’t include the $3 Trillion that Congress authorized in various stimulus packages.

Money “printed” by the Fed and forced into the financial markets can be tracked by the Fed Balance Sheet, which is shown on the chart below.

Again, the explosion higher in the balance sheet at the far right side of the chart could expand an additional $3-4 Trillion very soon.

The speed of the Fed’s action has been breathtaking. Never before in history have we seen such an explosion higher in liquidity coming from Washington, D.C.

There were two previous times anything remotely like this happened before:

  1. In 2009, when the Fed printed over $1 Trillion, kicking-off the massive 11-year bull market.
  2. In 2013, when the Fed began QE3 and printed $1.5 Trillion when it looked like the economy was about to move back into a recession.

Both of these previous actions were very good for stocks, and resulted in the S&P 500 doubling after 2009, and rising over 50% between 2012-2014.

Short-term, it appears that the Fed’s actions will have positive effects on the markets, but it also raises more questions…

  • How does the Fed print this kind of money?
  • This can’t be good long-term. How does this all end?

How Does the Fed Print Money?

When the Fed “prints” money, is simply does so in a digital way. Imagine if you could go into your online banking portal and add a zero to the end of your balance. That is all that is happening. The Fed “prints” by digitally manipulating account balances.

There are two interviews that explain this process.

The first is Ben Bernanke on 60 minutes in 2009, as they were beginning the massive expansion of the balance sheet. He explains this very simple digital “mark-up” of accounts that commercial banks have at the Federal Reserve. Watch the snippet HERE, and the full interview HERE. This interview was aired on March 15, 2009. The end of the bear market was March 6, 2009. Coincidence?

The second interview is from earlier this month, also with 60 minutes. This time with current Fed chairman Jerome Powell. It is worth the 13 minutes to watch the full interview. View it HERE. He discusses the printing mechanism around minute 6 of the video.

These interviews are both interesting and disturbing. Surely this can’t be good over the long-term, right? We’ll touch on that below.

Let’s just try to get it into context. Numbers this large are simply hard to imagine. What does $1 Trillion even look like?

Below, you get an idea. This illustration, courtesy of Reddit, shows just how massive $1 Trillion really is.

Yes, that’s a guy standing at the corner in the red circle. These are $100 dollar bills, cover almost the entire size of a football field, stacked two pallets tall.

Ok, so this visual didn’t help much. (Frankly, the $1 Million and $100 Million look way too small, but what do we know.)

Thinking about it in a different way, the size of the US economy is just over $20 Trillion. This represents the total economic output over the course of an entire year. Every car sold, every Netflix subscription bought, every burger and fries consumed…everything.

And in the span of a few short months, there will be over $9 Trillion of stimulus making its way into the markets and economy. Mostly into the markets.

After the Fed adds its zeros, it then buys various assets in the financial markets. Right now, it is buying US Treasury bonds and five different bond ETFs. It has also expanded its buying to include certain corporate bonds, including those classified as “junk”.

Once these bonds are purchased, the sellers (companies such as Citadel and Blackrock), then use the proceeds to put these funds into the stock market. This creates demand, albeit artificial, for stocks. Stocks move higher by having more buyers than sellers. So stocks then move higher, despite the crushing activity in the real economy.

When viewed this way, it’s hard to imagine how the Fed would NOT have an impact on markets. The size of this round of printing is simply overwhelming the markets. And that is their entire goal.

It is also easy to understand why we have the disconnect between stocks and the economy. Liquidity is propping up markets, while the real economy is largely unaffected by the Fed’s actions.

We simply cannot ignore the Fed, whether we agree with what they are doing or not.

How Does This All End?

At some point, markets will not respond favorably to the Fed’s actions. At some point, there will be a price to pay for all this craziness.

Will that be now? Maybe, but doubtful. It seems that the Fed still has not run out of ammunition.

In fact, we would not be surprised that the next step in the Fed’s arsenal is to begin the direct purchase of stocks. There is already discussion of this on Capital Hill, and other countries such as Switzerland and Japan already are doing this exact thing. It should not come as a surprise if the Fed starts to do it next.

What the ultimate end game looks like, no one knows. Frankly, the history around previous debt cycles is too lengthy to cover here. Unfortunately, these cycles of massive debt expansion usually end in war. (Thanks for ending the week on a happy note, guys.)

Back to the investment impact of all of this money printing.

Of all the data points to consider in the current environment, the Fed is by far the most important. It is no surprise that the massive injection of liquidity coincided with a strong rebound in stocks.

And the Fed is only halfway done.

We discussed how massive printing helped stocks in previous years. If you’ve watched the stock market over the past two months, you probably noticed that the markets think it will be effective this time around as well. The S&P 500 is up 35% from the late March lows, and still has another 12% to go to make it back to where it was in February before all of this chaos began.

Many people are wondering if this is just a bear market rally. In other words, many investors are expecting prices to fall below the levels seen in March, and are betting that the recent spike in prices will be completely reversed.

We are not ruling that out, but if it happened, it would be the single largest bear market bounce in history.

The chart below, from Ryan Detrick with LPL Financial, shows the largest percentage gains during bear markets.

The decline from February to March was the fastest 30%+ decline in history, so maybe we will see history once again with the largest bounce in a bear market ever? Again, we are not ruling that out, but at this point it has to be viewed as a very low probability scenario.

This suggests that the market is not going to retest the lows from March. Furthermore, it suggests that we should expect new highs this year, possibly as soon as this summer.

Which leads to the next logical question…what should we do now?

Dispersion in Financial Markets

Before getting into what actions we are taking, let’s revisit what kind of shape we might see in a potential recovery. As we discussed in previous newsletter “Dare We Look at Earnings” HERE, would it be a “V”, a “W”, a “U” or an “L”?

We are starting to get our answer. And the answer is “Yes”.

Some areas of the market and economy are recovering very quickly, and are taking the “V” shape, while others are not nearly as strong. Unlike previous bear markets, where everything gets hit hard and recovers simultaneously, today’s market is showing a great divide between the winners and the losers.

Frankly, we at IronBridge are very excited about this development. This means active management can shine.

Let’s take a look at a few sectors to notice the massive dispersion between them. The first chart below shows the “V”-shaped recoveries in technology, healthcare and consumer stocks. It is very easy to see the V in these areas.

Other areas of the market have not been nearly as strong.

Energy, financials and industrials have all struggled to make any real progress higher. They are taking the shape of a “W”, or potentially even an “L” or “U”. It is yet to be determined, as shown below.

These are the perfect examples of dispersion. If you owned the three in the first chart, and didn’t own the three in the bottom chart, you experienced out-performance.

This is exactly what our investment process was created to recognize and take advantage of.

Our clients have been heavily exposed to investments in the outperforming sectors in top chart, and have had little to no exposure to the ones in the bottom.

It’s not too late either. Cash on the sidelines can be put to work at these levels, albeit in a prudent and disciplined way. Higher prices are likely ahead, but we still need to watch for a second COVID wave and potential market weakness. However, as we said, that seems like the lower likelihood right now.

Bottom line, dispersion favors active management over passive management. It can be a very good time to invest, if you have the right methodology.

We believe this dispersion is a paradigm shift that may continue for years into the future. Not only will we likely see continued dispersion between sectors, but we will also see dispersion in broader asset classes as well.

The successful portfolio in the coming years will have the ability to recognize leadership changes in the markets. At some point, technology and healthcare will start to lag and energy and financials will excel.

A disciplined process can recognize both dispersion and change in leadership. That combined with strong risk management is a recipe for success in any environment.

Invest wisely!


Our clients have unique and meaningful goals.

We help clients achieve those goals through forward-thinking portfolios, principled advice, a deep understanding of financial markets, and an innovative fee structure.

Contact us for a Consultation.

Neither the information provided nor any opinion expressed constitutes a solicitation for the purchase or sale of any security. The investments and investment strategies identified herein may not be suitable for all investors. The appropriateness of a particular investment will depend upon an investor’s individual circumstances and objectives. *The information contained herein has been obtained from sources that are believed to be reliable. However, IronBridge does not independently verify the accuracy of this information and makes no representations as to its accuracy or completeness.  Disclaimer This presentation is for informational purposes only. All opinions and estimates constitute our judgment as of the date of this communication and are subject to change without notice. > Neither the information provided nor any opinion expressed constitutes a solicitation for the purchase or sale of any security. The investments and investment strategies identified herein may not be suitable for all investors. The appropriateness of a particular investment will depend upon an investor’s individual circumstances and objectives. *The information contained herein has been obtained from sources that are believed to be reliable. However, IronBridge does not independently verify the accuracy of this information and makes no representations as to its accuracy or completeness.

Filed Under: IronBridge Insights

Making Sense of the CARES Act

April 17, 2020

The CARES Act provides an estimated $2 trillion in fiscal stimulus to combat the economic impact of COVID-19 and provides the healthcare industry the financial support, equipment and protection it needs to help combat the virus.


“The purpose of government is to enable the people of a nation to live in safety and happiness.”

-Thomas Jefferson


On Friday, March 30th, the US Congress passed the “Coronavirus Aid, Relief and Economic Security Act”, or the “CARES Act”.

The $2 Trillion stimulus package has many aspects to it. (If you’d like to read the entire 335-page bill, you can read it HERE.)

But just in case you don’t have the time or inclination to read through 335 pages of congressional drivel, we have sifted through it for you. Below, we have prepared an overview of the important features that may apply to your individual situation. This includes items relating to your retirement accounts, stimulus payments for individuals, small business support and charitable giving.

$2 Trillion is a lot of money. Where will it go?

The illustration below shows how the $2 Trillion is allocated across various types of potential beneficiaries.This is an ambitious bill to say the least. It is relatively equally split between individuals, big corporations, small businesses and local governments.

For our purposes, we’ll focus on the important aspects relating to individuals and small businesses.

The two aspects of the bill that have received the most news coverage are the direct payments to taxpayers and the Paycheck Protection Program for small businesses.

But there are many additional provisions that may impact our clients and their families.

Retirement Plan Provisions
  • Required Minimum Distributions (RMDs) are waived in 2020 for qualified account holders including inherited or beneficiary-qualified accounts.
  • Loans from Qualified Plans – Up to 100% of the vested account balance up to $100,000 may be borrowed from an employer sponsored retirement plan during the 180-day period beginning on the date of enactment. In addition, current loans are given an extra year for repayment.
  • A penalty free coronavirus-related distribution of up to $100,000 can be made from IRAs, employer-sponsored retirement plans or a mix of both for individuals impacted by COVID-19. The amount will still be income taxable but for individuals under age 59.5, there will be no 10% penalty. There are many qualifying events beyond being diagnosed with COVID-19 including lay-offs, reduced work hours, lack of childcare, and more. Income taxes may be spread over three years.
  • Pension plan sponsors are permitted to delay 2020 plan contributions until January 1, 2021 at which time the contributions will be due with interest accrued at the plan’s effective rate.
Individual Payments and Unemployment
  • Most individuals earning less than $75,000 will receive a one-time cash payment of $1,200. Married couples receive two checks, plus $500 per child.
  • Self-employed people are allowed to apply for unemployment through the Pandemic Unemployment Assistance program.
  • Employers are permitted to provide up to $5,250 in tax-free student loan repayment benefits. This money will not be considered income for the workers that receive support.
  • The Federal Government will add $600 to every unemployment check and coverage is now expanded to independent contractors and the self-employed.
  • The CARES Act will waive the one-week elimination period to begin benefits, and it extends the length of time an individual may receive benefits for an additional 13 weeks beyond the state maximum.
Business Stabilization
  • Paycheck Protection Program (suspended) – As of April 16, this program has run out of funding but essentially it authorizes up to $349 billion in forgivable loans to small businesses to pay employees. The loans are forgiven as long as the proceeds are used to cover payroll costs, mortgage interest, rent, and utility costs over the 8 week period after the loan is made. There is an expectation that more funds will be approved by Congress, but nothing has been passed yet. More details can be found on the Treasury’s website.
  • Employee Retention Credits – This is a fully refundable tax credit (can exceed tax liability) for employers equal to 50% of qualified wages that Eligible Employers pay their employees. This credit applies to wages paid after March 12, 2020 and before January 1, 2021. The maximum amount of qualified wages taken into account for each employee is $10,000, so the maximum credit for an Eligible Employer for qualified wages paid to any employee is $5,000. If a business qualifies for and receives a Paycheck Protection Program loan, they do not qualify for the employee retention tax credits. Additional details can be found HERE.
  • Disaster Loans – Funded through the SBA disaster loan program, it includes a $10,000 loan advance that does not need to be repaid. It is intended for any eligible small business with fewer than 500 employees.
Charitable Contribution Changes
  • The CARES Act allows cash charitable contributions made in 2020 to be deducted up to 100% of adjusted gross income (AGI). Prior to the change, a taxpayer could only deduct up to 60% of AGI for cash contributions. Excess contributions can still be carried over for five years.
  • The act allows taxpayers who cannot itemize deductions a new ‘above-the-line’ deduction. The maximum amount is $300, and the contributions must be made in cash. There is no stated expiration of this provision in the Act.

If you would like to discuss specifics on whether these may apply to you, please do not hesitate to reach out. And as always, consult your tax advisor on how your specific situation may be impacted as well.


 Our clients have unique and meaningful goals.

We help clients achieve those goals through forward-thinking portfolios, principled advice, a deep understanding of financial markets, and an innovative fee structure.

Contact us for a Consultation.

Neither the information provided nor any opinion expressed constitutes a solicitation for the purchase or sale of any security. The investments and investment strategies identified herein may not be suitable for all investors. The appropriateness of a particular investment will depend upon an investor’s individual circumstances and objectives. *The information contained herein has been obtained from sources that are believed to be reliable. However, IronBridge does not independently verify the accuracy of this information and makes no representations as to its accuracy or completeness.  Disclaimer This presentation is for informational purposes only. All opinions and estimates constitute our judgment as of the date of this communication and are subject to change without notice. > Neither the information provided nor any opinion expressed constitutes a solicitation for the purchase or sale of any security. The investments and investment strategies identified herein may not be suitable for all investors. The appropriateness of a particular investment will depend upon an investor’s individual circumstances and objectives. *The information contained herein has been obtained from sources that are believed to be reliable. However, IronBridge does not independently verify the accuracy of this information and makes no representations as to its accuracy or completeness.

Filed Under: IronBridge Insights

Expectations vs Reality

April 9, 2020

In our previous report, we discussed how earnings for the next two quarters are likely to be some of the worst numbers in history. Does that mean markets will fall in response? Not necessarily. For it’s not the actual economic numbers that matter…it’s how the actual numbers differ from their expectations that truly drive prices.

Plus, we identify three potential scenarios that could unfold over the coming months.


“Suffering has been stronger than all other teaching, and has taught me to understand what your heart used to be. I have been bent and broken, but – I hope – into a better shape.”

-Eleanor Roosevelt


The impact of the COVID-19 virus continues to effect us all. Our thoughts and prayers go out to those who are suffering from health conditions, financial hardships or simply from loneliness. May blessing be with you all.

In our last issue of Insights, “Dare we Look at Earnings?”, we tried to take an early look at the potential impact that the unprecedented shut-down is having on company earnings. Bottom line, as one would guess, earnings are likely to be horrific.

Should we then assume that markets will also be horrific when these earnings are announced?

Not necessarily.

Markets do not move on economic results alone. Data points, whether corporate earnings, unemployment claims, or COVID-19 statistics, do not necessarily move markets by themselves. Rather, it is much more important to understand how the ACTUAL data differs from the EXPECTED data. This is what moves markets.

Case in point…last Thursday saw a staggering 6.6 million people file for initial unemployment claims. And the week before over 3 million people filed. This morning, another 6.6 million people filed again. Combined there were nearly 17 million people who filed for unemployment in the past 3 weeks.

These numbers, as shown on the chart below, are literally off the charts.

It is almost as if this chart was made by an entry-level statistician that made some sort of awful mistake.

This chart goes back to 1970. Look at the recessions in the early 1980’s, and especially in 2008. The highest number of weekly claims during the financial crisis was just over 600,000 people. Today’s data doesn’t even seem real in comparison.

What do you think the market would do in the face of such negative data? One would assume that the market fell at least 10%.

Last week when the first 6.6 million figure was announced, the market went up over 2%. Today, another 6.6 million unemployment figure was announced and the market rallied 1.5%.

This also doesn’t seem real to many people. How possibly could markets rise in the face of such terrible news? Are these market participants just evil psychopaths? How could prices seem so disconnected from reality?

Look at the chart below. This is the chart of S&P futures on April 3, 2020, when the unemployment claims number came out. The moment the data was announced, markets began to rally.

The market rallied because it was expected. The actual numbers were unknown, but people knew it was going to be absolutely terrible. And they were.

The other factor is that as data is announced, one tiny bit of uncertainty is removed. Two weeks ago the market had absolutely no idea how our shelter-in-place would effect the economy. We are now starting to see the effects. While they are bad, it now at least becomes KNOWN. One of the biggest components of fear is the fear of the unknown. And when that fear is removed, markets can become constructive once again.

The next logical question is: What is the market expecting?

Markets are incredibly complex systems. Billions of shares change hands every day through hundreds of millions of transactions. We’ve said many times that to claim to know what will happen with any certainty is foolish.

But we can take our best guess at what the market is expecting based on data and estimates that are widely known or talked about. Let’s go through the list:

Near-Term Expectations:

  • Well publicized reports by JPMorgan and Goldman Sachs project GDP for the 2nd quarter to decline somewhere around 30%. To put this in context, GDP fell 4.3% during the 2007-2009 financial crisis. Not 43%, but 4-point-3-percent. GDP fell 25% in the great depression. The magnitude of this is hard to fathom.
  • COVID-19 cases are expected to skyrocket. Deaths in the US are estimated to be between 200,000 and 500,000 by the time this is done, which puts the number of people infected between 15-30 million.
  • Earnings are expected to be horrible. Some people are projecting earnings to be negative for the entire S&P 500.
  • Volatility is expected to continue to be extreme.
  • Unemployment is expected to be somewhere between 10-15%. It peaked at 10% during the financial crisis.

Aye yi yi…where’s that margarita?

With all this bad news and uncertainty, what will happen next?

We don’t know what will happen, but let’s look at three possible scenarios that make the most sense to us so we can prepare for different outcomes.


Three Possible Market Scenarios: Bullish, Neutral and Bearish

Scenario #1: The Worst is Over (Bullish)

By the worst is over, we mean that we’ve seen the lows in the stock market for this awful period of time. We fully expect the number of infections and deaths to rise dramatically. And we expect the economic numbers will also deteriorate over the coming weeks.

This does not mean that stocks can’t go up.

Ultimately, this scenario relies on two things: science and liquidity.

The first catalyst for an optimistic resolution is via medical science.

There are countless companies and individuals searching for a cure or some way to help reduce the lethal effects of COVID-19. The last time there was this much focus on one goal was in the manufacturing sector during WWII. This solution is worth billions of dollars to whomever produces it (at least). The person or team who finds it will be rewarded handsomely, and will most certainly be declared a global hero.

The last time a global pandemic struck the globe was the Spanish Flu of 1918. There may be some similarities, but the primary difference is that medical treatments have advanced dramatically over the past 100+ years. Life expectancy in 1900 was roughly 48 years old for men and 50 years old for women, according to the book “A Profile of Death and Dying in America”. Today, life expectancy is pushing 80 years old.

How people are dying is also changing dramatically. The next chart looks at the leading causes of death in the US over the past 120 years.

In 1900, most deaths were attributable to the flu, pneumonia, tuberculosis and diarrhea. Most of these caused some sort of infection that could not be controlled, and the person lost his or her life.

Today, medical science has virtually eliminated these causes of death. If we can get a medical breakthrough against COVID-19, we could easily see a very strong rebound in both the economy and the markets.

The second catalyst that could help the bullish case is liquidity. By liquidity, we mean money being printed by the government and central banks.

Last week Congress passed a $2 Trillion disaster bill to help individuals and businesses get through this period of time. At the same time, the US Federal Reserve announced they would print $4 Trillion and flood the markets with this artificial capital.

And just this morning, and additional $2.5 Trillion of stimulus was announced by the Fed.

These numbers are stunning. The chart below shows the historical Fed balance sheet since 2007, and the projected balance sheet through the end of 2021.

Over the past two weeks there has been over $8 Trillion dollars in stimulus announced that is scheduled to get into the economy and the markets within the next few months.

To put this is context, over the entire 10 years following the ’08 financial crisis, the Fed printed a total of $4.5 Trillion. This liquidity made its way into the financial markets and helped produce one of the largest and longest bull markets in history.

Maybe this is finally the time when the Fed loses its ability to increase market prices (similar to what happened in Japan over the past 3 decades). But if now is not the time, this could be a tremendous tailwind to asset prices over the coming years.

This injection of liquidity could very well be the secret weapon that allows the market to recover relatively quickly, even in the absence of a medical breakthrough or a fast economic recovery. And this market recovery could occur while the real economy remains in shambles.

Scenario #2: The Worst is Over, but the Recovery is Delayed (Neutral)

This scenario is based on the economy recovering, but not as strongly as we all hope. This is the “U” or “W” scenario we discussed in our previous report.

This scenario seems very logical to us.

The economy will start to loosen up. We will go back to socializing in restaurants, and spending time in public places. We will go back to work and school.

But we could be a bit tentative. Maybe we don’t go out quite as much as we used to. Maybe the virus makes a comeback because we let our guard down. Or maybe most of us are still practicing a modified form of the current “social distancing” that results in slower economic activity.

In this scenario the economy improves, but instead of it happening in May or June, it is pushed out until later summer or early fall. Businesses that were forced to shut down don’t reopen. People who had jobs before don’t have them after. People remain cautious about large gatherings, travel and other activities.

This would result in a stubbornly high unemployment rate. Consumer spending would be weaker. Government stimulus certainly has a limit, although the election year could push politicians to extend things out further than would normally happen.

From a market perspective, we would likely see large swings higher and lower, but no real progress either way. Somewhat like the hypothetical chart below.

This obviously is a complete guess, but this type of pattern does tend to occur late in investment cycles. This would be an environment full of starts and stops that would certainly take its toll on investors. Good economic and COVID developments would be followed by bad developments. As soon as it appears we are in the clear, something negative happens, and vice-versa.

Ultimately the economy would recover and markets would resume moving higher, but it would take longer than we hope.

Scenario #3: Depression (Bearish)

Frankly, we don’t even like thinking about this scenario. But we must consider it and be prepared for it if it happens.

This suggests we are only in the early innings of the damage. In this scenario, there is no medical breakthrough, efforts such as shelter-in-place fail to contain the spread of the virus, patients who recovered get infected again, and the economic damage is deeper and lasts longer than anyone expects.

If this were to begin to become reality, it would likely start with a strong move lower that is equal to or greater than the large drop we saw from February to March. Ultimately, this scenario would result in a market that declines somewhere between 50-75% from its peak.

As uncomfortable as this scenario is, unfortunately it is still a possibility.

However, one of the main things that puts this scenario as a very low likelihood is the $8 Trillion of liquidity getting pumped into the markets and economy. This alone reduces the probability dramatically, where we should not expect that to be the likely outcome. However, we would be foolish to ignore this possibility.

Conclusion

In summary, as the news gets reported on the virus and the economy, remember that it is not just the news itself that drives the markets. It is the expectations of what reality may be that is the true driver of prices.

Bottom line, we need to remain unemotional about the future direction of the markets, and open to different potential outcomes. It is incredibly important during uncertain times like these to have a disciplined, rules-based approach to portfolio management that can adjust to changing circumstances without having to guess what will happen next.

Invest wisely!


 Our clients have unique and meaningful goals.

We help clients achieve those goals through forward-thinking portfolios, principled advice, a deep understanding of financial markets, and an innovative fee structure.

Contact us for a Consultation.

Neither the information provided nor any opinion expressed constitutes a solicitation for the purchase or sale of any security. The investments and investment strategies identified herein may not be suitable for all investors. The appropriateness of a particular investment will depend upon an investor’s individual circumstances and objectives. *The information contained herein has been obtained from sources that are believed to be reliable. However, IronBridge does not independently verify the accuracy of this information and makes no representations as to its accuracy or completeness.  Disclaimer This presentation is for informational purposes only. All opinions and estimates constitute our judgment as of the date of this communication and are subject to change without notice. > Neither the information provided nor any opinion expressed constitutes a solicitation for the purchase or sale of any security. The investments and investment strategies identified herein may not be suitable for all investors. The appropriateness of a particular investment will depend upon an investor’s individual circumstances and objectives. *The information contained herein has been obtained from sources that are believed to be reliable. However, IronBridge does not independently verify the accuracy of this information and makes no representations as to its accuracy or completeness.

Filed Under: IronBridge Insights

Dare We Look at Earnings?

March 27, 2020

NOTE TO CLIENTS

All of us at IronBridge are working from home over the coming weeks during Austin’s shelter-in-place order. Fortunately, we have had remote work capabilities for years. We will continue to serve your needs in an uninterrupted manner with access to our full suite of resources as if we were in the office.

The primary difference is the possibility probability of screaming kids or barking dogs in the background.


Earnings season for Q1 begins late next week. Needless to say, they will be bad. But even in the midst of the corona-chaos, it ultimately is a game of expectations versus reality. Let’s take look at some of the preliminary estimates so we can be prepared for what may come. We also look at previous 30% declines, and discuss the possible shapes the eventual and inevitable recovery may take.


“When you look fear in the face, you are able to say to yourself, ‘I lived through this horror. I can take the next thing that comes along.'”

-Eleanor Roosevelt


No doubt we have all been affected by the Covid-19 Pandemic. As we draft this newsletter, for instance, we are doing it from our respective homes. Where we live, in Austin, Texas, feels like a ghost town. We imagine your town feels similarly (and somewhat eerily) quiet. Entire parking lots are empty when they were typically packed, and we think it is safe to say for many, business is not as usual.

However, technology today is truly showing its positives and allowing many businesses, like ours, to continue rather seamlessly, able to provide services to our clients, even with these extreme circumstances. Once beyond the obvious logistical challenges everyone is facing, for many businesses, like ours, business actually is continuing in a lot of ways as usual.

There are clearly going to be winning and losing businesses that result out of all of this, with many already popping up in one camp or another. Some, like the airlines, are certainly at risk, as their entire industry is facing their biggest challenge ever. Are we going to see nationalized airlines again? How long until international travel will return to levels recently seen? What about domestic travel? Other industries, like streaming video providers and home delivery companies, are likely to have their best quarters ever. Certain companies have benefited greatly from the shift from co-located to isolated work environments.

Previous 30% Declines

Over the past month we issued multiple reports highlighting how unprecedented the decline in the equity markets has been, and we can now add one more to the record books. What we just witnessed was the fastest decline of over 30% ever in the modern history of America’s stock markets.

The chart below shows this comparison of all the past 30% declines. For this reason, some are now comparing the current decline to the roaring 20s that resulted in the great crash of 1929, morphing into the great depression. From a purely market history perspective the current decline does look a lot like that initial move lower in 1929. If not 1929, then the 1987 crash. These three periods are on the right side of the graphic below and they clearly stand out as different from the other 30% drawdowns. The other periods took their time to get to the 30% mark. 1929, 1987, and 2020, the three most notable market crashes in history, each had remarkable speed in their declines.

Uncertainty reigns supreme. Individuals are digesting just how swiftly everything has changed. Governments are dealing with new threats. Businesses are dealing with the new norm, specifically how to quantify the impact of Covid-19, and that may be the biggest change as far as the markets are concerned. The uncertainty that still exists is apparent in all aspects of life here in America and across the world.

What similar time period should we use as the appropriate analog? Is it the roaring 20s that turned into the Great Depression that had a similarly rosy economic backdrop that then turned greatly negative? Or, is it 1987, a crash that occurred in the midst of a bull market and rather strong economy (there was no recession in the late 80’s).

The financial crisis had a debt and leverage catalyst that took 1.5 years to threaten the solvency of the world’s banks, so that doesn’t seem analogous to today. Case in point, we just witnessed over 50% of the entire financial crisis’s declines in just 5 weeks, so this seems much different. Perhaps now is not like any prior time period, which is just another peg on the massive uncertainty board we are currently looking at.

This uncertainty that surrounds the next few months is unprecedented, and until we start to get some certainty about the future we should expect the recent volatility (both up and down) to continue.

Dare we Look at Earnings?

How uncertain is the world about the future? So uncertain that many companies have stopped providing earnings guidance and hardly any have come out with an estimate of lowered guidance for the 1st quarter or the rest of the year. They just don’t know how bad it is going to affect their companies yet, and with one week left before we kick off Q1 earnings, we are about to clear up a little of that uncertainty.

Earnings will ultimately be the tell of whether or not we truly are entering another recession, or, are we actually on the cusp of an economic depression (hopefully not)? Earnings results in the first quarter and full year expectations will be a big tell as to how bad this thing may get.

Earnings forecasts for the S&P 500 are generally derived two ways.

  1. Bottom-up. This method begins at the individual company level, and the sum of earnings for each company is used to predict the overall earnings of the S&P 500 itself. At this point there are very few companies providing updated guidance for the 1st quarter (or the rest of the year for that matter), so all we have is their original forecast’s from the first 6 weeks of 2020. No doubt these will be drastically changing over the coming weeks.
  2. Top-down. This occurs when an analyst looks at historical earnings of the S&P 500 and then adjusts them up or down based on macro and other factors.

Let’s look at both of these earnings estimates.

The first chart below shows just how quiet companies have been in adjusting their 1Q earnings estimates in light of the Corona Virus. Most companies provided this original earnings guidance in January and early February, during their full year and 4Q 2019 updates as they are required to report earnings within 45 days of their quarter end.

Since then, only 13 of the 500 S&P 500 companies have adjusted their earnings with only 11 companies withdrawing guidance completely.

Shown by the green bar on the chart above, some of the 13 firms adjusting their guidance lower include: Ralph Lauren, Apple, and Coca-Cola. However, many of these updates were provided prior to March, prior to the virus hitting Europe and North America a lot harder.

The one firm that provided the most recent update, Expedia, had this to say on March 13, 2020, “With the outbreak spreading significantly since Expedia’s fourth quarter earnings call on February 13, 2020, we now expect the negative impact in the first quarter related to COVID-19 to be in excess of the $30-$40 million range provided at that time.” Well that’s helpful! So basically, “things have gotten worse over the last month”.

Shown by the blue bar on the chart above, many of the 11 firms withdrawing guidance for 2020 are travel related companies such as Expedia, American Airlines, and Royal Caribbean. Withdrawing guidance means the company is no longer sticking to the numbers they provided and are not providing any new number, compared to the companies that are “revising” and providing new updated numbers.

In fact, less than half of the companies in the S&P 500 mentioned the Corona Virus in January and February. The chart below shows that only 213 of the 500 companies mentioned either Corona or COVID-19 in those earnings calls.

There is no doubt that will change during earnings season beginning next week. Prior to the unprecedented events of March, earnings for Q1 were expected to decline 2.9% from a bottoms up perspective.

Looking forward to Q2, from a bottoms up perspective, the scenario is similar. Very few companies have pre-announced any updates to their earnings. Companies are likely waiting until their 1st quarter earnings call to provide guidance, but it is also probably safe to say that a lot of companies simply do not know how their earnings are going to be affected during this forced period of lightened commerce. It may even come to fruition that they also won’t know how the rest of the year is going to look.

Don’t be surprised if we see a lot of companies withdrawing guidance for the year in the month of April, which could bring more uncertainty back to the markets.

Taken as a whole, from a bottoms up perspective, most companies have not provided any updates and thus bottoms up numbers are no doubt overstated, but by how much? This is where the tops down estimates might be helpful.

A few firms have taken a stab at just how much Corona Virus is going to affect bottom lines. Goldman Sachs is one of them, and it is not pretty.

The chart below shows what Goldman expects 2020 earnings to look like as of the week of March 23, 2020. They expect a whopping 123% decline in S&P 500 earnings in Q2 which would result in a full year Earnings estimate of just $110, a decline of 21% from 2019. (Earnings that fall more than 100% simply mean that the S&P 500 companies will lose money as a whole).

This also includes a massive assumption around Q4, with an estimate of $53 in earnings per share, which would be the biggest quarter ever by the S&P, by a long shot ($36 was the previous largest quarter). After such a deep pullback in demand, one would expect a strong snapback, so perhaps it is possible. But the reality is we could possibly see a whopping 20-30% decline in earnings for 2020.

Joining Goldman in their outlook, JP Morgan has a slightly more dire forecast of economic activity. They are now assuming a 30.1% decline in GDP in the 2nd quarter of 2020, with an unemployment rate average of 12.8% per this article by Fortune. For comparisons, Goldman is assuming a 24% drop in GDP in the 2Q.

It seems pretty safe to assume the 2nd quarter is going to look awful. And that’s an understatement. Given the potential drop in earnings, the stock market may actually be thinking rationally about all of this. Yes, it happened much faster than anyone thought possible, but so has the expected drop in earnings and economic output.

From a valuation standpoint, on Dec 31, 2019 the S&P’s valuation was 23.2x its earnings estimate of $139 to get to a price of $3230. If we assume Goldman’s earnings target of $110 for the year and a similar valuation multiple of 23x trailing earnings, then an S&P price of $2,530 seems reasonable. The S&P is right at that $2,530 price as we type on Friday, March 27.

What Shape will the Recover Take?

The million-dollar question remains: How long will this last?

Most economic recoveries occur in patterns that look like either a V, W, U or an L. Let’s assume that March and April are likely to be the two of the worst months in US economic history. What will the recovery look like?

A “V” recovery is one where the rebound in activity roughly equals the decline. This would imply that the violent decline in earnings will be followed by an equally violent rebound in activity. Maybe people will be tired of being cooped up for a month. Maybe the stimulus package will keep people from being evicted, and maybe the businesses that are shut down today will reopen to a line of customers out the door. This is the scenario we hope for. This would lead to a surprisingly strong stock market, and make the current environment a tremendous buying opportunity.

A “W” recovery initially looks like a “V”. Then there is some sort of relapse, where the markets and economy become weak again before ultimately rebounding. This may very well be the shape that this recover takes. The initial drop has been extreme for both markets and the real economy. A strong snap-back is logical. However, if the virus is initially contained through social distancing measures, but makes a strong comeback once people start going back to normal, we could easily find ourselves in the same situation over the summer or fall. Opportunities would still ultimately surface from this scenario, but there would be another period of very high volatility upon the second bout of uncertainty.

A “U” recovery would eventually get the economy back to previous levels, it just might take a little longer. This would suggest that the virus uncertainties extend into the summer, and more slowly work their way higher. In this scenario, there is no real snap-back in the economy or the markets, it simply remains weak for longer than a few months. This weakness could take 6-12 months to have any meaningful rebound. Volatility would remain high, and uncertainty would also remain very high. Ultimately, the market would rebound, but it would be after a lengthy recession with very little positive signs. This environment would favor the tactical investment strategy where risk could be quickly added and removed from portfolios.

The “L” recovery is what we desperately hope to avoid. Given the enormous drop in economic activity we’re seeing right now, this would likely lead to an economic depression. If we remain in a lock-down environment beyond April, and extend into the summer months, the risks dramatically increase that we would not see a fast rebound at all. This would suggest that it would take years to get back to where we were, and starts to bring up even more parallels to the 1929 crash. This scenario would likely lead to long-term unemployment, consumer behavior that changes permanently, personal and business bankruptcies, stress in real estate markets, and a generally bad environment for longer than many people think possible.

What will happen? We wish we knew the answer. The optimistic viewpoint is that this mess was not started by an underlying problem in the economy, like what occurred in 2008. We also have unprecedented liquidity being injected into the markets by the various central banks across the globe. The US is about to flood markets with over $6 Trillion of liquidity. That could have a very positive effect on markets and keep the economic damage contained to a short period of time. Expectations surrounding the virus are very negative, thus any positive developments could help boost expectations, along with market prices and economic activity.

The more negative view is that uncertainty is the real devil here. In a world of instantaneous digital news, that devil can get into our minds very quickly. We should expect that reported cases of Covid-19 are about to skyrocket, as are death totals. This could have negative effects on people’s psyche beyond what is already in place today. The economic damage is real, and the longer it extends the worse the ultimate outcome will be.

Invest wisely!


 Our clients have unique and meaningful goals.

We help clients achieve those goals through forward-thinking portfolios, principled advice, a deep understanding of financial markets, and an innovative fee structure.

Contact us for a Consultation.

Neither the information provided nor any opinion expressed constitutes a solicitation for the purchase or sale of any security. The investments and investment strategies identified herein may not be suitable for all investors. The appropriateness of a particular investment will depend upon an investor’s individual circumstances and objectives. *The information contained herein has been obtained from sources that are believed to be reliable. However, IronBridge does not independently verify the accuracy of this information and makes no representations as to its accuracy or completeness.  Disclaimer This presentation is for informational purposes only. All opinions and estimates constitute our judgment as of the date of this communication and are subject to change without notice. > Neither the information provided nor any opinion expressed constitutes a solicitation for the purchase or sale of any security. The investments and investment strategies identified herein may not be suitable for all investors. The appropriateness of a particular investment will depend upon an investor’s individual circumstances and objectives. *The information contained herein has been obtained from sources that are believed to be reliable. However, IronBridge does not independently verify the accuracy of this information and makes no representations as to its accuracy or completeness.

Filed Under: IronBridge Insights

Objectives during Volatility

March 16, 2020

“When we have hope, we discover powers within ourselves we may have never known- the power to make sacrifices, to endure, to heal, and to love. Once we choose hope, everything is possible.”

-Christopher Reeve


We continue to closely monitor the unprecedented environment surrounding the Coronavirus (COVID-19). While our primary concern is for the safety and well-being of our families, our team, our clients and our community, our primary focus is to help ensure the financial well-being of our clients.

Over the past few days, it seems like the anxiety has radically increased. We can feel it, and our guess is that you can too.

It can be unsettling. Shelves at grocery stores are bare. Normal plans are being cancelled. It now seems like a violation of social protocol to go out to dinner.

It’s not that it CAN be unsettling…it IS unsettling.

Today, instead of focusing on market data, let’s take a step back. What are the overall objectives that we are trying to achieve during this time?

In today’s chaotic environment, we are focused on four primary goals:

  1. Portfolio Values: Keep portfolio declines at levels so that the time it takes to recover any losses can be counted in weeks or months, not years.
  2. Financial Plans: Get through this period of time without needing to modify your personal financial plans in the wake of this panic.
  3. Distributions: If you rely on your portfolio for current income, make sure you have sufficient cash to support your distribution needs.
  4. Communication: We strive to keep clients up-to-date through individual phone and email communication, as well as sending bulk emails like this one to reach a large number of people quickly. We have implemented a policy of no in-person meetings over the coming weeks, and have invested in technology that will allow for webinar and video conferencing with our clients as warranted.

We discuss each of these goals below.

Portfolio Values

It was another bloodbath in the markets today. Stocks were down 12%, which was the second worst day in history for the Dow Jones and the third worst for the S&P 500. The only days worse were in 1987 for the Dow, when prices fell a staggering 22% in one day. For the S&P, October 1987 and one day in 1929 were worse.

The current market environment is obviously extremely tricky and incredibly complex. We have been adjusting clients’ net exposure to risk based on a combination of our quantitative processes and deep experience in financial markets.

Over the past few days, two existential threats have emerged:

  1. The likelihood of a recession now appears imminent.
  2. Financial markets could be closed for a period of time.

While social distancing on an individual and family level is indeed occurring as we speak, it is beginning to look like mass quarantines may very well take effect. San Francisco has implemented a “shelter-in-place” order, requiring all residents to remain at home with only a few exceptions. We fully expect other cities to follow suit.

The success of the economy is based on the movement of goods and capital, as well as the performance of various services across the country.

With such large parts of the population staying home, it appears improbable that we will avoid the existential risk of a recession at this point. Market prices have already begun to price in a deep recession, with the market having the fastest decline from all-time-highs in the history of the modern stock market, as shown in the chart below.

This is truly an unprecedented environment. The chart above does not include today’s 12% decline.

We still continue to believe that the current panic environment is not one that you should bulk sell into. With the VIX now over 80, we should expect daily moves to continue to be very volatile, both up and down.

While we don’t want to panic sell, we also believe that we should take steps to manage the risks of these relatively new existential threats.

On one hand, we must strive to keep portfolios so that there is a short recovery time. To that end, we have moderately increased cash and reduced equity exposure and are continuing to “thin the herd” by removing the weakest equities from portfolios. We also added hedge positions over the past two weeks that go up when markets go down to help offset short-term volatility in portfolios.

On the other hand, as we have said many times during the past couple of weeks, current conditions are so extreme that we must maintain an appropriate equity exposure so that we do not miss the inevitable (very strong) bounce that will occur. Even if that means additional near-term declines. We need to be cautiously opportunistic, and continue to adjust exposure into areas showing strength. And we need to be prepared to be very opportunistic, as this selloff ultimately will provide an excellent investment opportunity.

While we never like portfolio declines, client portfolios are currently at levels where recovery times are still acceptable. We want to make sure we keep it that way. Hence, the additional steps we have taken to manage risk.

The other existential risk is the possibility that financial markets shut down completely. This potential should not be ignored. We hope that doesn’t happen, and are uncertain whether that would be good or bad for markets over the near term. This appears to be a lower likelihood scenario, but we cannot ignore the potential for this to occur.

We discuss this in the “Distributions” section below, but from a portfolio standpoint we simply want to own a smart combination of cash, equity and hedges, so that if markets do close we are not concerned about positions if it happens. If it were to close, the logical time that it would be closed would be for a week or two, and would not likely extend weeks or months into the future. And again, we think this is a lower probability scenario.

Our best guess is that if markets were to shut down, it would likely happen this week.

While market closures are rare, they are not unprecedented. According to thestreet.com, the markets have been closed the following times:

  • 1865: Following the assassination of President Lincoln, the New York Stock Exchange was closed for a week.
  • September 20, 1873: The market closed for 10 days after the banking firm Jay Cooke & Company went under as a result of failed demand for railroad bonds.
  • July 31, 1914: The NYSE is halted for 4 months at the start of World War I. Foreign nations had large investments in US stocks, and the market was halted to prevent these nations from using funds for war build-up efforts.
  • 9/11 Attacks: Following the events of September 11, 2001, the all major US markets were closed for 10 days.
  • October 2012: Markets were closed for 2 days due to Hurricane Sandy.

There were other times where markets shut down to honor US Presidents who had passed away and various other reasons, but these were the major ones. Once the markets re-opened, they were generally positive over the coming months.

The Fed has also taken unprecedented steps by cutting interest rates to zero over the weekend and announcing $1.5 Trillion of funds that will flood the market. This should eventually have a very positive effect on markets, but it is uncertain when that positive influence will start.

For now, we will continue to adjust exposures both up and down, look for opportunities to both manage risk and be opportunistic, and will work to keep portfolios in positions to weather this storm and emerge stronger as the crisis subsides.

Financial Plans

Fortunately, portfolio fluctuations like what we have seen this year are already factored into financial plans. We do not make straight-line assumptions for returns. Rather, our financial planning software assumes that market volatility will happen over time, and incorporates both good and bad market conditions.

In addition, one of our key financial planning philosophies is to be conservative in our assumptions. We do not use aggressive return assumptions. We plan for longevity. We assume spending may be slightly higher that what may actually happen.

By combining all of these factors, we can have our confidence that our clients will achieve their goals. Even in the midst of the current chaos, we can rest knowing that we are not outside of any tolerances that our financial plans have projected.

Distributions

As we mentioned above, some clients rely on their portfolio for income. In preparation of potential market closures, we further raised cash today that clients can use if needed, without having to sell any positions.

Again, we do not think this is the likely outcome, but we need to prepare for it nonetheless.

For clients taking regular distributions, we have raised cash equal to at least 3 months of these distributions. Portfolios have more overall cash than that, but these funds are held in bank deposits within accounts so that they can be transferred to other banks as needed without the need to sell anything.

Communication

We find reports like these to be very useful, as we can communicate with large numbers of clients, friends and colleagues all at once.

That does not replace the importance of one-on-one communication. If we have not spoken with you, we will soon. If we have spoken with you via phone or email, expect to hear from us again soon.

If you have questions, please do not ever hesitate to reach out to us directly.

IronBridge Policies

Everyone must do their part during this chaotic time to help slow the spread of this virus. As our little part, we are eliminating in-person meetings for the time being. As mentioned above we are now using web-conferencing technology to help keep our client meetings as personal as possible.

From day one, IronBridge was set up to work remotely. So today’s environment will not affect our ability to serve clients. We use a third-party technology firm that leverages military-grade encryption technology so that our clients’ information is protected, regardless of where we perform our duties. Our laptops allow us to be fully functional from anywhere with an internet connection, so we will be able to handle portfolios and financial requests.

Conclusion

This is a scary time. The level of uncertainty is higher than any other time in recent history, including 2008 and the events of 9/11. I think we all would agree that you can feel the anxiety, and it is real.

But we will get through it. And we will emerge from these times stronger than we entered.

We must remember that we are in this together. If we do, we can rediscover the sense of community that only tragedy seems to bring out. Maybe, just maybe, this sense of community can be more permanent than has been the case in our recent past.

Stay safe friends.


 Our clients have unique and meaningful goals.

We help clients achieve those goals through forward-thinking portfolios, principled advice, a deep understanding of financial markets, and an innovative fee structure.

Contact us for a Consultation.

Neither the information provided nor any opinion expressed constitutes a solicitation for the purchase or sale of any security. The investments and investment strategies identified herein may not be suitable for all investors. The appropriateness of a particular investment will depend upon an investor’s individual circumstances and objectives. *The information contained herein has been obtained from sources that are believed to be reliable. However, IronBridge does not independently verify the accuracy of this information and makes no representations as to its accuracy or completeness.  Disclaimer This presentation is for informational purposes only. All opinions and estimates constitute our judgment as of the date of this communication and are subject to change without notice. > Neither the information provided nor any opinion expressed constitutes a solicitation for the purchase or sale of any security. The investments and investment strategies identified herein may not be suitable for all investors. The appropriateness of a particular investment will depend upon an investor’s individual circumstances and objectives. *The information contained herein has been obtained from sources that are believed to be reliable. However, IronBridge does not independently verify the accuracy of this information and makes no representations as to its accuracy or completeness.

Filed Under: Special Report

Crisis = Danger + Opportunity

March 10, 2020

In the Chinese language, the word “crisis” is composed of two symbols. One represents “danger” and the other “opportunity”.

Markets today are in a crisis. On Monday, the S&P 500 fell 225 points, or 7.6%. The Dow Jones dropped 2,013 points, or 7.8%. Crude oil fell over 30% at one point over the weekend, and interest rates are at the lowest level in recorded human history.

This has indeed been an historic move lower, at least with regards to the speed at which it has occurred.

As the Chinese word symbolizes, there is both danger and opportunity in the current crisis.

At IronBridge, we follow many indicators to gauge the underlying health of the markets. Over the past week, nearly every one of them have been at levels that typically accompany major market lows. During times of panic, like the period we find ourselves in today, it does not pay to sell. It pays to have prudence and patience, while mapping out changes that need to occur when the markets give us the inevitable bounce.

A major component of our investment process is to back-test specific rules that govern our process. One situation we have back-tested involves periods where markets experience quick, heightened risk.  What our findings show is that reducing risk during these periods of intense selling pressure actually does more harm than good, at least when specific conditions exist. This risk reduction would make you feel good at the time, but it has dramatically negative affects on long-term portfolio returns.

The reason is that when these periods occur, it typically happens during bull markets. Declines happen quickly and powerfully, and eventually the trend higher resumes. In longer-term bear markets, selling is more gradual and persistent, instead of fast and furious.

The trade-off is that you may have to experience slightly higher volatility in the short-run. So over a 2-3 week period, we may see bigger swings in portfolio values because we don’t have quite the level of cash that we might otherwise have during more frequent, but more orderly selloffs.

Let’s walk through a few quick charts showing just how intense this selling pressure has been, then discuss what we are doing in client portfolios.

First, the decline from peak-to-trough over the past three weeks now stands at 20%. In the 4th quarter of 2018, it took the market 3 MONTHS to decline 20%, and now it has happened in less than 3 WEEKS.

Such a rapid decline has caused many indicators to show dramatically oversold conditions, as shown in the bottom half of the chart above. We are seeing readings that are more extreme now than in the depths of the financial crisis in 2008.

These are not conditions to sell into. Yes, it is uncomfortable, and no question it is also scary. But it is not prudent to do wholesale adjustments to strategy in this environment.

One of the indicators that has a high priority in our investment process is called the Relative Strength Index, or RSI. It is a measure of momentum, and specifically analyzes of the strength of up days versus the weakness of down days over a preset period of time.

This has a very reliable, statistically significant information it can give to us. When it reaches extreme levels like we have seen over the past week, it has been an excellent indicator of a low point in the markets.

The chart below shows the S&P 500 Index with RSI in the bottom pane. Since 2011, these condition have reliably signaled a low point in the markets. We have tested this data much further back than 2011, and it confirms what the chart below tells us: don’t sell in these conditions.

Two times, in 2016 and 2018, we had 10%+ rallies, after the first signal, but the markets ultimately made new lows over the next few months. That may very well happen again now. But we should expect that the market will provide some much needed relief in the very near future.

Another indicator showing how much pessimism exists in markets today is the put/call ratio. This ratio measures the relative amount of put options purchased (traders thinking markets will decline) versus the amount of call options bought (thinking markets will rise).

This is a measures of fear. When this indicator is high, fear is also high. When it is low, market participants are complacent.

The next chart shows the S&P 500 versus this Put/Call ratio.

Currently, this ratio is higher than at any time during the financial crisis. The only time it was higher was during the “Flash Crash” in 2010.  This signals an extremely high level of panic and widespread fear.

One last indicator to discuss is the straight-forward “Fear and Greed Index” compiled by CNN.

In January, no one feared the market. The indicator was at one of the highest readings of all time, as shown in the first image below.


Fear & Greed Index on January 3, 2020


Fear & Greed Index on March 9, 2020

But as the second image shows, we are now in the exact opposite scenario of extreme fear just a short few weeks after the first reading was taken. Uncertainty dominates the landscape, and is showing itself in many indicators.

Bottom line, with so much fear in the markets, it is not prudent to sell.

Portfolio Strategy

For clients, we took steps to reduce risk prior to the selloff beginning, which we discussed in our report from last week. That was the time to take steps to manage risk. Since then, it has been prudent to be patient and to keep exposure relatively consistent.

Today, we did two things.

First, we continue to reposition equity exposure away from weak holdings into stocks showing greater strength. The majority of stocks we have been purchasing are associated with people staying at home. Streaming TV services, home delivery companies, and communication technology companies that allow people to more effectively work from home.

This theme in positioning is a direct result of the market favoring exposure to companies that may be positioned well for a continued effects of the coronavirus.

The other move we made today was to allocate a small portion of portfolios from cash into a pure equity hedge. This investment goes up when the market goes down, and is designed to be a very short-term hold to offset the risk of markets experiencing further declines and trading halts.

The next few weeks will determine if cash in portfolios will be put back to work, or whether further risk reductions will be warranted.

Overall, we expect the market to experience a strong rally that should begin soon. We do not expect the danger to be over, but we do see opportunities.

Invest Wisely!


 Our clients have unique and meaningful goals.

We help clients achieve those goals through forward-thinking portfolios, principled advice, a deep understanding of financial markets, and an innovative fee structure.

Contact us for a Consultation.

Neither the information provided nor any opinion expressed constitutes a solicitation for the purchase or sale of any security. The investments and investment strategies identified herein may not be suitable for all investors. The appropriateness of a particular investment will depend upon an investor’s individual circumstances and objectives. *The information contained herein has been obtained from sources that are believed to be reliable. However, IronBridge does not independently verify the accuracy of this information and makes no representations as to its accuracy or completeness.  Disclaimer This presentation is for informational purposes only. All opinions and estimates constitute our judgment as of the date of this communication and are subject to change without notice. > Neither the information provided nor any opinion expressed constitutes a solicitation for the purchase or sale of any security. The investments and investment strategies identified herein may not be suitable for all investors. The appropriateness of a particular investment will depend upon an investor’s individual circumstances and objectives. *The information contained herein has been obtained from sources that are believed to be reliable. However, IronBridge does not independently verify the accuracy of this information and makes no representations as to its accuracy or completeness.

Filed Under: Special Report

Unprecedented Decline from All-Time-Highs

March 4, 2020

Last week saw the fastest 10+% decline from a 52 week high in history. From peak-to-trough, the S&P 500 Index fell over 16% in 6 days. Additionally, all S&P 500 sectors declined 10% or more over the same period. This also occurred on a global scale, where every country’s stock market in the world has seen a sea of red. Even gold, precious metals, and commodities were being sold on widespread fears over the corona-virus.


“All things are subject to interpretation…whichever interpretation prevails at a given time is a function of power and not truth.”

-Friedrich Nietzsche


Portfolio Update – Is Everyone Awake Now?

It was a bloodbath last week, so let’s get right to the point. With the intensity of the latest decline, many records were broken. It was not pretty and (for the time being anyways), it will go down in the record books.

While we are caught up in the day to day volatility of the markets’ ups and downs, it is important that we also take a step back and remember that weeks like the one we just withstood is the primary reason we have built the processes we have around managing portfolios. Having a plan is so important during times of increased volatility, as these processes are put in place with the purpose of navigating through the markets, regardless of the backdrop. Having a process and plan before times like these are upon us is crucial in being able to come out the other side intact.

Part of our investment process that does not get used very often is recognizing when panic conditions exist. Various quantitative indicators we measure are designed to recognize severe and abnormal volatility. When certain criteria exists like it did last week, it is much better to not sell into the panic, and instead wait to re-evaluate as these conditions subside. The panic conditions are indeed starting to calm (at least for now), and we are now analyzing data on prudent next steps to take.

Although the severity and swiftness of the move was unprecedented, our strategies performed as expected. Here specific actions that we took for clients over the past few weeks:

  • In early February, we sold all international and emerging market stock exposure and moved into long-term US Treasury bonds.
  • There was an ETF that liquidated on February 14th, and was in cash prior to the move lower.
  • Once the selloff began, we received sell signals on a few individual stocks, which increased cash across client portfolios.
  • We sold high yield bond exposure one day after the selling began, further reducing risk.
  • Following the third day of selling (that included two 1000-point down days and one 800-point down day on the Dow), our panic signals kicked in and advised us to stop making additional sells.
  • By last Friday, we began adding stock exposure as well as repurchase some existing holdings near the bottom of this move.
  • We also rotated out of some stocks that weren’t working well and into others that were showing more resilience and better opportunity.

Overall, we have been very pleased with how our strategies performed through all the volatility. (If you have specific questions on your account, please do not hesitate to reach out as always).

However, we are still concerned about what may happen next.

It appears as though the risks and uncertainties around the corona virus are to blame for the recent selloff. At this point, we do not think it is prudent to try to understand all the possible outcomes of what the corona virus may do. We only know that there are very bad scenarios, yet also some not-so-bad ones.

The main problem we see with diagnosing the virus outcomes is simple…what should we believe? The number of cases globally could be massively understated, as there are simply not enough testing kits to possibly test everyone who has symptoms. Also, there could be millions with the virus that are asymptomatic, or not showing any symptoms right now.

Would that be good or bad? It would be bad in that it would likely increase the panic surrounding the virus. But it may also be good in that it could make the actual mortality rate much lower than it appears now, and possibly less fatal than the flu.

Those in power across the globe are determining what information is appropriate to disseminate, and we can’t help but be skeptical about what are actual facts.

It would be difficult enough to predict how the virus may or may not spread. Trying to then predict how markets will respond to a potentially endless number of scenarios is infinitely more complex. Add to that uncertainty around the actual data, and there is a recipe for prediction disaster.

We have said many times that we simply don’t care why the market is doing what it is doing. We simply want a plan on how to handle what happens.

We want to understand the landscape and potential impacts, and we continue to monitor a variety of risks very closely. But ultimately it doesn’t matter why. This is why we rely on a process, not guesswork.

Which brings us to simply analyzing what “is” in the market right now.

First Correction since 2018

The S&P 500 fell over 16% from peak to trough in only 6 trading days. Since the decline exceeded 10%, we now have seen the first market correction since the 4th quarter of 2018. Let’s look at some of the unique characteristics of this latest fall from grace and where we may be headed from here.

The first chart below (courtesy of Bloomberg and LPL) shows just how swift this was compared to other 10% drawdowns. Officially it was the fastest decline of 10%+ from an all time high on record since the S&P 500 Index began on March 4, 1957.

This took prices all the way back to January 2018’s top (SPX 2875). At one point during this recent decline, 2 years of gains were wiped out.

The chart below shows that reality.

Do you think those January price levels are important? You bet they are! This is the quintessential definition of support and resistance levels. January 2018’s previous resistance has now become February 2020’s support. This is a key level to watch if selling resumes.

Another unique characteristic of this decline is just how widespread it was. The decline touched every single S&P 500 sector in a very negative way, offering up a little humble pie to those who rely solely on diversification to protect their portfolios from “risk”. Even the typically less volatile sectors (Consumer Staples and Healthcare) were down more than 10%. The drawdown column in the below chart shows the decline of each sector from their recent 52 week highs. Staples fell 10.56% while Energy was down a whopping 27.50%

In a week where Treasury bonds skyrocketed, it is inconceivable that Utility stocks, with the highest correlation to Treasuries and the lowest correlation to the S&P 500, still fell 12.5%! Yet, these are events we just witnessed and goes to show you cannot depend on diversification to protect you in the event of a stock market decline. If nothing else it’s likely a testament to just how stretched we had gotten on the upside.

They say that the four most dangerous words in investing are “this time is different”, yet time and time again we find unprecedented

and “different” events occurring in the markets. We think largely that quote is meant for higher level behavioral finance concepts, like fear and greed always being present in the markets; not for in-the-weed statistics like the ones above, but it’s hard to argue with the fact that actually, yes, this selloff was different.

An example of how this time was “different” was that diversifying your portfolio alone did not help you during last week’s slaughter (this is quickly becoming a common theme during selloffs). This is one reason why our strategies don’t rely solely on diversification to protect during drawdowns.

In the next chart below, international stocks also showed how widespread the selling was and how little diversification did for your portfolio. As of Monday, March 2, Every major stock market in the world had significant price drawdowns from their highs, with many down 15% or more. The median drawdown was 14.41% across the world over the last few weeks.

Another interesting aspect, and another continued knock on modern portfolio theory, the S&P 500 continues to massively out-perform the other markets around the world, even with its significant decline in February.


Anyone Hear the All-Clear Siren?

So are we all clear? Is the selloff over? If this decline is like most of the recent ones, then it would not be difficult to assume that yes, this decline is now over. The chart and statistics below, courtesy of SentimentTrader.com suggests that generally, after such a swift pullback in the markets, stocks are up over the next 6 months.

The chart and table below show the results from the other times the market fell so quickly from its all time highs. Of note, though, is one year later the average return has been flat, so that’s certainly a possibility. In addition and shown in the table, there are less than 10 data points, not near enough to try to make a statistically based gamble on the direction of the market, but if we were to accept these examples as representative then it would be safe to say we could be 1-12% higher in 6 months with a big risk we retest the lows within a year (note: we are already 5% higher after Monday’s, 3/2/2020, rally).

Other Times the Market Fell This Swiftly from an All Time High

Additionally, on Tuesday, March 3, the Federal Reserve also tried to come to the market’s rescue as it did its first “surprise” rate cut since 2008, a 50 basis point cut “in order to get ahead of the potential economic disruptions resulting from the Corona Virus”. This was a major surprise and the market initially liked it, up 1% on the news, but then immediately gave back all those gains and then some closing down over 2%.

Our Fed Monitor suggests this was an unnecessary move by the Fed and only means they have less ammo if a recession does eventually develop and they need to cut the remaining 1%. Our Fed Monitor is shown below through last week and reveals the 3 month Treasury rate has not really moved that much during the last month (while the longer end of the Treasury curve has been tanking). Based on our model, the Fed Funds rate was only 16 basis points above the market’s 3 month Treasury yield, right in the historical normal range between + or -20 basis points. This latest Fed move puts them near a historically low 30+ points below the market rate. It seems they may have reached for this one.

Nevertheless it is just another data point that the Fed “has the market’s back” as global central bankers continue to do all they can to keep the bull raging.


Looking Forward

What if this decline is like 1987 or 1989 or 1999, when the market saw further declines following such swift corrections from an all time high? After all, and shown in the table above, 3 of the 8 other times this occurred saw the correction fall further at some point within the next year.

The good news is we don’t have to try to guess if that will be the case. That’s one of the luxuries of having a process-driven portfolio management system. We are prepared for either outcome and we don’t have to guess what the market will do next. Besides being impossible to do, guessing what the market will do leaves a manager relying solely on luck rather than skill in navigating the markets.

If this decline is like all the other recent ones and wants to “V” bottom here (a term given to a swift decline that is immediately followed by a swift rally due to its shape of a “V” as viewed on a chart), then our client portfolios are already prepared for such outcomes.

However, if “this time is different”, and the recent decline does not hold, we have our strategies in place that will, once again, have us moving into safety and raising cash as necessary, just as they were designed to do.

On Monday, March 2, the Dow rallied the most points in its history, up over 5%, gaining back some of last week’s losses, but then those gains were half given back on Tuesday, March 3. So where do we go from here?

If you have followed our research for awhile you may remember a piece we put out entitled, “What does a Market Top Look Like?” In it we recognized a few technical readings that seemed to appear during topping processes. One of those is an initial decline that is followed by a bounce into a key resistance zone.

Right now that resistance zone is in the range of 3050 to 3120, where prices are trading as we go to print, so we are right in that first area of resistance. A rejection in price at this level, followed by a resumption of the downtrend back below last week’s and January 2018’s price high (discussed earlier) would be a bearish event and similar to other major tops that have occurred during our lifetime.

However, if price can continue to move higher from here, through the green shaded area and above the 3260 level, it is likely we have ourselves another “V” bottom, and we should look for new all time highs once again.

Invest Wisely!


 Our clients have unique and meaningful goals.

We help clients achieve those goals through forward-thinking portfolios, principled advice, a deep understanding of financial markets, and an innovative fee structure.

Contact us for a Consultation.

Neither the information provided nor any opinion expressed constitutes a solicitation for the purchase or sale of any security. The investments and investment strategies identified herein may not be suitable for all investors. The appropriateness of a particular investment will depend upon an investor’s individual circumstances and objectives. *The information contained herein has been obtained from sources that are believed to be reliable. However, IronBridge does not independently verify the accuracy of this information and makes no representations as to its accuracy or completeness.  Disclaimer This presentation is for informational purposes only. All opinions and estimates constitute our judgment as of the date of this communication and are subject to change without notice. > Neither the information provided nor any opinion expressed constitutes a solicitation for the purchase or sale of any security. The investments and investment strategies identified herein may not be suitable for all investors. The appropriateness of a particular investment will depend upon an investor’s individual circumstances and objectives. *The information contained herein has been obtained from sources that are believed to be reliable. However, IronBridge does not independently verify the accuracy of this information and makes no representations as to its accuracy or completeness.

Filed Under: IronBridge Insights

  • « Go to Previous Page
  • Go to page 1
  • Interim pages omitted …
  • Go to page 9
  • Go to page 10
  • Go to page 11
  • Go to page 12
  • Go to page 13
  • Interim pages omitted …
  • Go to page 19
  • Go to Next Page »

Footer

LET'S CONNECT

  • Email
  • Facebook
  • Instagram
  • LinkedIn
  • Twitter

AUSTIN LOCATION

6420 Bee Caves Rd, Suite 201

Austin, Texas 78746

DISCLOSURES

Form ADV  |  Privacy Policy  |  Website Disclosures

  • Home
  • Difference
  • Process
  • Services
  • Insights
  • Team
  • Clients
  • Form CRS
  • Contact Us

Copyright © 2017-Present by IronBridge Private Wealth, LLC. All rights reserved.