Stocks are once again attempting to add more positive signs to the choppiness that has characterized the past six months. While the short-term signs are looking more and more positive as the days and weeks go by, longer term signs are showing extreme valuations in many different sectors. International investing continues to show that ignoring currency effects on your international stock and bond exposure will lead to disappointment.
[maxbutton id=”5″ url=”https://ironbridge360.com/wp-content/uploads/2018/07/IronBridge-Insights-2018-07-13-Looking-for-Bubbles.pdf” text=”View PDF” ]
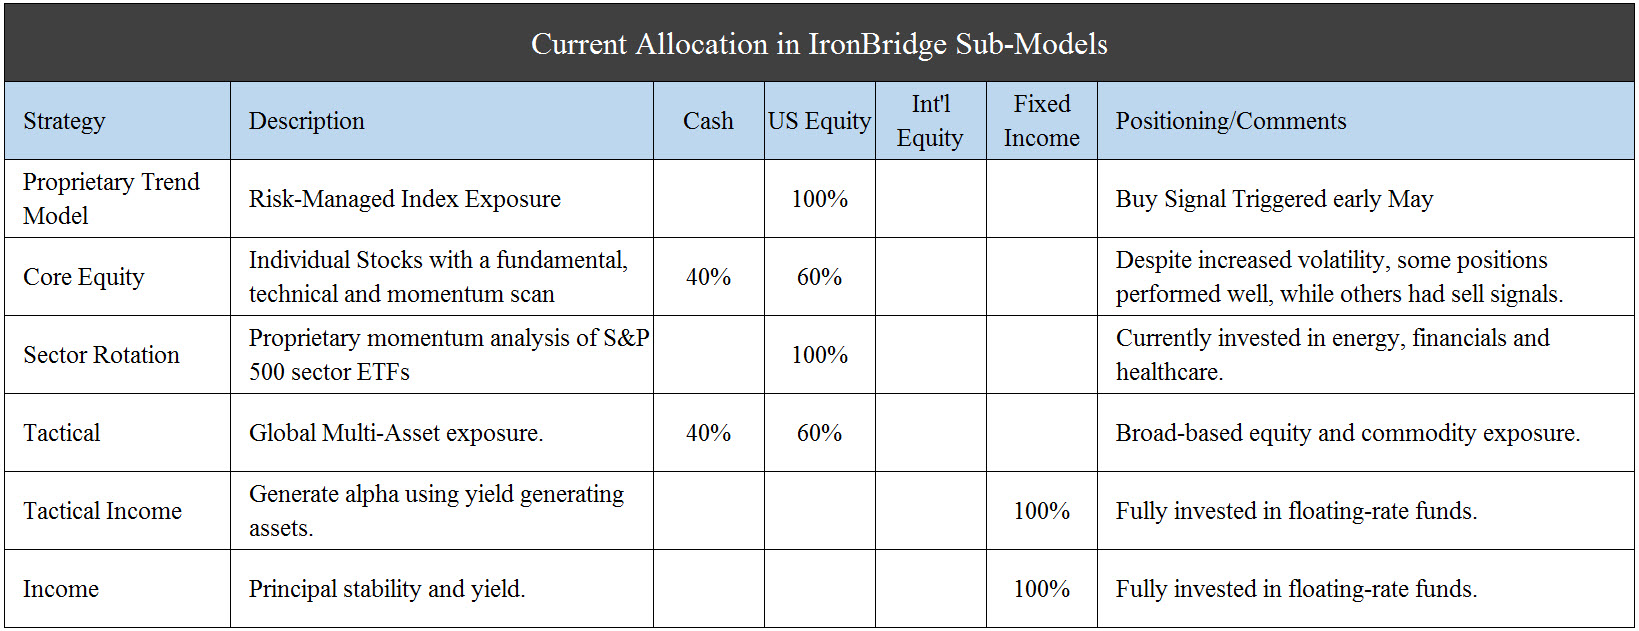
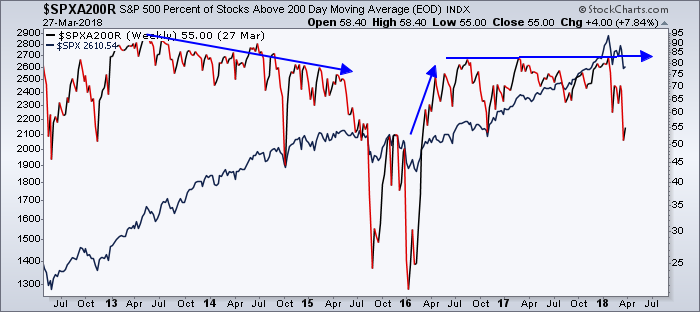
FIT Model Update: Market Correction
![]()
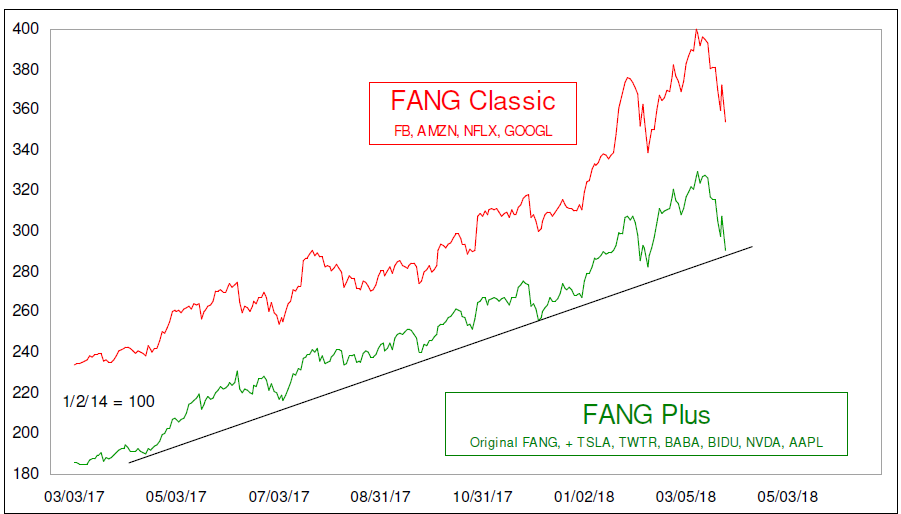
Are we in another tech bubble? They say that history doesn’t repeat but instead it “rhymes”. This time seems no different. In addition to a tech bubble we may also be in a consumer discretionary bubble (driven by Amazon, mainly). Value and similar “Staple” stocks by some measures are at their cheapest levels ever. This has been driven by an insatiable desire to own the FANG and other growth stocks, but are the reasons for the increased ownership admirable? It is not a stretch to suggest that we are in an equity bubble right now.
Portfolio Insights

Stocks Attempting to Break Higher
Once again, the stock market is on the verge of an upside breakout. Over the past few Insights issues, we have noted the positive short-term developments in equity markets. We increased equity exposure throughout early and mid May, and we continue monitor our signals to further increase equity exposure.
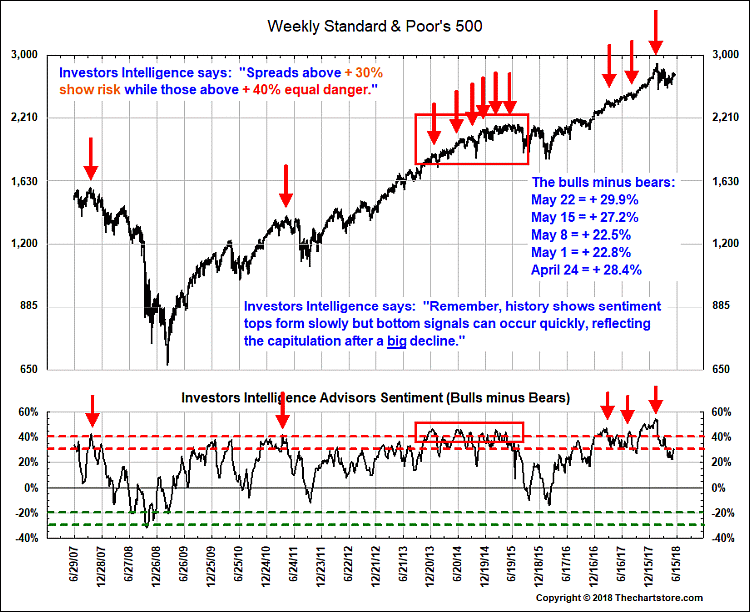
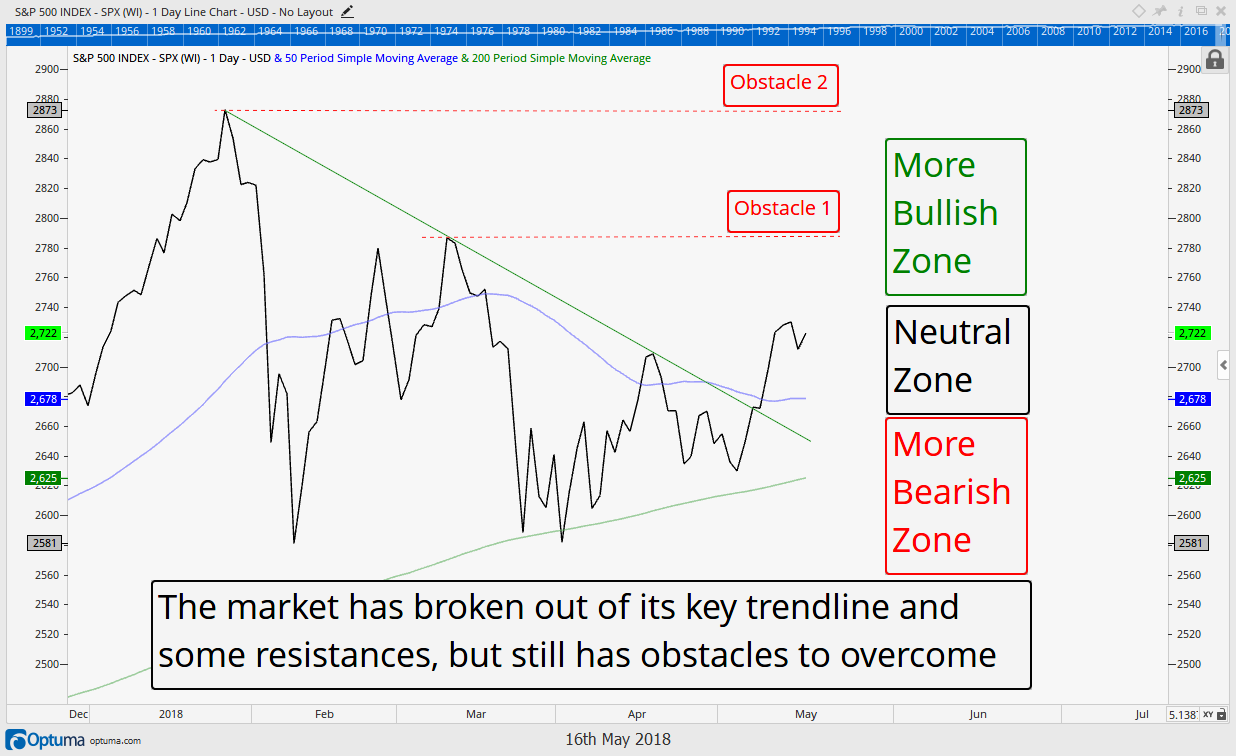
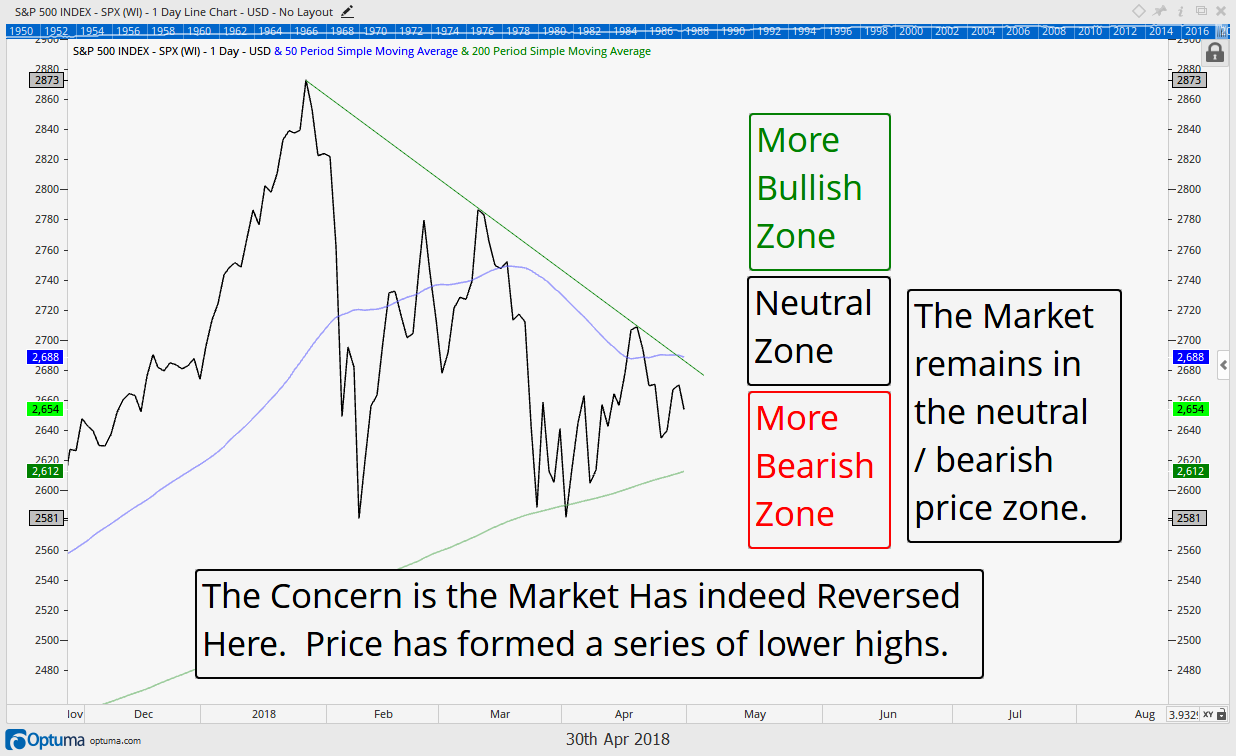
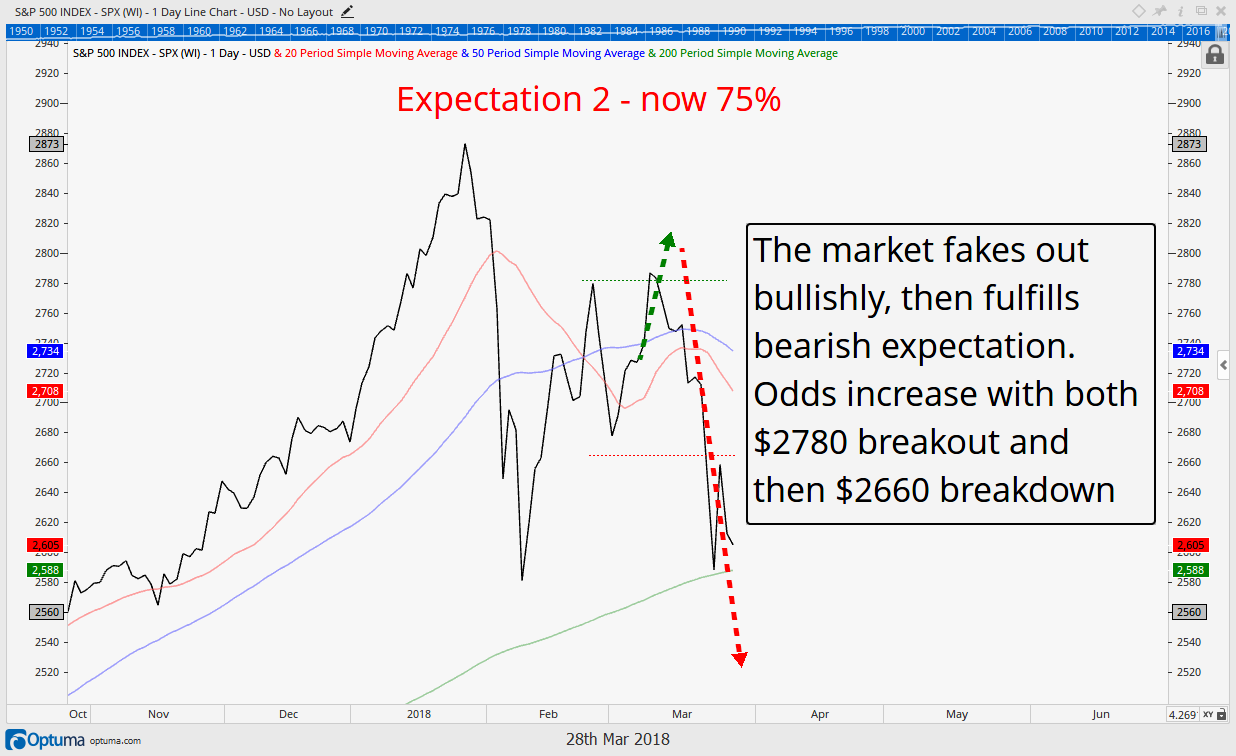
The chart below is the S&P 500. We have identified three key areas.
The first area to note was in early May. This was the first time the S&P 500 showed some signs of promise since the volatility began in February. It broke above its down-trending line in early May, noted by the blue line, and has since been in a choppy grind higher. We noted this importance in our May 18th issue “The Good, the Bad & the Ugly”. At that time, we also noted that the next important level would be the March highs. Well, here we are testing those highs.
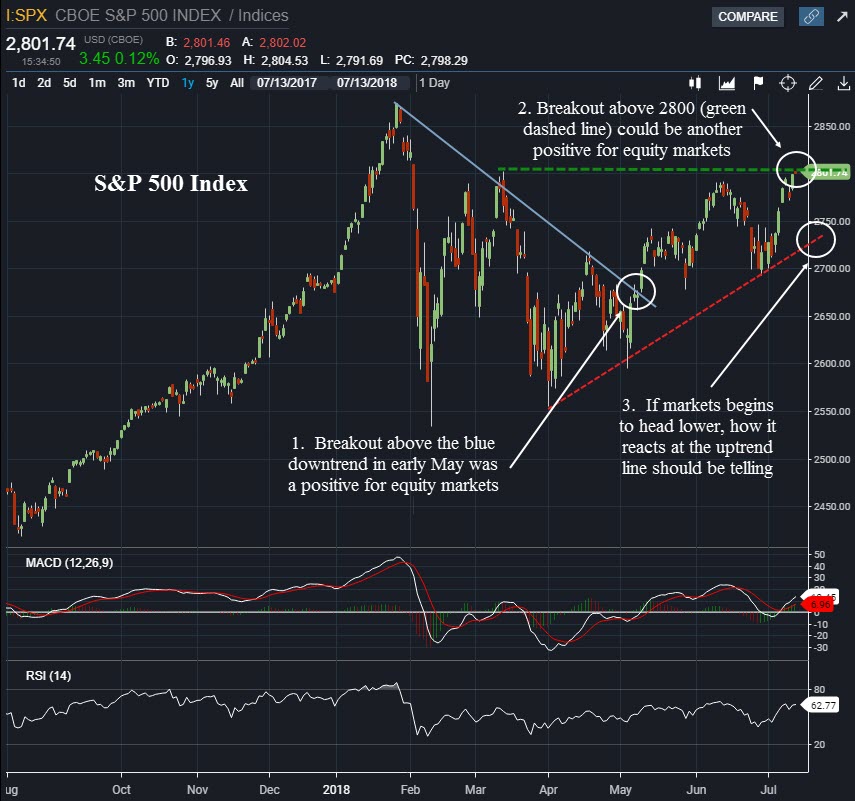
The second area to notice is the critical test the market finds itself facing. There have been a few times over the past 6 months when the entire investing world was watching one key level to determine the near-term future of markets. We are currently at one of those levels today. The highs from March of this year (2800 on the S&P) are important levels for the market to overcome.
If the market can break above (and stay above) the all-important 2800-level (green line on the chart), then the market has a very good shot at making new all-time highs.
However, if this level proves again to be strong resistance and the market starts to drift lower, then the next level we will be watching is the uptrend from the March lows (red line). A breakdown at this level would be very troubling, and likely increase the chances that the market will re-visit the lows from February.
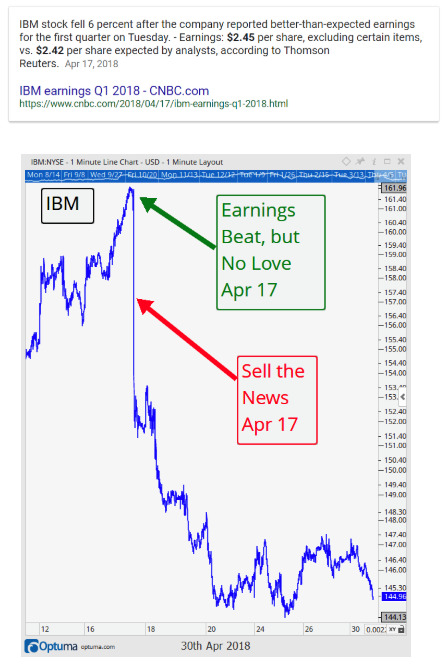
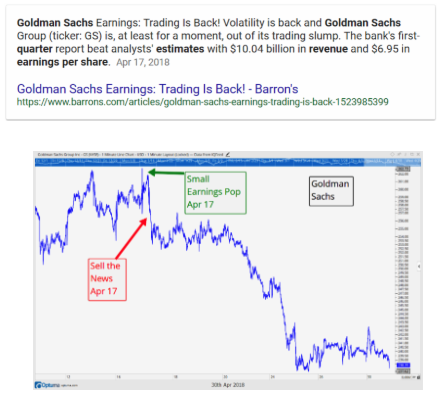
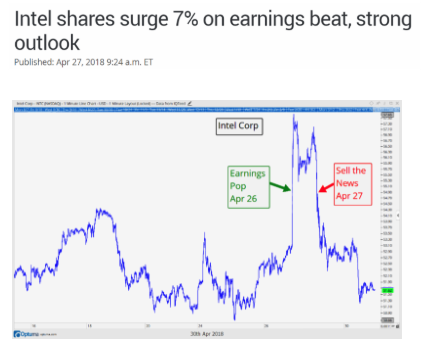
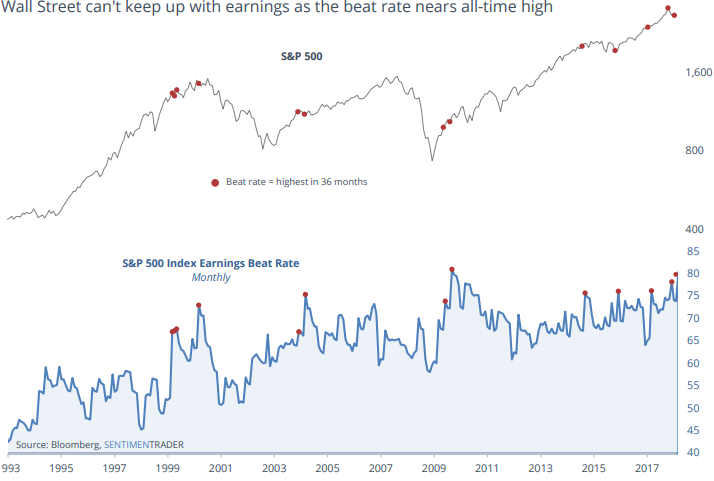
Earnings Season
For us, it is always fascinating when the market gets to critical resistance when circumstances seem to be aligning to push the market in one direction or another. One major catalyst is earnings season. It kicks off this week with consensus for earnings to rise more than 20% versus this time last year. This is an incredibly large hurdle, due in large part to the tax cuts and improvements in the energy sector (ie, higher oil prices).
Earnings can rise for a variety of reasons. These reasons are: increased sales, improved margins and stock buy-backs.
- Increased sales are easy to understand. A company that sells slip-n-slides reports that is has sold more slip-n-slides this quarter. That’s good for the bottom line.
- Earnings can also grow by reducing costs. If various input costs (labor, materials, transportation, etc) go down, then sales don’t have to rise for earnings to improve.
- Stock buy-backs are the way companies can skew the numbers without having to increase sales or reduce costs. By reducing the number of shares outstanding, a company can make earnings-per-share rise.
To us, it will be as important to understand how earnings have increased due to sales, costs, or buy-backs as how much they actually rose.
One other catalyst is the continued trade tensions across the globe. While we are beginning to get the sense that the markets may be getting immune to President Trump’s endless tweets, uncertainty from those in power cause uncertainty in markets, and that has the potential to lead to temporary mis-pricing both higher and lower.
Trade negotiations will likely continue over the next few months, but will they continue to cause short-term bouts of volatility?
Bottom line, we believe investors have very high expectations this earnings season. We also believe there are parts of the market that are very over-valued (discussed below), and continue to watch our signals for appropriate responses and portfolio allocations. These issues do not mean the market cannot head higher, though, and we will continue to participate if markets want to continue higher.
Market Microscope

It’s a Bubble Gum World
There are so many good quotes about market “bubbles”, like the one above, and why not, they are an amazing thing to behold. But what if we told you that we could be witnessing a bubble right now, would you believe us?
Did you know that there was a stock market bubble while it was occurring in the late 90’s? Many people talked about it, and a lot of people made huge bets against the markets in the late 90s in anticipation of a bursting of the bubble, only to have their accounts blow up as the bubble just got bigger and bigger (Tiger Fund’s $6.7B long/short fund, is one example of a fund closing during that time…read about it here). Warren Buffett was even ridiculed and his investment acumen questioned during this time for largely staying away from tech investments. Eventually he was proved largely correct, but his experience shows just how difficult it is to actually recognize when a bubble is occurring and how long it may last. Did TimeWarner know they were in a stock market bubble when they paid $160B for AOL? In hindsight we can confirm a bubble’s existence, while in real time we can only speculate that it is occurring as all we can really do is trust our decision making processes.
Richard Thaler is an economist that focuses his research on human behavior and also provides us a good quote on bubbles, “It’s not that we can predict bubbles – if we could, we would be rich. But we can certainly have a bubble warning system.” IronBridge’s bubble warning system has started to alert us of one such potential in certain pockets of the market.
The first chart below got us thinking about this more. Value stocks in the U.S. today are the cheapest they have ever been compared to growth stocks. Put another way (and if you flipped the chart upside down), growth stocks are the most costly to own in their history compared to value. The only other comparable period was the .com bubble, and when we hear the phrase, “the only other time in history was during the .com bubble” our warning system indeed starts flashing.
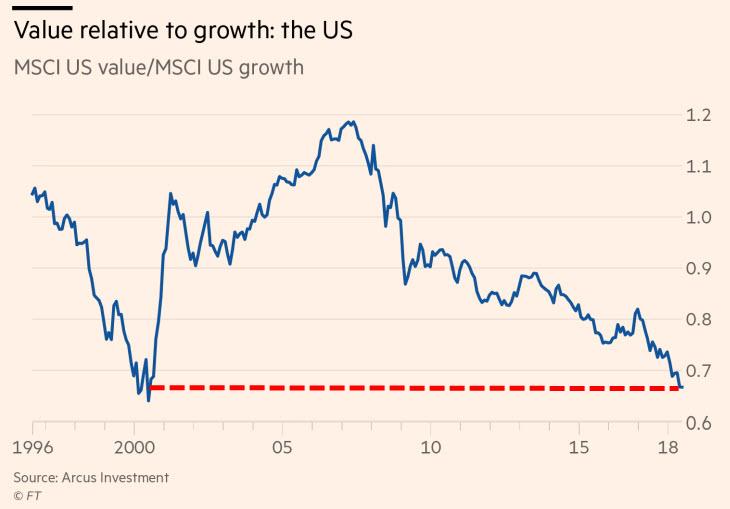
Value stocks are typically the stocks with positive cash flows, pay dividends, make profits, and return “value” to investors. Generally these companies are mature and have been in business for awhile. Warren Buffett is a famed “value” investor, so value stocks are ones that Buffett could have on his radar.
Growth stocks, on the other hand generally don’t pay out dividends, may not have profits, and are typically younger in their age, and for some reason these are the stocks everyone keeps buying. Returns in growth stocks typically come from price appreciation and terminal values whereas returns in value stocks typically come from dividends and cash flows. If value stocks are the cheapest they have ever been compared to growth then it seems many investors have abandoned value investing in exchange for some new kind of investing as, for whatever reason, investors continue to pursue growth over value (we think we know a big reason why and it has to do with passive/index investing and returns chasing).
Perhaps this is just an anomaly. What exactly is value and growth anyways? Investors used to invest based on value and growth, perhaps now they are utilizing sectors more so than those more traditional labels, so let’s take a look at some sectors and see if they are showing similar extremes.
The next chart shows 2 of the 11 sector ETFs, the consumer staples sector ETF (XLP) and the technology sector ETF (XLK), measured against one another. These two ETFs make up 32% of the S&P 500’s market cap, with technology 25% of it.
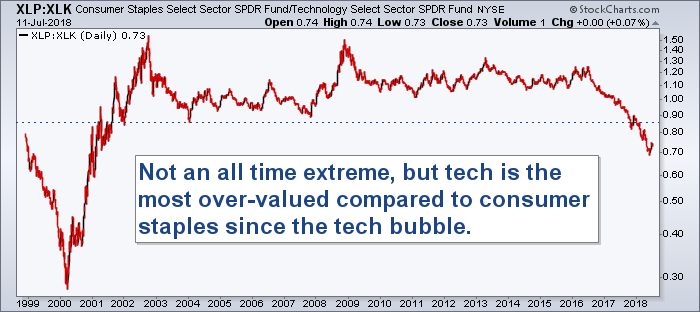
The top 5 holdings in the consumer staples sector are Proctor and Gamble, Coca Cola, Pepsico, Philip Morris, and Wal-Mart. XLP is down over 6% so far this year. These are companies that make household goods, typically physical goods purchased daily such as food, beverages, and paper products.
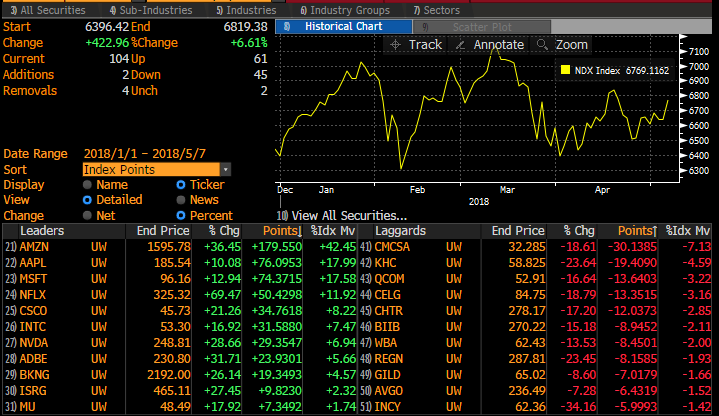
The top 5 holdings in the technology sector are Apple, Microsoft, Google, Facebook, and Visa, and the interesting thing is these 5 companies make up almost 50% of that sector, making them a whopping 12.5% of the S&P 500. XLK is up 14% this year (largely as a result of these stocks’ performance). This also means these 5 stocks have contributed almost 2% to the entire S&P’s return in 2018, but we digress.
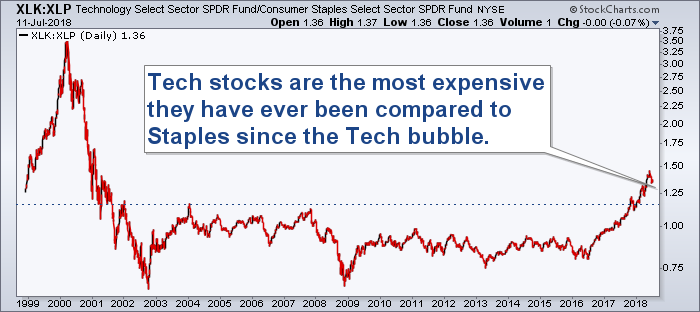
The next chart below is the flipped chart of the first one, moving technology to the numerator and staples to the denominator. It helps show things a little differently, but the conclusion is the same, tech stocks are the most expensive they have ever been compared to staples, besides during the .com bubble, and “the only other comparable period was in the .com bubble” could be reason enough to think that technology stocks have once again entered bubble territory.
The charts above reveal only one other time in history have consumer staples been this unloved compared to technology. So, we now have two examples of extreme over and under valuation to support a thesis of a potential bubble once again in growth/tech and/or a potential generational buying opportunity in value/consumer staples.
But this is where it also starts to get interesting. Let’s look at another sector, the fourth largest, at 14% of the stock market.
The consumer discretionary sector (XLY) is dominated by Amazon. Interestingly, like Tech, that sector is also up over 14% year to date, led by Amazon which is up over 50% already this year! Amazon alone is 23% of the entire discretionary sector, and similar to the top 5 Tech stocks, that implies Amazon has also contributed about 1.6% of the S&P 500’s gains this year. These 5 tech stocks along with Amazon account for almost all of the S&P 500’s gross gains this year!
The chart below now shows the relationship between this consumer discretionary and the consumer staples sectors. History is also being made between these two. Compared to the consumer staples’s sector, both tech and discretionary have entered historical extremes.
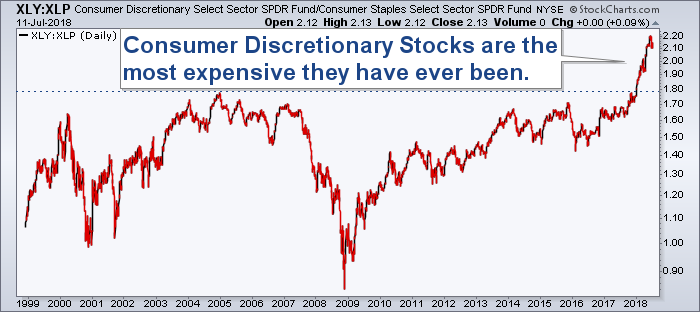
It’s pretty easy to make the connection that “Value” is similar in nature to “Staples”, and “Growth” is similar to both “Technology” and “Discretionary”. Taken as a whole we are at a historical level of over-valuation for technology and discretionary stocks and under-valuation of staple stocks. Given the last time these kinds of extremes were seen was in the tech bubble of the late 1990s, it’s also not hard to jump to the conclusion that we could be witnessing another similar bubble in the making.
Alluded to earlier, these sector funds are somewhat a product of a self-fulfilling prophecy; here’s how that works:
As investors buy Amazon, it becomes bigger, and as it gets bigger every single market weighted ETF and mutual fund and hedge fund must also buy more of it in order to keep up with its size, primarily because their benchmarks also now have the greater amount of Amazon in them. This is how these stocks can continue to defy the fundamentals and lack of cash flows, etc, and can continue well into bubble territory. Essentially fund flows are what is driving price higher, and many smart investors must chase these stocks, whether they like it or not, or risk under-performing their benchmarks. The reality is many buyers are having to buy it, and have become buyers at any price, and this is how stretched valuations can become even more stretched.
We think this is one of the biggest hidden risks in passive investing; that an Amazon can become 25% of an entire sector is really a travesty (it only has 4% of all retail sales and two years ago was less than 10% of this sector), but it is the reality of the situation. Unfortunately, today’s market is much more a product of the index investing trend and popularity of passive etfs than sound fundamental decision making.
Taking a step back, though, it’s all just a zero sum game, and the counter-argument to the bubble conjecture is that investors are just choosing one type of stock (growth) over another (value), albeit at a historical clip. These potential bubbles are being measured in relative terms, comparing one stock sector to another, not stocks versus other assets, for instance. So there may be “bubbles” in certain sectors (XLK and XLY), there are the opposite of “bubbles” in others (XLP).
Investors in stocks generally will choose between other stocks, meaning if an investor didn’t buy Amazon or SPY (S&P 500 ETF) or XLY or the staples sector they would buy some other stock, and right now they are choosing to buy the tech and discretionary names at the expense of the value, staples, companies. There very well may be a bubble in consumer discretionary and technology stocks, especially compared to consumer staples, but the real question is, is there a bubble in stocks as a whole?
The next chart may provide a clue.
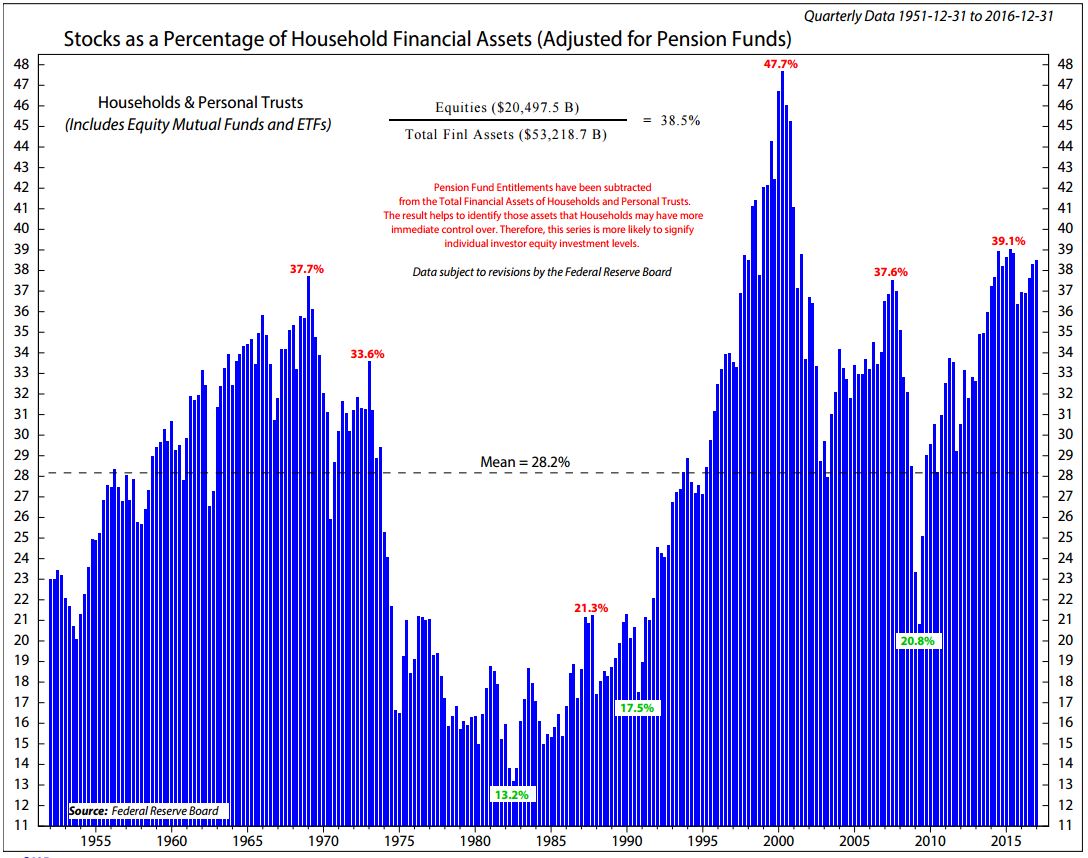
The real bubble indicator is likely a measurement of the amount of stocks one owns compared to other assets such as homes, bonds, cash, or alternatives, and one way to measure this is through the Federal Reserve’s data on household financial assets. The chart above reveals that equities were recently over 39% of the average household’s assets, and that is the 2nd highest level ever, only behind the .com bubble.
So, once again we have an instance when “the only other comparable period was the .com bubble”, but this instance is pertaining to all assets as a whole, not just pockets of “growth” or sectors.
Another good aspect of this graph is how far back in history it goes. We can see that the 3 prior major market peaks of levels of stocks as % of household assets above 35% also aligns neatly with historic stock market tops.
Are you old enough to remember the “bubble gum pop” of the late 1960s? The Archies, Ohio Express, and the Monkees are examples of artists from back then who sang generally happy songs about love and dating marketed toward teenagers. This genre of music also happened to accompany a historic stock market top as a then record 37.7% of household assets were invested in the stock market. Things were relatively good as reflected by the pop music as the baby boomer generation was coming of age. The stock market top of 1966 did not exceed that level for 17 years. Only until 1983 did the Dow finally make a new high.
During the .com bubble, stocks soared to as high as 48% of household assets as price gains were a large part of this new all time high as a percent of assets. And, again, just before the financial crisis, stocks as a % of household assets rapidly approached 38%. Now today stocks have recently peaked above 39% of household assets. With this data through the end of 2016 and no doubt with 2017’s great year, equities as % of household assets are now likely back above 40%.
The chart helps reveal that today investors are as “vested” in the stock market as they have ever been, actually the second most “reliance” on it in history, and they are not in good company based on history. This aligns with the thesis we are once again likely witnessing some bubbles.
Uncovering the Hidden Euros in International Investing
Last issue we touched on the international stock market and its recent under-performance. This issue we want to dive into the topic a little more as it helps continue the conversation around the typical diversification tactics which suggest constant exposure to varying assets, including international stocks and bonds (and thus knowingly or not, to currencies).
As we turned the calendar from 2017 to 2018 we called attention to one underlying theme that seemed universal…that international stocks were poised to continue their stellar run in 2018. We, however, were skeptical and highlighted how most investment mangers were not recognizing a major risk in international markets, that these international stocks were not only driven by individual company performance, but also by currency ups and downs.
We think many of the promoters of such diversification strategies have been missing a key point, that currencies have as much effect on international investment performance as the underlying holdings themselves. In reality investors are really investing in currencies as much as they are equities when they own international stocks. Furthermore, why not separate your investments in international stocks from your investments in currencies, as these should be two separate investment processes and decisions as they are two entirely different assets! Unfortunately this is rarely done. (at IronBridge we utilize separate ETFs for currencies and local currency based ETFs to make sure we account for this)
As an example: suppose German stocks were up 10% but the Euro is also down 10%, an investor investing from the U.S. would net nothing as those two returns offset one another. Currency translation wipes out all gains. Germans are jumping for joy with their 10% gains, but Americans would not be happy with their flat returns. 2017 was a great year for international stocks (it was a great year for most stocks), but if you take out the gains seen in the Euro, many international stocks actually underperformed the U.S. markets. The chart below shows one example of this.
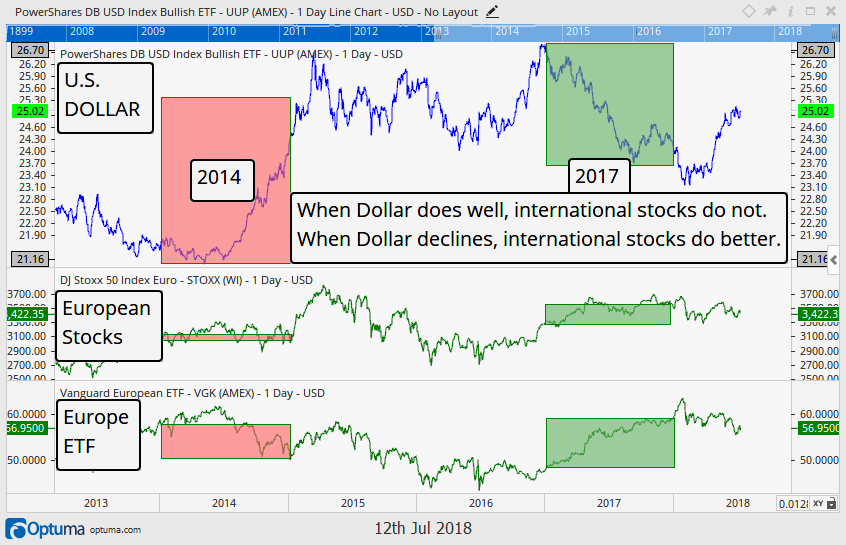 Notice that when the U.S. Dollar was rising (top portion in red), the Dow Jones Stoxx 50 (an index of European Stocks priced in Euros) did rather poorly, however, when the Dollar declined (which means the Euro advanced and is highlighted in green), the Stoxx 50 did much better. But also notice the difference between the middle section, which is priced in the local currency, the Euro, and the bottom portion of the chart, which is essentially the same thing, just converted to U.S. Dollars.
The currency translation amplified the returns, both negatively and positively, highlighting just how international investments are affected by currency movements. In 2014, Europe was essentially flat, but Americans that invested in the Vanguard European ETF were down significantly. Now look how international stocks are down thus far in 2018, a large part due to the Euro being down 3% so far this year! International is underperforming, not because the European markets are doing horribly in local currencies, but largely because the Euro is what is killing returns.
Bottom line…the market continues to give a little something to everyone. Bulls can view the potential breakout as a sign the markets will continue higher for another few years. While bears can see over-valuation in many areas of the market as a bug in search of a windshield, just waiting for the next major down market.
We continue to remain disciplined and unemotional. Whichever way the market decides to go is fine with us, and we have already made preparations for either scenario.
Invest wisely.
Our clients have unique and meaningful goals.
We help clients achieve those goals through forward-thinking portfolios, principled advice, a deep understanding of financial markets, and an innovative fee structure.
Contact us for a Consultation.
Neither the information provided nor any opinion expressed constitutes a solicitation for the purchase or sale of any security. The investments and investment strategies identified herein may not be suitable for all investors. The appropriateness of a particular investment will depend upon an investor’s individual circumstances and objectives. *The information contained herein has been obtained from sources that are believed to be reliable. However, IronBridge does not independently verify the accuracy of this information and makes no representations as to its accuracy or completeness. Disclaimer This presentation is for informational purposes only. All opinions and estimates constitute our judgment as of the date of this communication and are subject to change without notice. > Neither the information provided nor any opinion expressed constitutes a solicitation for the purchase or sale of any security. The investments and investment strategies identified herein may not be suitable for all investors. The appropriateness of a particular investment will depend upon an investor’s individual circumstances and objectives. *The information contained herein has been obtained from sources that are believed to be reliable. However, IronBridge does not independently verify the accuracy of this information and makes no representations as to its accuracy or completeness.