In investing there are three major disciplines that attempt to analyze the factors that drive investment performance. We take a look at the primary components we are watching in each of these three key areas in the markets to get clues as to what is next.
We remember the heroes and first responders who selflessly rushed in to save lives and recover victims during the tragic events of 9/11, and hope that we never forget the attitude of service and gratitude that emerged following that awful day.
“Learn avidly. Question repeatedly what you have learned. Analyze it carefully. Then put what you have learned into practice.”
-Edward Cocker, English mathematician (1631-1675)
There are three broad disciplines investment decisions fall into. Virtually all investors are aware of one of them, fundamental analysis. Many are also aware of a second financial discipline, technical analysis. However, very few investors are aware of the third discipline, sentiment analysis.
Even fewer utilize all three disciplines in their investment techniques.
The reality is these disciplines combine to create the current market price, and if you are looking at just one thing, you are likely to miss some major component to the markets. In this update we take a look at one important factor in each of these realms that has caught our attention.
The most traditional discipline of the three is fundamental analysis. It’s what is taught in business school, and it is what most investors primarily utilize when making their investment decision. Investopedia defines fundamental analysis as, “a method of measuring a security’s intrinsic value by examining related economic and financial factors”. Examples include the state of the economy, industry conditions, company financials, and a company’s management. But again, if you study just fundamentals, then you are likely missing some major pieces to the markets.
This reality can be proven at any given second because fundamentals change, on average, much slower than price does. By that definition alone price cannot be solely driven by fundamentals, otherwise it would be dead in the water when the fundamentals weren’t changing. The reality is prices are moving all the time because of peoples’ expectations and/or thoughts, and that is no longer in the realm of fundamental analysis. Have you ever owned a stock and watched as an earnings report hit the wire? Revenues were off the charts, profits were off the charts, and the outlook was amazing, only to watch as the stock fell in price? This happens all the time, and cannot be explained by fundamentals alone so we also look at two other financial disciplines.
But let’s not confuse fundamentals not being the holy grail with them not being important. Fundamentals do matter, and one thing we are watching right now is the inverted yield curve.
The Fundamental Clock is now Ticking: The Yield Curve Inversion
You can’t call yourself an investor and not know that the yield curve has recently inverted. It’s all over the news and has historically been a major fundamental warning sign as there has never been a recession that didn’t first see at least some portion of the yield curve invert.
In other words, it has a perfect record of predicting a recession (although the statisticians in the room would point out there have only been 10 instances since 1950 and 5 since 1975, so the sample size is extremely small). Let’s just assume, though, this time is not different, and since a vast majority of the yield curve has inverted, the clock is now ticking toward a recession.
So what does that mean for the stock market?
Bank of America points out the average time between a 2 and 10 Year inversion and recession is 16 months. But, the dispersion is wide. Over the past 5 recessions the shortest time frame from inversion to actual official recession (2 consecutive quarters of GDP contraction) was 14 months (the 2000 stock market top and 2001 recession), but the longest has been 34 months (1998’s inversion and 2001 recession).
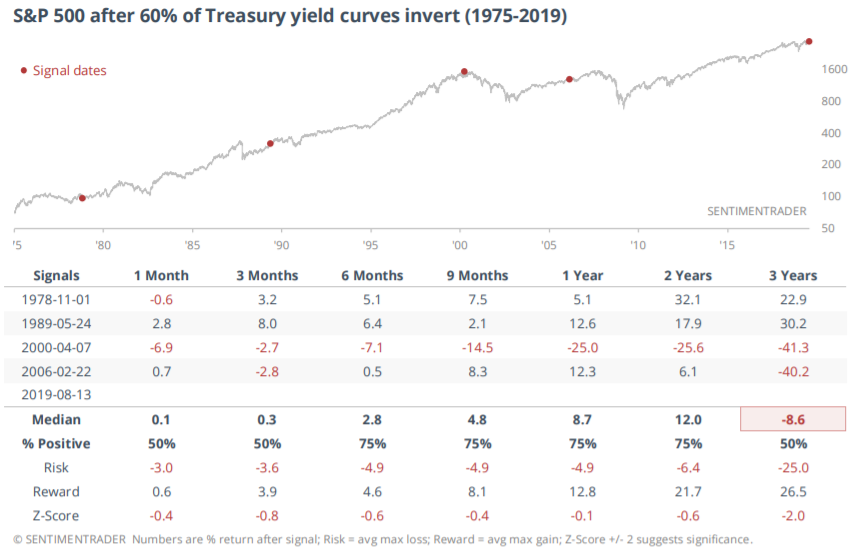
To make things even more unpredictable and convoluted, the stock market’s reaction is similarly as disperse. The chart below reveals prior periods when at least 60% of the Treasury curve inverted going back to the late ’70s.
The 1978 and 1989 inversions offered great 2 and 3 year returns, but getting there was a roller coaster. However, the two more recent inversion episodes resulted in more dire longer term results, with generational 3 year drawdowns of 40%+.
We think the lesson here is you cannot make investment decisions around fundamentals alone. After all, which fundamental data point from the table above would you choose? Would you choose the bullish one year 1978 or 1989 post-inverted yield curve returns, or would you choose the post-inversion 2000 and 2006 negative 3 month returns as your guide?
The yield curve has inverted and that probably means a recession will come at some point, but that does not mean the stock market won’t continue to rise for some unknown period in the future. This is but one small piece to the super complex stock market, and making a decision based solely on the yield curve seems silly to us.
Let’s look at the pressing issues in the other two finance disciplines.
What we are Watching Technically: A Break Out of the August Range
In our last ‘Insights’, “The Price is Always Right”, we discussed price and how price is a major component to what we look at when making our buy and sell decisions. The reason is we believe all of the fundamental data, the first discipline, is largely embedded in price already. Why spend so much time and effort on fundamentals if focusing instead on the technicals already includes the fundamentals? That seems like a more efficient use of one’s time to us.
The study of price, otherwise known as technical analysis is defined by Investopedia as, “a trading discipline employed to evaluate investments and identify trading opportunities by analyzing statistical trends gathered from trading activity, such as price movement and volume.” When bets are placed on the future of a security, for whatever reason, it is reflected in price. Examples of technical analysis include trends, momentum, relative strength, and supports & resistance levels.
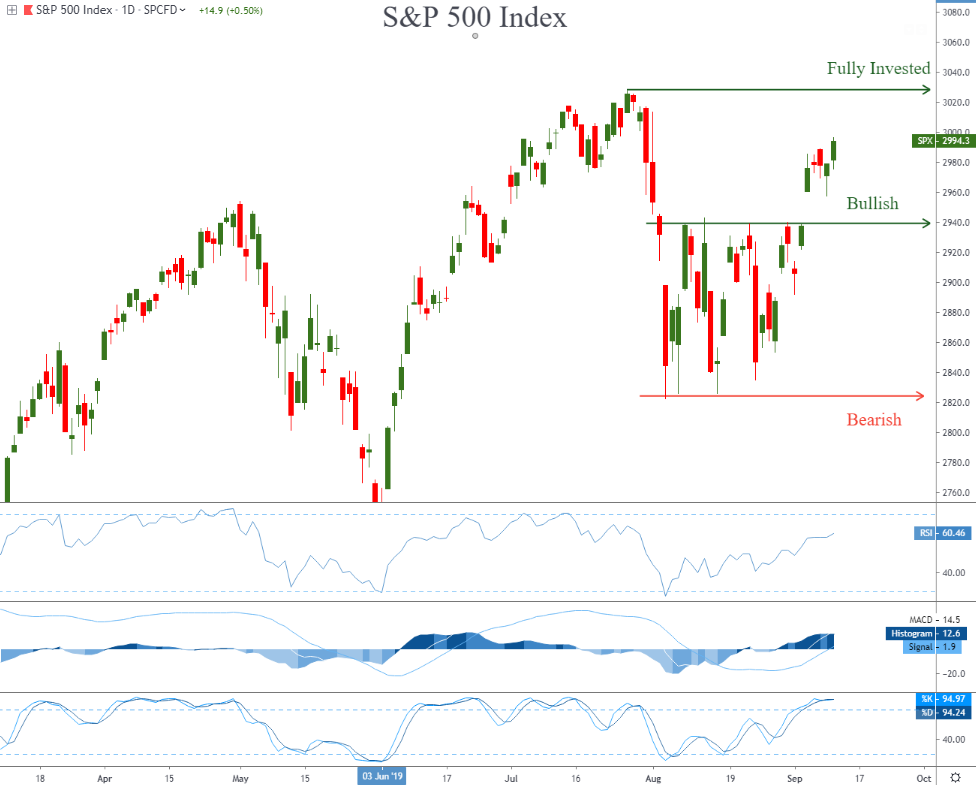
An update to the chart discussed in our last ‘Insights’ is shown below. The great thing about this chart is the inverted yield curve is already included in it. In fact all known information as well as expectations are baked into this chart of price!
In our last issue we pointed to two levels that would get us more bullish as well as more bearish. Since then price has moved above the point of being “more bullish” and as a result we have decreased our cash exposure to around 25% (down from 35%). A move back into the range, and certainly below the “Bearish” level would have us back to 35%+ cash, but a continued move higher from here would have us continue to decrease our cash exposure.
We don’t need to complicate things with all these scenarios and what ifs around the yield curve, price will show us the way in whatever scenario plays out and right now we are marginally bullish as long as that $2850-$2930 August price zone is not revisited.
An Update on Sentiment: Mixed Messages
Sentiment analysis is the third prevalent pillar of the financial markets, and it is the least understood.
Sentiment analysis is defined as, “the overall attitude of investors toward a particular security or financial market. It is the feeling or tone of a market, or its crowd psychology, as revealed through the activity and price movement of the securities traded in that market.” Examples include surveys, margin loan levels, hedging activities, and market breadth.
Sentiment is an interesting study because the majority of the time there may not be much that sentiment is telling us, as it is very subjective by nature. However, sentiment extremes tend to make their appearance just at the right time, typically when market trends are at or near extremes themselves. In other words, sentiment can help raise red flags, especially near market tops and bottoms.
The problem with sentiment, on the other hand, is that it is highly subjective and tough to measure across time, cycles, and generations. The good news is, price also is inclusive of sentiment as people’s overall attitudes toward the market are already reflected in the prices that are agreed upon.
Sentiment red flags were raised and discussed most recently in our July 23 ‘Insights’ titled, “Feeling Sentimental”. In that issue we discussed the % of sentiment indicators we follow showing excess optimism, which was over 40% at the time, raising a red flag the market was overbought. That week the market topped as we remain below those levels still today. So, in that case, the extreme sentiment readings indeed did help prepare us for an eventual change in the direction of price.
For more information on sentiment and how we use it you can check out our previous publications including June 11, when we recognized all the negative sentiment in the media that just wasn’t showing up in price, in our March 30, 2018 issue as breadth was deteriorating as the market rallied, ultimately resulting in that fourth quarter’s 20% decline, and finally back on November 10, 2017, when we dove into sentiment, discussing a plethora of different sentiment signals we follow.
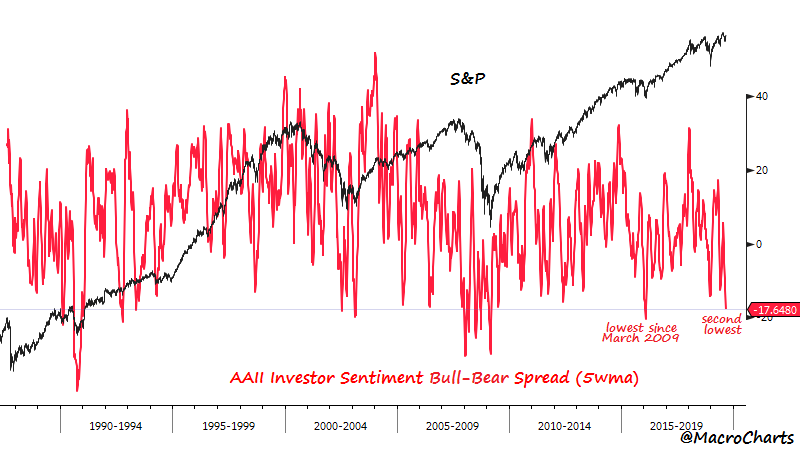
The chart above tracks a popular and long running survey of a large group of investors known as the American Association of Individual Investors. This chart measures the spread between those that answer the survey bullishly less those that answer it bearishly, revealing that a majority of members who answered the survey recently are bearish, with a net 17% bearish response. This is one of the lowest readings ever!
This data is only useful in context, though, and the history of the survey’s results provides that much needed context. This history suggests this indicator to be generally contrarian in nature, translated to mean when the members are net bearish, that typically aligns more with market bottoms than market tops, and when the cohort is net bullish, some sort of market top is typically being formed.
This is not always the case, though, and here in lies some of the subjectivity of the survey and issues with sentiment in general largely discussed in that July 23 ‘Insights’. The people that are members today are not the same ones that were members 30 years ago, adding some complexity to the consistency of the timeline. In addition it’s entirely possible the membership of AAII has aged along with the service, changing the demographic and potentially the outlook along with age. There has been a net trend toward bearishness since the early 2000s after all, which would be an interesting case study in and of itself.
Still it is probably a meaningful data point that this cohort is as bearish now as they were at the lows of 2015 and the lows of December of last year, both times which did align with significant market bottoms. Thus, we should give this survey a bullish slant as this cohort is indeed more often than not most bearish at market bottoms than market tops. It’s bearishness today skews bullishly for the market’s potentials.
Again, the great thing about technical analysis is the AAII cohort’s opinion is already included in price. If price continues higher from here, it’s likely that all those pessimists had already sold. But if it continues lower from here, then it’s likely one of those times when this cohort correctly predicted the coming trouble, like they did near the top of 2007 as well as the leading up the the 2011 drawdown.
For now, we will continue to watch price action and let it be our guide. Fundamentals and sentiment can certainly help in your investment decision making, but we think the all-inclusiveness of technical analysis provides much more bang for your “time” buck.
After all, would we make an investment decision based solely on the yield curve inverting? Or, would we buy the market here just because the AAII group is significantly bearish? The answers to these two questions are a resounding “no”. But we would buy this market if it is moving higher and sell this market if it is moving lower.
Invest Wisely!
Our clients have unique and meaningful goals.
We help clients achieve those goals through forward-thinking portfolios, principled advice, a deep understanding of financial markets, and an innovative fee structure.
Contact us for a Consultation.
Neither the information provided nor any opinion expressed constitutes a solicitation for the purchase or sale of any security. The investments and investment strategies identified herein may not be suitable for all investors. The appropriateness of a particular investment will depend upon an investor’s individual circumstances and objectives. *The information contained herein has been obtained from sources that are believed to be reliable. However, IronBridge does not independently verify the accuracy of this information and makes no representations as to its accuracy or completeness. Disclaimer This presentation is for informational purposes only. All opinions and estimates constitute our judgment as of the date of this communication and are subject to change without notice. > Neither the information provided nor any opinion expressed constitutes a solicitation for the purchase or sale of any security. The investments and investment strategies identified herein may not be suitable for all investors. The appropriateness of a particular investment will depend upon an investor’s individual circumstances and objectives. *The information contained herein has been obtained from sources that are believed to be reliable. However, IronBridge does not independently verify the accuracy of this information and makes no representations as to its accuracy or completeness.


