Despite relatively good economic data, a record high stock market, and low unemployment, the Federal Reserve will likely cut rates at their next meeting on July 30-31. Why would they do this? And how should we think about the potential impact from the most interesting rate cut in the world?
Market Microscope
What will happen if the Fed cuts rates?
“Everything is paradox. The danger is in one-dimensional thinking.”
-Lesley Hazleton, author
As wealth managers, we get quite a few questions. By far the most common question is “What’s the market going to do next?”
Our canned answer is that we don’t know and we frankly don’t care. We just want our clients to make money. Plus, if we are completely transparent, we have to be aware that markets are too complex to narrow movements down to just one or two catalysts.
But sometimes it becomes obvious that there IS a primary catalyst at work in the financial markets. Today, this catalyst seems relatively obvious…the Fed.
The narrative we hear almost daily from various “news” outlets, and have for basically the past 10 years, are predictions about what the Fed will do next.
Will the Fed cut rates? Will they increase rates? Then we hear the pundits on the news channels give their wild ass guesses well-informed analysis on what will happen next.
But the fact is, the Fed is very important right now.
Trade tensions and politics have pushed the Fed into a very interesting position. There has been increasing anticipation by market participants that they should cut rates by at least 0.25% at their next meeting. But economic data suggests a cut might not be warranted. (The Fed is supposedly non-political and data-dependent…we shall see.)
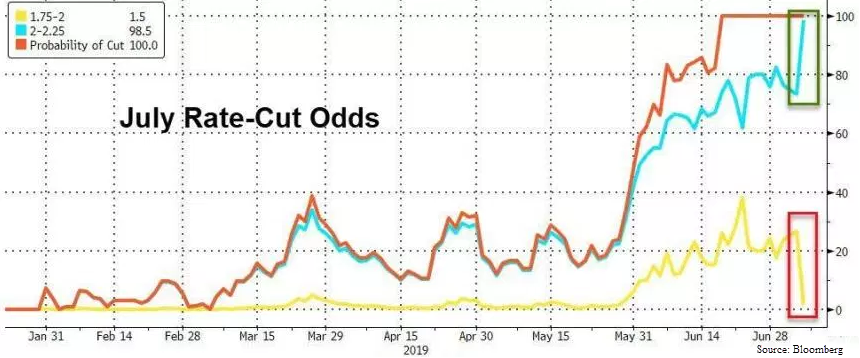
As shown in the first chart, courtesy of Bloomberg, market participants are definitely anticipating a cut. Currently, the odds of a rate cut at the July 31st meeting stands at 100%. Yes that is correct, the market is pricing in a 100% chance of a rate cut later this month.
In our view this is incredibly strange behavior by the Fed. So what would possibly make them cut right now, and what might be the impact?
There are two primary schools of thought on why the Fed may cut rates by 0.25% in late July:
- They made a mistake by increasing rates too far last fall.
- The Fed should cut as a preventative measure against a potential economic slow-down.
Each of these thoughts could fill hundreds of pages of analysis, something we will not embark upon (thankfully).
In fact, to us the reasons behind the move just don’t matter that much. Reasons don’t impact our clients’ net worth. What’s more important is to understand the potential impact from a rate cut.
To understand this, let’s look at it in a few different ways. First is to understand if there might be a direct cause-and-effect relationship between rate changes and the stock market.
One-Dimensional Thinking
One approach is to think about market relationships in a one-dimensional, or linear, way. Linear thinking looks at the world through if-then statements. If a 2-year-old walks into the corner of a table, then he begins to cry. Cause-effect.
Let’s start with a common narrative that the rate increase last fall by the Fed led directly to the 20% market decline in Q4. This would fit nicely into the CNBC news feed. Headlines read “Markets Fall on Fed Rate Increase”. Simple, straight-forward, easy to understand. The Fed caused the market to decline.
We could then assume that the Fed “pivot” in late December to signal a more dovish stance also directly led to the market’s subsequent rise to new highs that we just experienced.
But do we know that this was the reason for the decline? After all, the Fed doesn’t explicitly buy stocks outright (yet). Why would a Fed Funds rate of 2.5% be too high, but 2.25% wasn’t? That extra 0.25% caused a 20% drop in US markets? Why wasn’t 1.75% too high? Or 4%??
The total value of the US stock market is roughly $35 Trillion. This would mean that the last 0.25% rise resulted in $7 Trillion eliminated from US markets alone?? This doesn’t even factor in international markets, fixed income markets or currency markets.
One-dimensional thinking can work at times. The Fed is juicing the markets, so let’s buy stocks. After all, it’s worked since 2009.
But markets are more complex than that. In complex systems, one-dimensional thinking almost always leads to a misunderstanding of the situation. Yes, it makes us feel good to explain events in a direct and easy way. But inevitably this type of thinking will cause a tremendous amount of overconfidence by simplifying the understanding of very complicated market dynamics.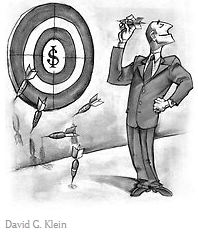
Too much confidence when dealing with financial markets is the kiss of death. Markets simply do not operate in direct cause and effect ways, despite how much it might seem they do during certain periods of time. They do not abide by mathematical equations. Quite simply, markets are not physics.
So to base investment decisions on the next Fed move is an act of over-confidence. But that is exactly what is happening right now by some of the “smartest” investment professionals in the world, particularly those at large institutions.
Let’s get back to our assumption that the Fed increase led to the market decline last year. Under this assumption, let’s take this a linear step forward.
If Fed rate increases lead to a declining stock market, then a Fed rate decrease should lead to a rising stock market, right? After all, that’s what the market assumptions have been so far this year, and without question is the case in July 2019.
But does that assumption hold up? Let’s take a look.
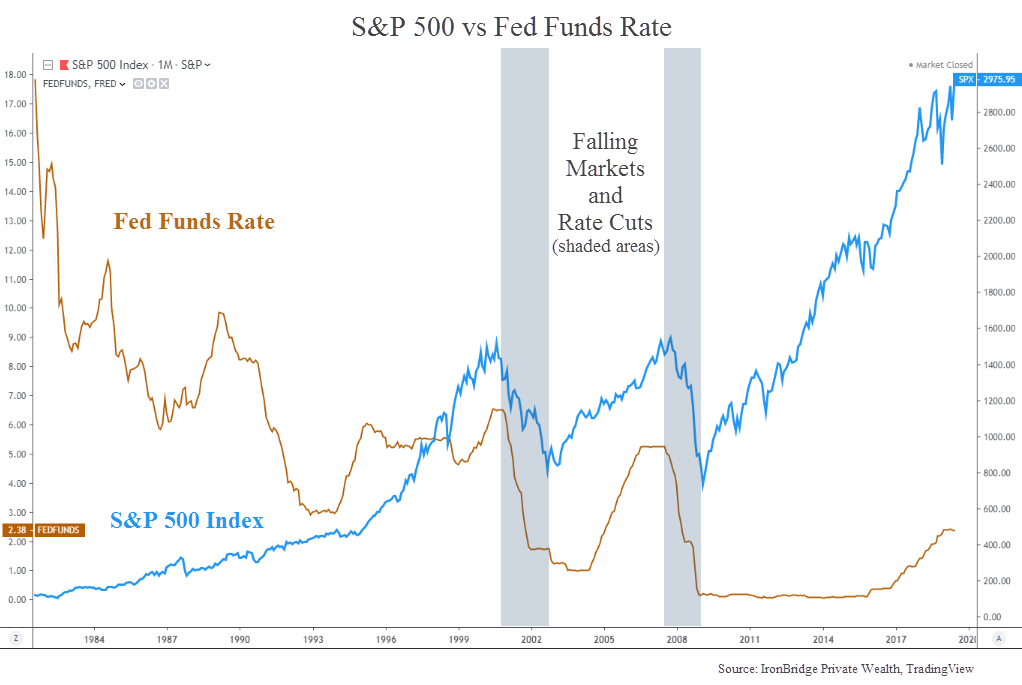
The chart below shows the S&P 500 Index in blue and the the Federal Funds rate in orange.
The two shaded areas show the last two times the Fed cut rates. From almost the exact point of the first rate cut, stock markets began major declines. Not exactly great times to be invested.
But prior to 2008, there was no noticeable correlation between stock market performance and the Fed Funds rate.
While the Fed was in a generally declining rate environment throughout the 1980’s and 1990’s, there were periods where interest rates rose quite dramatically with no real effect on stocks.
So should we assume that a rate cut is good, as the market is assuming right now? Or does this mean that a rate cut is bad, like what happened in 2000 and 2008? Or should we assume that it doesn’t really matter all that much like the couple of decades before that?
To assume it is either good or bad misses the point. The point is that it just ain’t that simple.
Two Dimensional Thinking
So let’s start to think in a two-dimensional fashion. Maybe Fed rate changes aren’t about directly impacting stocks, but impacting the attitude of market participants to indirectly influence stock prices.
Maybe the last 0.25% rise was simply the straw that broke the camel’s back. After all, the stock market is a game of confidence. Maybe market participants started to lose confidence in the Fed after the last quarter-point move, and started to sell.
So let’s take a look at how confidence might look relative to the market. Increased confidence would then LEAD the market higher, while decreasing confidence would precede a market decline.
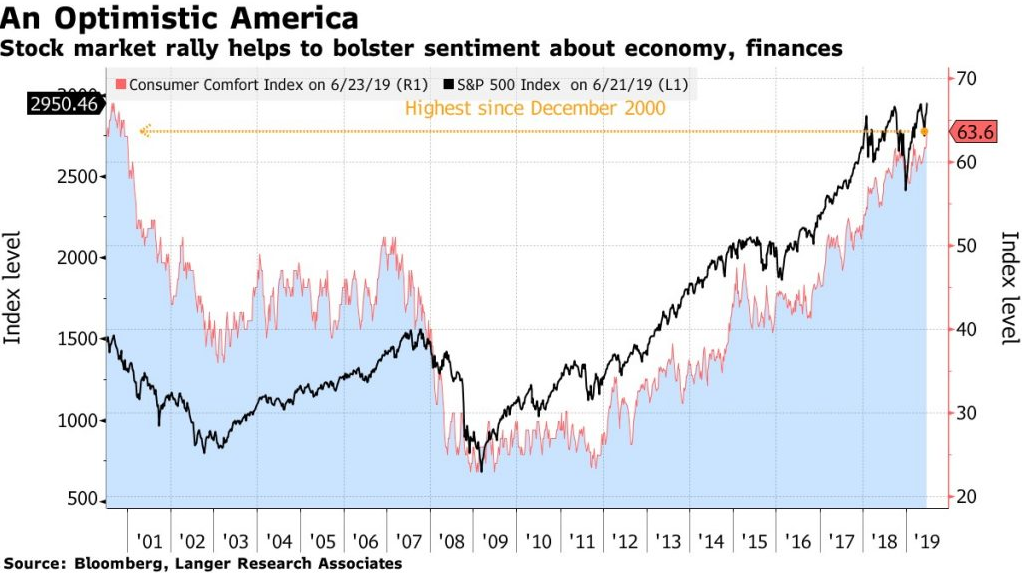
The first chart below shows the confidence consumers have in their outlook for the economy and their own personal finances (red line with blue shading), compared to the S&P 500 Index (black).
There is obvious correlation between the two, but beyond that there is no real predictive value in this chart. Is the stock market good because consumers feel confident? Or do consumers feel confident because the stock market is good? Or are they both changing due to some completely separate reason?
Okay, so that didn’t really help. Instead of consumers, what about actual investors?
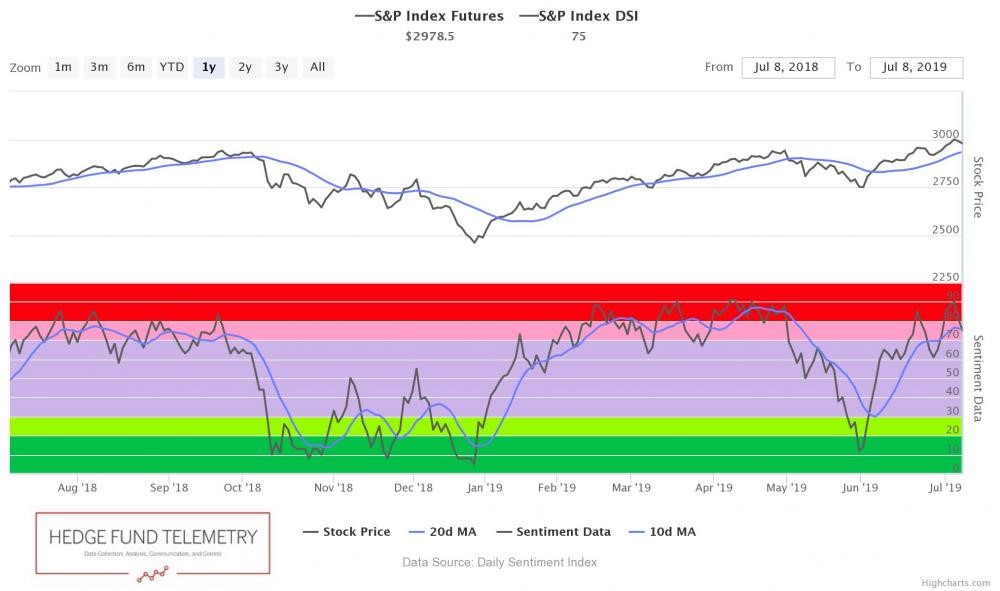
The next chart is from Thomas Thornton at Hedge Fund Telemetry (one of our favorite research partners), and it looks at the sentiment of actual market participants. The S&P 500 is shown in the top half of the chart, while sentiment data is shown on the bottom.
When the bottom half of this chart is in the red-zone along the top, sentiment is high. It is very low when it is in the green areas along the bottom. Once again, there is obvious correlation between the two indicators. This chart shows that like consumers, investors tend to move along the same progression as the market itself…high confidence when the market is up and low confidence when the market is down. Again, are confident investors making the market rise, or does a market rise make confident investors?
These are what are called “coincident” indicators. They tend to move in the same direction at roughly the same time, but have no reliable predictive relationship between the two.
If anything, we simply need to be aware that overly confident investors tend to be present near market tops, while overly pessimistic investors tend to be more plentiful near bottoms.
So the two-dimensional thinking that rate cuts are designed to influence investor attitude doesn’t really help us understand what might happen, so let’s take it one step further.
Three Dimensional Thinking and Beyond
A more likely scenario is that the Fed rate cut is meant to influence the large institutional investors, not individual investors, by signalling to these institutions what the Fed wants investors to think the reaction of the market will be.
Why else would the language from Fed meetings and communications be so closely monitored?
To predict market movements following a Fed move under this thought process, we then would need to predict the intent of the Fed, the anticipated reaction of investors, the actual reaction of investors, and also what institutional investors might do in response!
Good luck with that.
As crazy as it sounds, this analysis is happening right now in many conference rooms across the globe. How many highly-paid research analysts at Goldman Sachs and UBS and Merrill Lynch and Wells Fargo are spending time trying to guess what will happen if the Fed does or doesn’t cut rates? Are they playing three-dimensional chess, or are they over-simplifying things?
If they’re playing chess (3-D or even 4-D), then they are simply guessing. If they are over-simplifying, they are engaging in reckless behavior.
We can try to guess all we want, but our guesses don’t matter. The predictions by the thousands of highly-paid analysts don’t matter.
Once the reaction happens, there will be people that get it right. And there will be just as many people who get it wrong. And most will do absolutely nothing in their client portfolios regardless of whether they are right or wrong.
This gets to one of the largest and most fundamental flaws in the investment industry. It doesn’t matter if you are right or wrong. It only matters what happens to the bottom line of your investment portfolio.
So What Might Happen?
Prices will change over the next month, quarter and beyond. Maybe earnings will move prices up. Maybe not. Maybe the Fed will cut 0.25% and the market will go up 20%. Maybe it will go down 20%.
In our June 11th Insights report titled “Climbing the Wall of Worry” (read it HERE), we mapped out three potential scenarios to watch for: New Highs, Further Downside then New Highs, and the Path of Maximum Pain. Since then, the second scenario has been eliminated. Now it appears that there are two primary outcomes.
The immediately bullish scenario is that the market is coming out of a cyclical bear market that lasted roughly 18 months from January of 2018 to July of 2019. That effectively means that the choppiness we’ve seen over the past 18 months served to wipe the slate clean, allowing for the next leg higher in stocks.
If this scenario starts to play out, then the market is likely to be stronger and more persistent than almost anyone sees possible right now.
The other scenario would just as equally surprise investors. This path would be much different, and would cause all sorts of distress in the markets. We have already seen a new all-time high in the S&P 500 Index over the past few weeks. What would follow in this scenario would initially be a 25% decline (plus or minus), to undercut the lows from last December. Once investors were convinced that the next major bear market was imminent, we would see a massive rise to new all-time highs once again.
The market tends to surprise many people. Either of these two scenarios would have that characteristic. Of course, it could also take many different forms than that, but these patterns would be very consistent with previous markets moves from different points history.
Will the Fed be the catalyst to push the market one way or another? Maybe. The timing sure seems to be lining up well. But the market is going to do what it will. And we won’t know for sure in real time which catalysts are important and which aren’t. So we don’t care to think about that.
Instead of spending time trying to develop a successful prediction mechanism, we think it is much more valuable to spend time mapping out specific actions for what to do if prices move up, down or sideways.
Price is what matters. Not opinions.
Invest wisely.
Our clients have unique and meaningful goals.
We help clients achieve those goals through forward-thinking portfolios, principled advice, a deep understanding of financial markets, and an innovative fee structure.
Contact us for a Consultation.
Neither the information provided nor any opinion expressed constitutes a solicitation for the purchase or sale of any security. The investments and investment strategies identified herein may not be suitable for all investors. The appropriateness of a particular investment will depend upon an investor’s individual circumstances and objectives. *The information contained herein has been obtained from sources that are believed to be reliable. However, IronBridge does not independently verify the accuracy of this information and makes no representations as to its accuracy or completeness. Disclaimer This presentation is for informational purposes only. All opinions and estimates constitute our judgment as of the date of this communication and are subject to change without notice. > Neither the information provided nor any opinion expressed constitutes a solicitation for the purchase or sale of any security. The investments and investment strategies identified herein may not be suitable for all investors. The appropriateness of a particular investment will depend upon an investor’s individual circumstances and objectives. *The information contained herein has been obtained from sources that are believed to be reliable. However, IronBridge does not independently verify the accuracy of this information and makes no representations as to its accuracy or completeness.

