The past six months have been good and bad to both bulls and bears. Bullish investors have participated in an amazingly strong 2019, but had to tolerate a loss of over 20% of their capital in Q4. While bearish investors were feeling great around Christmas, only to see their pessimism crushed with the markets moving dramatically higher since. In investing, as in relationships, sometimes the best advice is simply to “listen”.
Market Microscope
Good Relationships Start with Good Listening
“When people talk, listen completely. Most people never listen”
-Ernest Hemingway, Author
 As market analysts, we scour through loads and loads of data in order to stay abreast of the daily meanderings of the investment markets. Sometimes it seems like an exercise in futility; other times we are sure we are witnessing a comedy of errors.
One things for certain, through this process we encounter countless opinions, statistics, and prognostications. We also always have the luxury in hindsight to see how things ultimately play out. After all, the markets are just one big history lesson. This is why we like to use charts and graphs so much. They help present this history in a visual, user friendly way.
But perhaps more importantly, they also help to filter out a lot of the noise.
Not only is it our job to sift through all that data and identify those points that seem to make the most sense, it too is our job to ignore a lot of the opinions and statistics and instead “trust” the market itself to tell us what it wants. After all, you can find a statistic (and opinion) for anything these days.
TV stations like CNBC love to showcase the Archie Bunkers of the investment world…stubborn people who think they are always right, and refuse to listen to counter-arguments. Why? Because they sell more commercials than someone who says they don’t know what is going to happen.
We view these Archie Bunkers as foolish. One must be able to change course and adapt as circumstances change. One should NOT remain gruff and demeaning to the possibilities of outcomes other than what one predicted.
Too much time is wasted trying to predict what the market is going to do. Will it rise, will it fall, will Tesla’s earnings beat, and if so, will the stock react positively (no, and, no as we saw 4-25-19)? To us, this is the exercise in futility alluded to earlier.
Nobody really knows all these answers. Markets are too complex to be predicted with any consistency.
A better approach? To LISTEN to the market. The foundation of our investment philosophy it that it is exponentially more valuable to actually listen to the market rather than all the predictions from the talking heads.
Confirmation bias, discussed multiple times in our own publication, is one of the most dangerous things an investor can fall into.
So instead of searching for only one side of the argument, let’s play a game of “Point, Counter-Point”, and look at two very bullish developments over the past few months along with their counter-points.
Bullish Point 1: The Tech Sector is Leading and Making New Highs
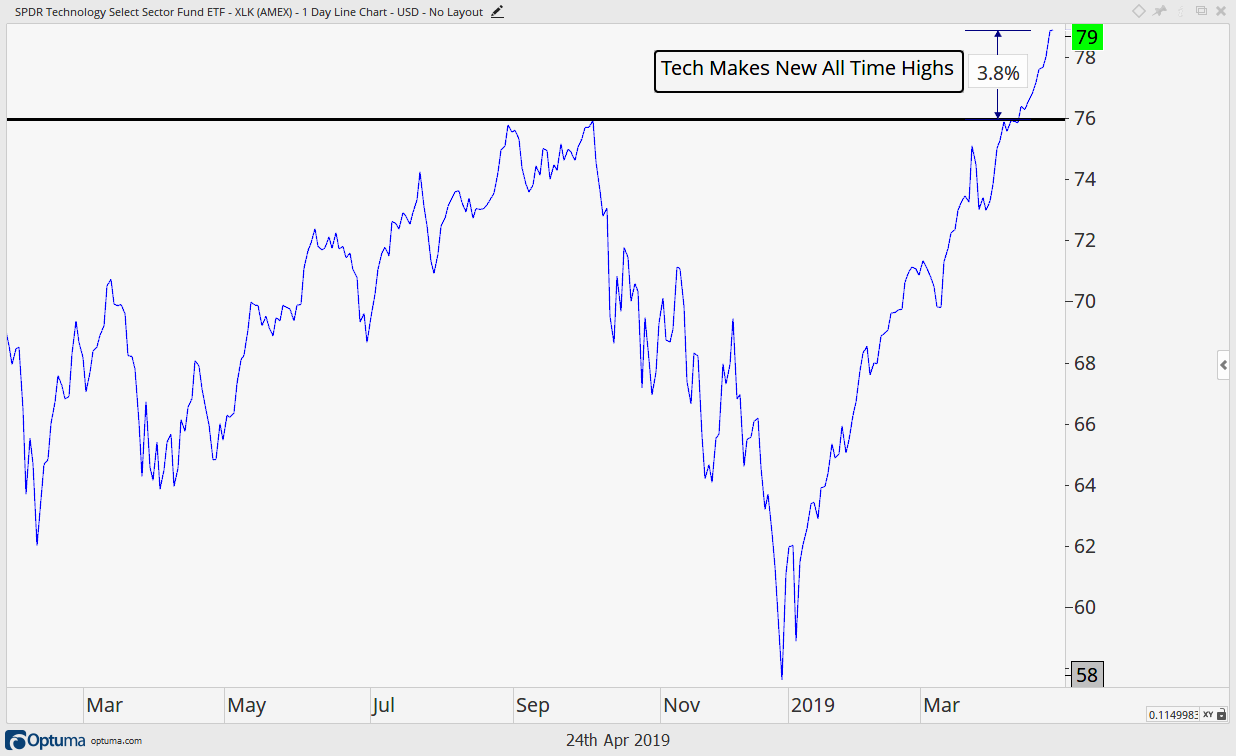
The first chart below shows a very positive development. The technology sector, which is 20% of the S&P 500 by weight, just made a new all time high price, helping to take the S&P up to new highs the week of April 22, 2019.
Cyclical areas of the market are leading the way is one of the key signs of an overall healthy market. In February and March of last year, despite a quick 12% selloff in the S&P 500, the more aggressive areas of the market were consistently scoring well on our investment screens. Technology and Consumer Discretionary stocks, which are more sensitive to changing economic conditions, were the leaders.
Perhaps coincidentally (perhaps not), the market had a relatively short and shallow pullback, and ultimately moved to new highs last September. This was a textbook case of how listening to the market proved much more valuable than listening to those who were concerned about the US/China trade tensions. Risk appetite remained high, and markets ultimately moved higher.
If we compare early last year to when the market was making new all-time highs in September, these tech leaders became laggards. Sectors such as Consumer Staples and Healthcare became the leaders, which was a sign that market participants were skeptical of the rise in stocks and were de-risking their equity exposure.
The switch from aggressive areas outperforming to defensive areas outperforming was an excellent sign that trouble may occur, and an excellent signal that we should make sure our risk management strategies are ready to be implemented. This is ultimately what happened, as the S&P fell over 20% from peak-to-trough during a difficult Q4.
Once again, listening proved to be the right tactic in our relationship.
Today, and for most of the past 4 months, the leading sectors have been Technology, Industrials and Consumer Discretionary. These are the three most aggressive sectors within the S&P 500, and have historically been the most economically sensitive.
Seeing these areas do well are not a guarantee that the market will continue higher, but it is a positive sign nonetheless.
 Counter-Point 1: Market “Breadth” is notably weak, with many large companies far from making New Highs
As Lee Corso would say on College Gameday, “Not so fast my friend!”
The tech sector is making new all time highs, and that is great news. Unfortunately, many large companies are not receiving near the attention the tech sector as a whole is receiving. Additionally, even stocks within the tech sector are showing some weakness.
Because it is a cap weighted index, when the larger companies are doing well, the index, by a function of its cap weighting also does well. (A “cap-weighted index”, sometimes called a “market-value-weighted index”, is a stock market index whose components are weighted according the total market value of their outstanding shares.” – Investopedia) Essentially, The bigger the stock, the more influence it has on the index.
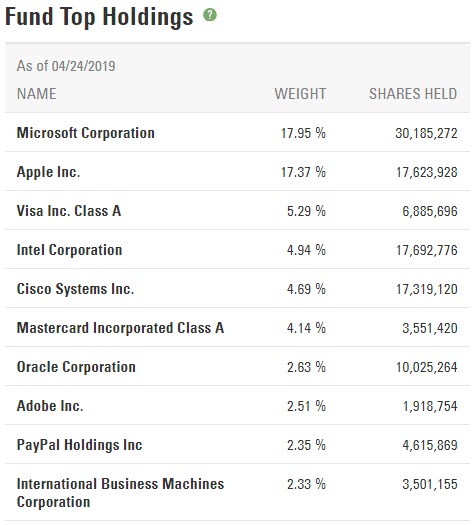
The chart below shows the top holdings in one of the most popular sector funds, the Technology sector ETF (ticker XLK). Microsoft and Apple make up a whopping 35%! As long as these two stocks perform well, the odds are high XLK will too, and that’s exactly what has happened with Microsoft up over 10% above its Fall 2018 high and up over 25% thus far in 2019. For reference, Apple is up over 30% in 2019!
The next 3 holdings in XLK are Visa (up 22% in 2019), Intel (up 25% year to date), and Cisco (up 32% in 2019), collectively making up another 15% of the Index. All together the top 5 holdings are 50% of the sector ETF, and with this sector 20% of the S&P, it means these 5 stocks are just 1% of the S&P 500’s companies (5/500) but they represent 10% of its daily swings up and down.
This sword cuts both ways. If these stocks ever start to falter, we should expect XLK to struggle as well as the S&P.
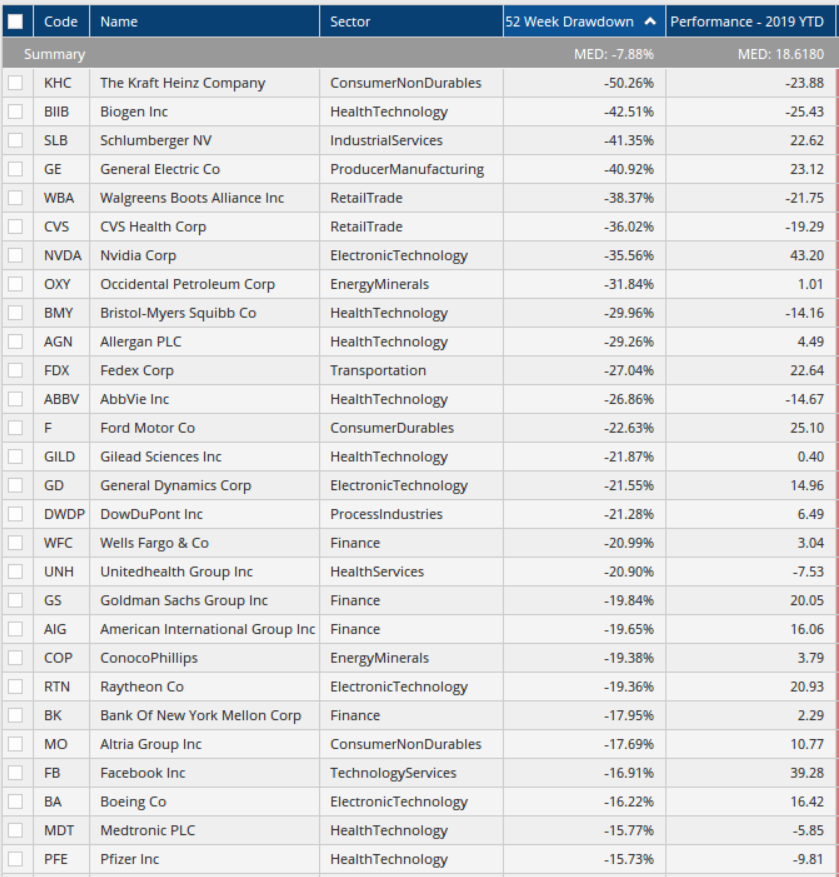
To expand on this breadth observation, the graphic below shows 20 of the top 100 largest S&P 500 companies. The key differentiator is that these stocks all remain a full 15%+ below their Fall 2018 price peaks (the graphic is filtered by distance from recent price high). They are not participating in the recovery near as much as some of the other companies out there.
The 52 Week Drawdown column shows how far these stocks have fallen from their September 2018 price highs. Additionally, at the top in gray shows that the average S&P 100 stock is still 7.88% below their all-time highs.
It’s tough to get too excited about the market getting close to new all time highs when the likes of FedEx, Walgreens, and Kraft are performing so dismally.
Surprisingly, some of the “new economy” stocks. like Nvidia and Facebook, are also in this category. Nvidia is up 43% thus far in 2019, yet it remains down a massive 36% from its all time high, remaining in a bearish trend.
If we were to try to draw a conclusion to this it’s that pockets of the market/economy remain strong while other pockets (Healthcare, Financials, Consumer Products, and some Transports) remain rather weak.
When the markets don’t have a lot of participation it’s known as “weak breadth”, and weak breadth seems to be what we are seeing right now during this move higher.
Ideally, we would like to see market breadth improve, which could provide fuel for the next move higher in stocks. However, as it exists today, we take this as a negative for the markets, and signals that our risk management strategies should once again be ready to be deployed.
Bullish Point 2: The Nasdaq and S&P Have Made New All Time Highs
Bottom line, new all-time highs are bullish. Price is the judge and jury (much like our significant others). It doesn’t matter whether you think the market should be at all-time highs or not…they are at all-time highs. Period.
Similar to the Technology sector discussed previously, the Nasdaq Composite Index has made a new all time high, and many investors look at this as a positive since that index is typically indicative of the “growth” aspects of our economy.
The chart below shows the Nasdaq’s performance over the last year. Looked at in a silo, this is potentially bullish price action as all the drawdown from last year has been depleted with a 31% move off the lows. A series of higher price highs is the ultimate sign of the start of a “bullish” trend.
Once again, technology stocks continues to power the market higher.
We’ll reiterate…new highs are bullish, and should be taken as such.
 Counter Point 2: Small Caps, Lumber, and Copper, all considered Leading Indicators, are Not Confirming the New Highs
The Nasdaq may be making new all time highs, but technology stocks are not the only part of the market that can give clues about the future direction of prices. Other growth segments of our economy are not showing the same strength.
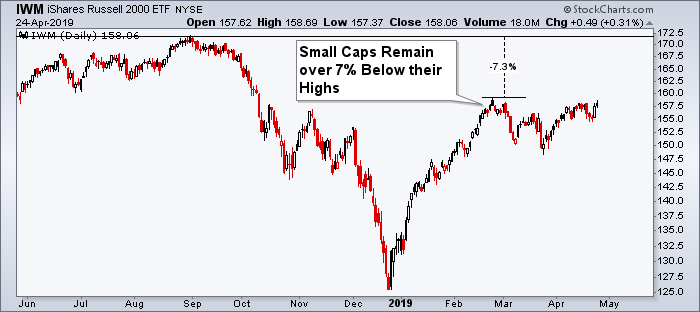
The small-cap Russell 2000 index is a great example as it helps track the performance of the U.S.’s small cap companies. These smaller, more domestically focused firms are also typically thought of as “growth” since they on average grow faster than the much larger large cap companies.
The problem is they have not performed near as well as the Nasdaq, tech, or some other larger cap dominated segments during this bounce back. Even worse, those stocks have moved net sideways since mid-February while the larger cap indices continued their march higher.
Coming out of the pullback in early 2018, small caps led the way, and were one of the first areas of the markets to make new highs. As seen in the chart above, that is definitely not the case today.
We discussed earlier about the heavy weighting of the top holdings in XLK. The Nasdaq has the same issue. The top 3 stocks in the Nasdaq Composite are Microsoft, Apple, and Amazon, comprising a whopping 23% of its movements. These 3 stocks are just 3 out of 2,639 companies yet they make up almost one fourth of the entire Index. These three stocks have performed remarkably well during the first part of 2019, lifting the Index to new all time highs.
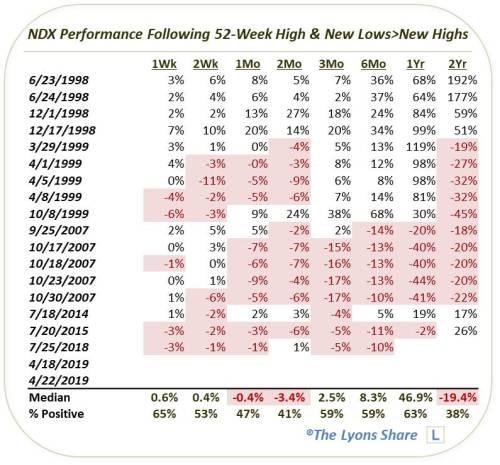
But if we look one level deeper, many Nasdaq stocks are actually struggling. In fact, the past two weeks there have been more 52 week price lows than 52 week price highs of Nasdaq components. The chart below, from Lyons Share, outlines all the other times this has occurred in the Nasdaq.
Notice, over the short term this has resulted in largely flat to negative returns, and over the long run it is a mixed bag, courtesy of the tech bubble. Many of these signals occurred in 1998 and 1999, resulting in a 6 month to 1 year timeframe significant outperformance, but then followed by a significant underperformance 2 years later.
If we exclude the tech bubble, then the overall results are largely negative. However, if we exclude this period we also leave much fewer data points in our sample size, minimizing the statistical value of such findings.
So, do we focus on the short term statistics, the long run statistics, both of them, none of them, including the tech bubble, or excluding it? A case of futility perhaps?
Contrast the Nasdaq’s top 3 positions of 23% to the Russell 2000 index ETF (ticker IWM), which has its top 3 holdings (FIVE, ETSY, CREE) making up just 1% of its movements. The top three holdings in the Nasdaq are over 20x more important than the top 3 holdings of the Russell 2000. Let’s let that sink in.
From a breadth perspective, the Russell 2000 is much more representative of the “average” stock. Shown previously, indeed its 7% distance from its high is similar to the S&P 100’s current 8% average distance discussed earlier. The Cap weightings seem to once again be playing a major part in the market’s rebound.
We saw similar declining breadth readings leading up to both tops in 2018. It remains to be seen if a similar result will unfold with the current lack of breadth.
Beyond Equities, even some commodity economic leading indicators are showing us warning signs. Copper, referred to by many as “Doctor Copper” because of its supposed ability to predict economic expansion and contraction, has not seen near the rebound in its price after also falling off the proverbial cliff in 2018.
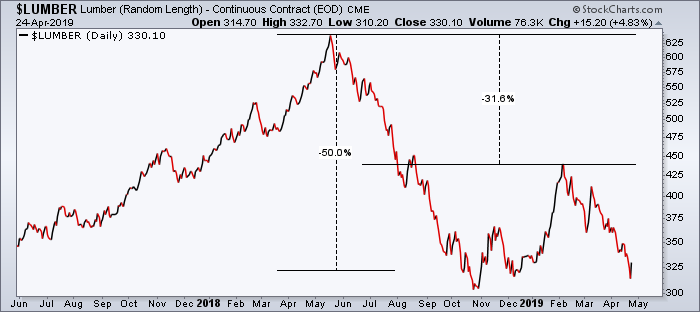
Lumber prices have moved swiftly down after recovering a portion of their massive losses seen post-Hurricane Harvey in 2018. Lumber is a major component of housing and is often looked to as a guide for growth in that industry and beyond.
The two charts below provide reasons to question the positive economic outlook some of the stock markets are suggesting. Some stock indices remain strong, but two commodities, with “leading” potential remain rather weak.
Notice how these two charts look a lot like the Small Cap Index chart above. All three fell in price after topping sometime in 2018, only to retrace a portion of that decline, with Lumber potentially providing the more ominous outlook as its price remains near multi-year lows, down around 50%.
Of note is Copper and Lumber held up to their end of the “leading indicator” bargain as they topped out well in advance of equities. This at a minimum suggests we should pay attention when they aren’t confirming equity moves.
We have offered up these bullish and bearish dichotomies as examples to remind us that trying to predict exactly what markets will do is a futile exercise. There are always compelling reasons to be bullish and always very good reasons to be bearish, and that has not changed today and will likely never change. Although there are certainly risks in the market today, it doesn’t mean we should be avoiding the markets.
But, being aware of the risks does help us better prepare and allows us heightened opportunity to keep our profits in the event we do see another large drawdown event.
The great news for us and our clients is that we don’t have to really care about all of these bullish points and bearish counter points since our systems are designed to capture market returns regardless of the underlying environment.
If the bullish argument for equities continues to win, that will be great, as we are essentially fully invested right now and have been able to participate in the markets recent moves higher. The lack of breadth hasn’t kept the large cap markets from rallying, and our clients will have exposure to that area (as long as it continues).
But if the bearish argument is going to win, that will also be okay by us as our strategies are designed to minimize downside exposure when volatility starts to pick up and protect the profits we gained on the way up.
For now and always, we will keep our ears on the market and try to be the best listeners we can.
And most importantly, we will remember that the market (and our relationship partner) is always right!
Invest wisely.
Our clients have unique and meaningful goals.
We help clients achieve those goals through forward-thinking portfolios, principled advice, a deep understanding of financial markets, and an innovative fee structure.
Contact us for a Consultation.
Neither the information provided nor any opinion expressed constitutes a solicitation for the purchase or sale of any security. The investments and investment strategies identified herein may not be suitable for all investors. The appropriateness of a particular investment will depend upon an investor’s individual circumstances and objectives. *The information contained herein has been obtained from sources that are believed to be reliable. However, IronBridge does not independently verify the accuracy of this information and makes no representations as to its accuracy or completeness. Disclaimer This presentation is for informational purposes only. All opinions and estimates constitute our judgment as of the date of this communication and are subject to change without notice. > Neither the information provided nor any opinion expressed constitutes a solicitation for the purchase or sale of any security. The investments and investment strategies identified herein may not be suitable for all investors. The appropriateness of a particular investment will depend upon an investor’s individual circumstances and objectives. *The information contained herein has been obtained from sources that are believed to be reliable. However, IronBridge does not independently verify the accuracy of this information and makes no representations as to its accuracy or completeness.
