Italian bond yields and Italian bank stocks were pummeled this week, with fears returning of another European banking crisis similar to Greece in 2011. There are lessons when markets turn from calm to extremely volatile in short periods of time. Are markets currently undergoing a Paradigm Shift, or should we expect la dolce vita (the good life) to return to markets?
[maxbutton id=”5″ url=”https://ironbridge360.com/wp-content/uploads/2018/06/IronBridge-Insights-2018-06-01-La-Dolce-Vita.pdf” text=”View PDF” ]
Executive Summary
Global Insights
Last week it was North Korea, this week it is Italian Bond Yields, what foreign country will be the media’s scapegoat next week?
Remember as we turned the calendar from 2017 to 2018 international stocks were all the rage, but we were warning against them because of the currency and other risks they pose. That turned out to be a good call as international stocks are largely down for the year. In addition there remains significant country specific risk as the Italy issue revealed to us this week. Geopolitical risk remains a major concern, but when have we ever not had geopolitical risk?
It seems the real risk is the increased market volatility, which is a significant change to recent years. It seems we all need to reset our volatility expectations.
Market Microscope
In this issue we dive further into what we are considering the beginning of a paradigm shift, where increased volatility may be the new norm. The “littlest” things it seems have been setting the markets off in ways they never would have one year ago.
An extremely low number of companies that are “carrying the team” is one plausible reason for the increased volatility. If one of the top 5 technology companies has a bad day, then it is highly likley the markets as a whole will also have a bad day.
In addition to the increased volatility and low attribution Investor Sentiment remains elevated. After such a volatile period and 10% market selloff, this is rare and could be a sign of investor complacency.
There does not seem to be a wall of worry as investors remain largely bullish and invested.
FIT Model Update: Market Correction
![]()
A recent Investors Intelligence survey reveals that the recent bout of volatility hasn’t really spooked advisors. We could draw the conclusion that market participants remain rather complacent as the survey reveals there is a rather high level of confidence still in the market, the opposite of the “worry” that is needed in order for the market to “climb a wall of worry”.
Recent attribution analysis, also discussed in this issue, shows a rather risky environment where fewer and fewer stocks are carrying the Indices higher. As long as markets maintain such thin attribution, volatility is likely to remain high as there is little to cushion the market’s falls.
Global Insights
No More la Dolce Vita?
European Risks Escalate
Volatility comes in many forms. It usually presents itself quickly, as we have seen many times over the past few months. Nowhere has it been more evident than what is occurring in Italy this week.
Seemingly out of nowhere, stress appeared in the Italian government bond market. For many years, yields on European government debt were negative. This means that someone who purchased a bond for $1,000 (or Euros in this case), were going to receive $990 at maturity. Yes, this means they were guaranteed to lose money on this investment. You may ask, “Why would someone do this?”
The “someone” doing this has primarily been the European Central Bank (ECB). The same way the Federal Reserve embarked on a bond-buying program to prop up US markets from 2010 to 2017, the ECB has been doing the same with European markets. Buyers like central banks are what we call “indiscriminate buyers”. They will buy at any price. The primary reason is to create a false sense of calm, reassuring markets that there is nothing to fear and all is well.
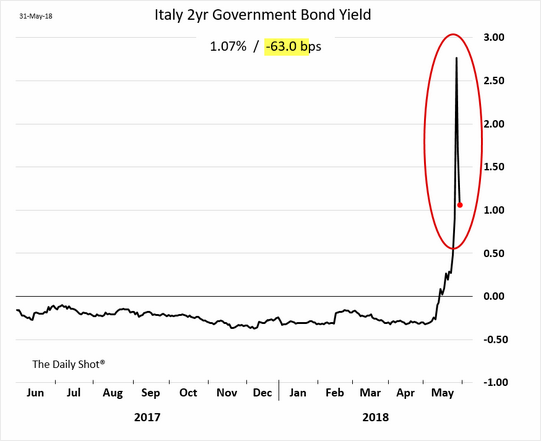
Two charts below from the Wall Street Journal show what happens when indiscriminate buyers get overwhelmed by market forces. The first chart below shows the yield on 2-year Italian Government Bonds. They went from negative 0.35% to almost 3.00% in a matter of weeks. This would be an enormous price move in government bonds if it happened over the course of many months.
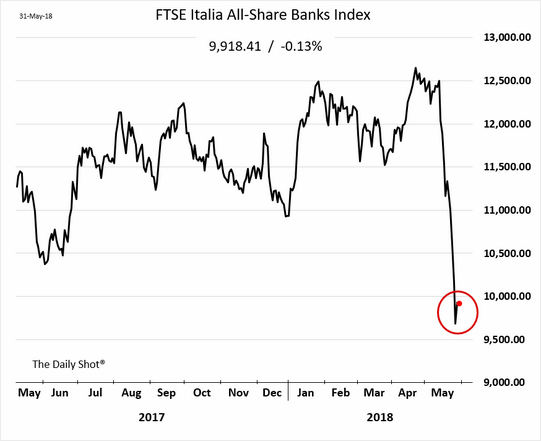
The next chart is an index of Italian bank stocks. These stocks were at recent highs in early May. By the end of May they had fallen 23%, mostly over the past week! The red circles on the charts show that buyers have shown up in the Italian bonds, but not in stocks. Why?
The answer is incredibly simple…the Italian government purchased €500,000,000 of Italian government bonds this week.
What Caused This?
The common reason cited for the explosion in yields and dramatic drop in Italian bank stocks was that the Italian government will be led by coalition of two anti-establishment political parties. The fear is that the new government does not appreciate the Eurozone’s mission of uniting the European continent under one monetary union, and the risks of another Eurozone crisis similar to Greece in 2011 may emerge.
This is a legitimate concern. However, this is not a new development. The move towards anti-establishment politics is not a surprise. (Hello, “the Donald” is President.) What we find most interesting is: 1) The reaction was not isolated to Italian markets; and 2) It occurred during a period of already increased volatility.
Spain has had its own political uncertainty recently, but this has been happening over the better part of the past year. Nothing new has emerged in Spain recently.
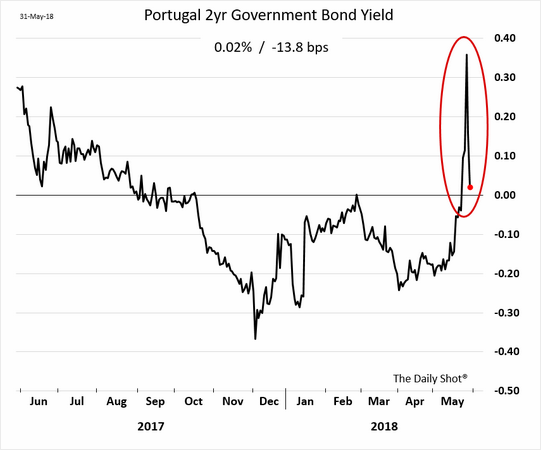
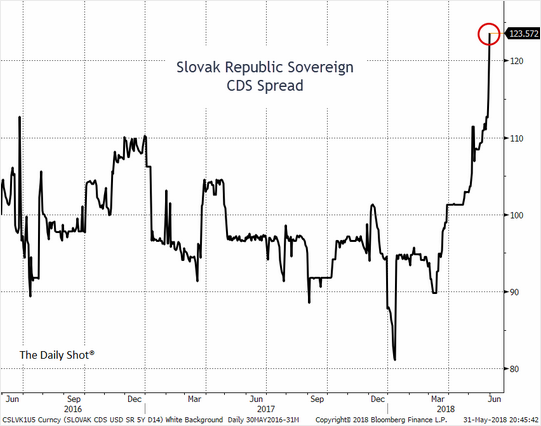
But look at the charts below, also from the WSJ. It was not only Italy that suffered…Spain, Portugal and even the Slovak Republic all saw incredible moves this week. This didn’t happen last year when Catalan moved to secede from Spain. Markets across the globe were in a steady up-trend when that was news.
What Does it all Mean?
For our clients at IronBridge, we have not had exposure to European stocks or bonds since last fall. Our investment models that attempt to identify favorable risk/reward markets have consistently put international investments below cash, US stocks and US bonds over the past 6-8 months.
More importantly, we believe that periods like this provide important lessons for investors who pay attention.
- When someone has their “finger on the scale” of the markets, bad things can happen when that finger is removed. The ECB artificially kept interest rates low with their indiscriminate purchases. When market forces exert their will, market manipulators cannot keep up. (Yes, we believe that central banks are market manipulators).
- Assets have a natural equilibrium price. This is the price where buyers and sellers exert an equal force up and down on the price. When a beach ball is held under water, it naturally wants to splash above the surface when it is released. This is what we have seen in Italian bonds and bank stocks this week…the equilibrium price was much lower for Italian bank stocks than where they were trading. And bond yields were much lower than they should have been. When the beach ball started to move towards the surface, it moved quickly. Historically, prices tend to move past their equilibrium price after being too high (or too low) for extended periods. Thus, periods of volatility occur as the markets find their footing.
- Markets change, and can change quickly. This is late cycle market behavior. Upside returns are possible, but downside risks can emerge and cause tremendous damage if not properly identified. Coming into 2018, most large firms were (and still are) touting the stability and growth potential of international investments. We have already seen the initial response from these firms, which is to stubbornly stick to their thesis, not acknowledging that maybe they are wrong. Our signals have not shared that same optimism, and as such our clients have avoided international exposure this year, along with the increased risks they pose.
- Unexpected things happen after volatility has already begun to rise. Political uncertainty was the supposed catalyst for the move in Italian markets this week, but that was just the news that finally began the search for equilibrium. If it wasn’t this piece of news, it would have been something else that triggered it soon. France, Italy and Spain have all had political uncertainty over the past few years, but the overall market environment was calm, and thus damaging moves did not occur. It took political uncertainty happening during a time of increased volatility that resulted in the damaging price movements in Italy this week.
Periods of increased volatility hold surprises for those not prepared.
Market Microscope
Paradigm Shift?
Volatility Paradigms Shifting?
Is the sudden outburst of volatility in 2018 proof that we are witnessing some sort of a paradigm shift in the markets?
As discussed, this week the big “news” was the election results in Italy, which sent shock waves through its bond market and translated negatively simultaneously to the rest of our interconnected finance world. Italy was to blame for the market’s rather negative reaction the first day back from the Memorial Day holiday. The following day, a complete reversal of the entire volatile day occurred. 400 Dow points down and 400 Dow points back up. Go figure.
But hasn’t Italy been in the news and a “risk” for years now (remember the PIGS)? Even more obvious, should we not be surprised that such a swift repricing in those bonds could occur given Italy’s risk of repayment of these government bonds, as measured by the lower yield they were paying, was actually lower than that of the United States to begin with? In other words, the “market” was valuing Italy’s bonds as a higher quality than those of the U.S until this occurred! Really not that much has changed, but for some reason all of this is affecting the market more in 2018 than in years past.
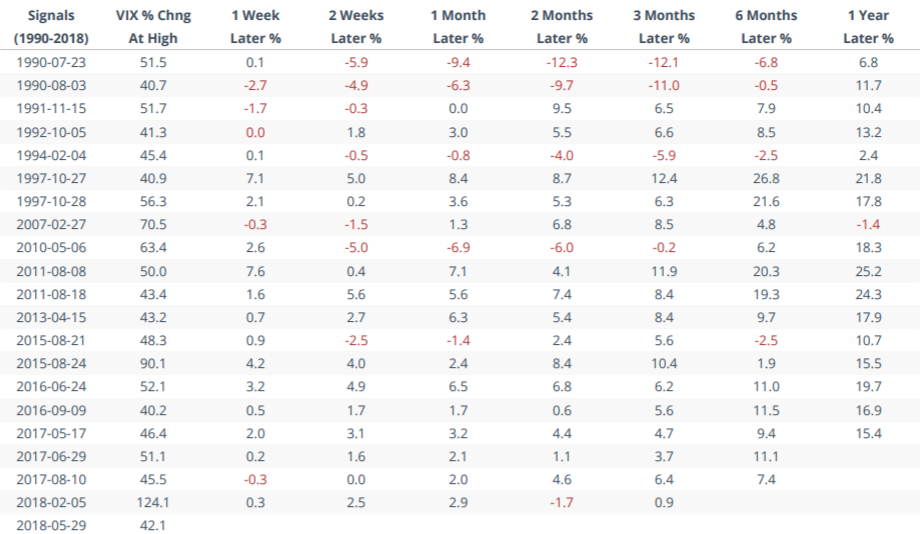
The graphic below from SentimenTrader.com, reveals that already in 2018, we have seen two of the most volatile days in the history of the VIX Index! Going back to 1990 there had been just 20 occurrences of a daily VIX spike over 40%. On Tuesday, 5/29, the VIX spiked over 42% intra-day, the 21st move ever over 40% and the 17th most volatile move ever. History making days such as this is one reason we think we may be in the midst of some sort of paradigm shift. Whether that shift is to a higher volatility cycle, a repricing of risk and markets topping process, or just a temporary blip before we return back to the low vol environment so many have become accustomed to remains to be seen, but it is definitely safe to say that things in 2018 are nothing like years past. Already in 2018 we have seen the single largest volatility spike in history, followed now by the 17th largest ever.
One way we are trying to manage this new environment is by not pigeon holing the market’s movements into a singular event as the cause for its behavior. It is much too complex for that. One news item is likely not the cause for the increase in volatility. For instance Trump was President all of last year, sending just as many “interesting” Tweets as today, yet the market, then, remained calm and largely carried on. So why are his Tweets today affecting the markets so? North Korea also was a major headline risk last year (as it has been for most of its history), but for some reason “Summit On, Summit Off” is affecting the market in 2018 unlike it would have in 2017. Another headline grabber, tariffs, were well known as part of Trump’s campaign promises in 2016, yet here we are, two years later, supposedly surprised by the tariff back and forths.
These same events and developments just seem to matter to the market more in 2018. We wonder why, and think it could be a sign that the market’s bull cycle may be nearing its end.
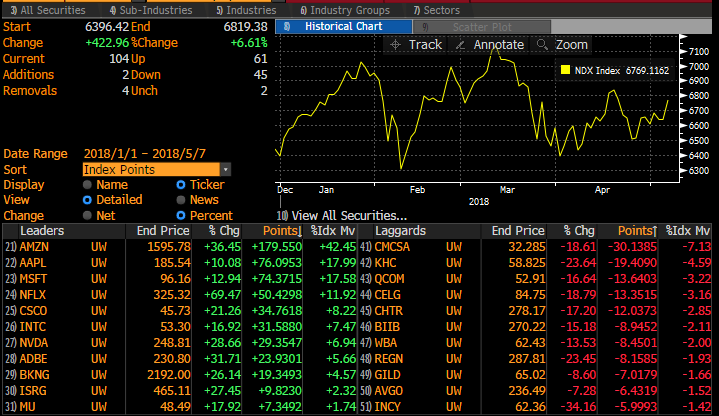
Beyond the apparent change in tone of the market, another potential reason for the increased volatility could be a result of the smaller and smaller number of “soldiers” following the “generals” into battle. We warned about this in detail back in the 3/30/2018 issue, and below, courtesy of Hedge Fund Telemetry, we have another graphic that helps show how few generals there really are.
Listed at the bottom of the graphic are the top leaders and laggards in the Nasdaq 100 Index (the ETF for the largest 100 companies listed on Nasdaq – ticker:QQQ). The %Idx Move columns show how much effect each stock has had on the Nasdaq 100’s performance year to date through mid-May. Amazingly Amazon, Apple, Microsoft, Netflix, and Cisco (5 companies) have accounted for almost 100% of the Index’s gains.
These “leaders” are the Lebron James of the stock market right now, putting the entire market of stocks on their shoulders and leading the indices so far this year to victory. But if you live by the sword then you also die by the sword the saying goes, and just like the Cleveland Cavaliers, if these stocks start losing favor, or they have an “off night”, then the Index will also suffer more greatly as there is nobody else that can score 40+ points a game (Lebron James scored 51 points in Game 1 of the NBA Finals on 5/31/2018, and yet the Cavs still lost).
Notice also on the right side how much more distributed the downside “laggards” are. The top 5 laggards make up just 20% of the negative returns year to date. When the “leaders” start to decline, their effect on the market will be out-sized, another likely reason for the increased volatility we are seeing as fewer stocks are smoothing the ups and downs.
We think Thomas, who runs Hedge Fund Telemetry, has it right when he says that right now we are seeing a “chase” in the FANG stocks as everyone piles into the leaders in an effort to outperform the index. He points out, there is very little short interest in these stocks, suggesting there are few big investors out there that don’t already own the FAANG cohort. With such minimal short interest there is 1) little fuel for a short squeeze and 2) a sign that there is probably not many investors left to help fuel prices much higher.
A lot of it really is just a self fulfilling prophecy driven by the cap-weighting process ETFs use.
As these companies gain in price and thus market cap, they become bigger components of popular ETFs, and when investors buy these popular ETFs (a big trend right now), more of that money is then allocated to these now larger companies which now make up a bigger percentage of the ETF. The big become bigger.
The cycle continues until it is reversed and the self-fulfilling occurs similarly on the way down, just as it did on the way up. These behemoths are sold, which makes their weights in the ETFs smaller, which then means these funds must sell a portion of them and so on and so on. There is no doubt that when these popular stocks become out of favor, their declines will be faster than the market’s as a result of this cap weighting relationship.
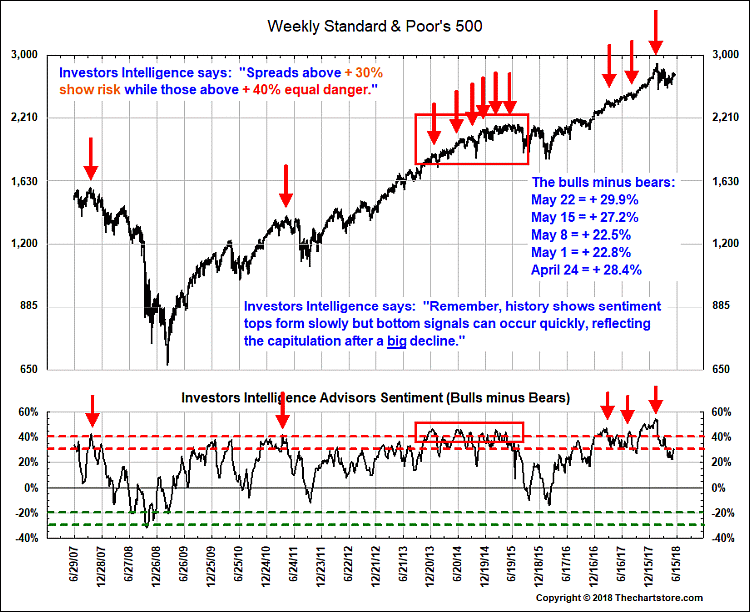
One other interesting aspect of the recent uptick in volatility is it hasn’t really scared investors out of the stock market, at least not yet anyways. The chart below, from Thechartstore.com reveals the percentage of bulls less the bears in the Investors Intelligence Advisors survey resides at 30%, meaning there are 30% more bulls than bears currently, which as they point out on the chart is still danger territory for a market top. Looking at the chart since 2007, this is above average.
Even with record setting volatility, investors aren’t spooked. No walls of worry here, and that remains a reason to remain skeptical and perhaps even worried as the arrows on the chart point out!
Bottom line…volatility is showing up in many areas across the investment landscape. This does not mean that positive returns are not available, but caution is warranted while we watch if this is truly a paradigm shift, or just a temporary nap in another day of living the good life.
Invest wisely.
Our clients have unique and meaningful goals.
We help clients achieve those goals through forward-thinking portfolios, principled advice, a deep understanding of financial markets, and an innovative fee structure.
Contact us for a Consultation.
Neither the information provided nor any opinion expressed constitutes a solicitation for the purchase or sale of any security. The investments and investment strategies identified herein may not be suitable for all investors. The appropriateness of a particular investment will depend upon an investor’s individual circumstances and objectives. *The information contained herein has been obtained from sources that are believed to be reliable. However, IronBridge does not independently verify the accuracy of this information and makes no representations as to its accuracy or completeness. Disclaimer This presentation is for informational purposes only. All opinions and estimates constitute our judgment as of the date of this communication and are subject to change without notice. > Neither the information provided nor any opinion expressed constitutes a solicitation for the purchase or sale of any security. The investments and investment strategies identified herein may not be suitable for all investors. The appropriateness of a particular investment will depend upon an investor’s individual circumstances and objectives. *The information contained herein has been obtained from sources that are believed to be reliable. However, IronBridge does not independently verify the accuracy of this information and makes no representations as to its accuracy or completeness.

