It seems that the market’s mood may be changing. After blowout earnings from many companies, stock prices have fallen in price instead of rising as one might expect. When bullish events happen, yet bearish price action follows, the potential exists of a shift in investor moods. Is the Fed partially to blame?
[maxbutton id=”5″ url=”https://ironbridge360.com/wp-content/uploads/2018/05/IronBridge-Insights-2018-05-03-Mood-Swings.pdf” text=”View PDF of this Report” ]
Executive Summary
Economic Insights: Don’t Fight the Fed
Many investors (including us) believe the Federal Reserve’s Asset Purchase Program, initiated during the Financial Crisis and continued until 2014, had a direct and positive effect on the stock and bond markets. From 2014 to 2016 the Fed then essentially kept it’s balance sheet at a relatively stable level near $4.5 Trillion. The Fed is now embarking on a program to reduce that balance sheet, and the unprecedented Asset Purchase Programs are now giving way to a similarly unprecedented Asset Tapering Program in which the Fed will allow termed assets to not be renewed, effectively removing liquidity from the markets. Should we expect Tapering to have the opposite effect as Easing?
Stock Market: Range Bound
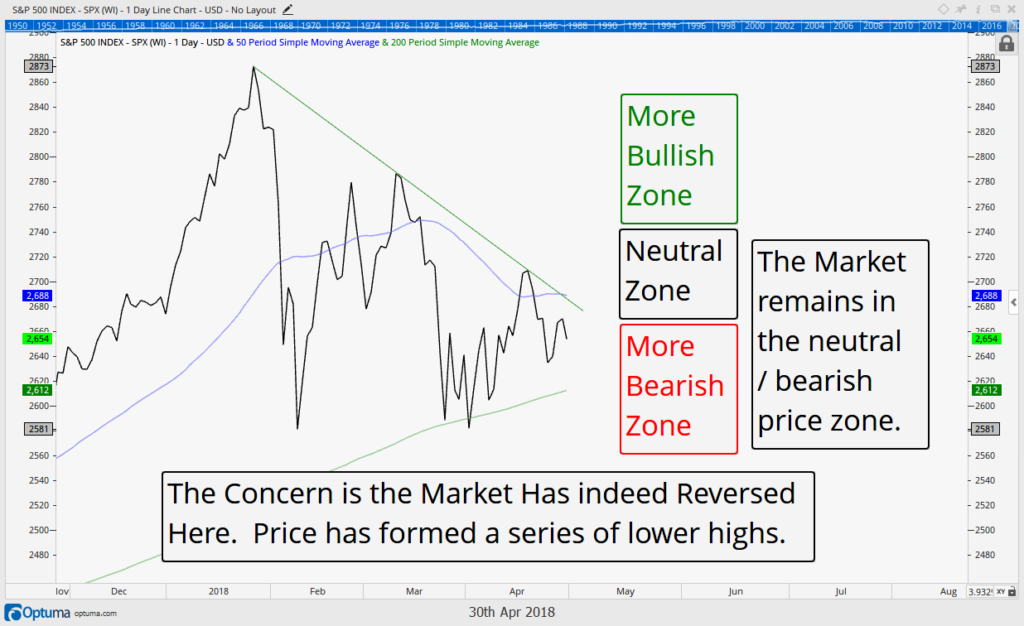
The S&P 500 has continued its choppy, sideways market action for the past 3 months. Despite having numerous days when prices changed greater than 1% up and down, the market has made no progress up or down. We continue to watch the 200-day moving average (along with every other professional investor on the planet) as the key level that the markets must hold. A breakdown of this level will likely result in a tremendous amount of downside pressure on the markets.
Corporate Earnings: Mood Swings
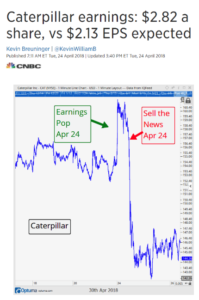
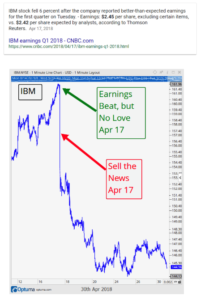
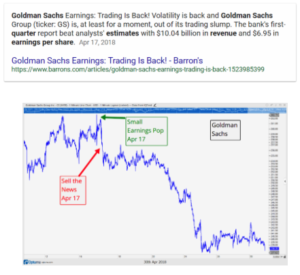
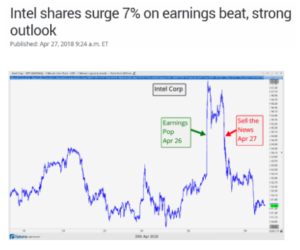
We are about mid-way through earnings season, and the results have been phenomenal. Nearly 80% of companies have exceeded estimates, which is well above the 68% average of companies that typically beat in a quarter. And these are earnings that have exceeded already elevated estimates. The market rewards companies that do this, right? Apparently not, as the broad market is lower today than when earnings season began. Markets are incredibly complex systems that do not react to one or two data points (except maybe the Fed). Companies such as Goldman Sachs, IBM, Intel and Caterpillar have all had amazingly strong earnings, but their stock price suffered dramatically following the announcements. Earnings are important, but are only one of many different factors that drive stock prices, and fundamental analysis alone is not a good predictor of market prices.
FIT Model Update: Market Correction
![]()
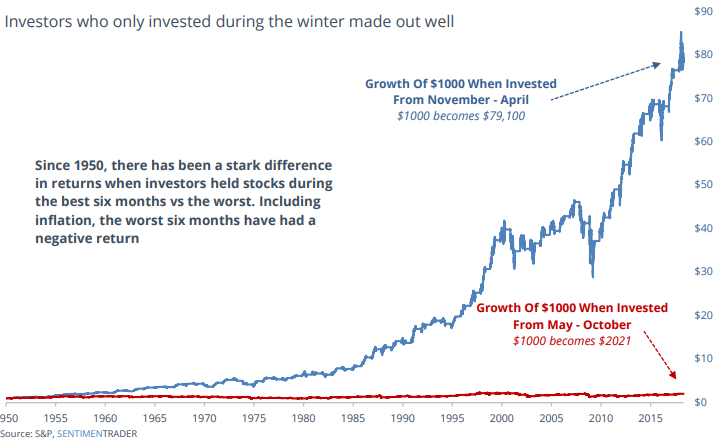
The market remains in its technically sideways chart pattern, having not broken down below the all-important 200 day moving average but also not making a new high above February’s all time levels. We remain in a range bound market, heading sideways, until proven otherwise. We are also entering the famed “worst six months” calendar period for the stock market. Historically the months from May through October have very significantly underperformed the other 6 months of the year, resulting in almost no gain since 1950. We dive further into this stat at the end of this report.
Economic Insights
Don’t Fight the Fed
The Federal Reserve’s Tapering Program
On October 13, 2017 the Federal Reserve announced its much anticipated “tapering” program with the schedule of a $10B per month roll off in Central Bank purchases. The first chart below provides an update of the Fed’s Assets on its balance sheet and it indeed shows that they have been tapering.
This chart shows that after peaking around $4.515T, the Fed’s balance sheet declined to around $4.460T at the time of the Taper announcement. Today it sits at $4.375T, so let’s do some math around the pace of the tapering.
Here was the proposed schedule of Federal Reserve tapering: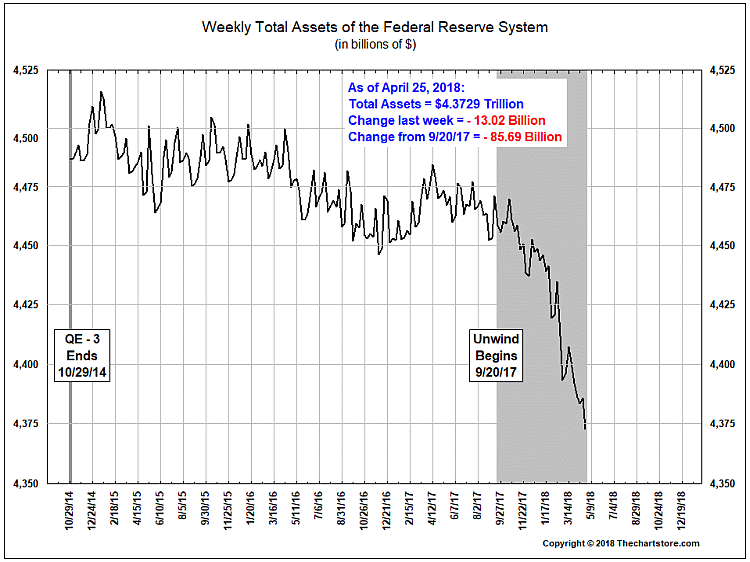
- October 2017 – $10B
- November – $10B ($20B cumulative)
- December – $10B ($30B cumulative)
- January – $20B ($50B cumulative)
- February – $20B ($70B cumulative)
- March – $20B ($90B cumulative)
- April – $30B ($120B cumulative)
- May 2018 – $30B ($150B cumulative)
So, it seems at the end of April the Fed should have had around $120B fewer assets than they did in October. This would equate to around $4.340T on its balance sheet, which is around $30B short of where they actually are today.
What’s also missed by most is that this is not the first time the Fed has “Tapered”, and the timing of that last “Taper” is peculiar at best. The last time the Fed reduced its balance sheet was during the early stages of the financial crisis, when it reduced its holdings by $300B from around $2.200T to $1.875T during early 2008. Could the Fed had been a catalyst to the great financial crisis?
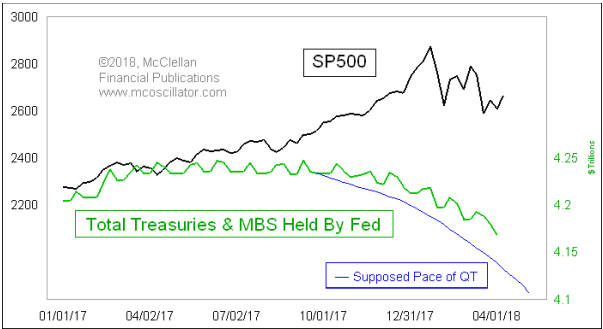
The next chart below, from McClellan financial, does infer there is a linkage between Fed Balance Sheet tapering and the recent equity market selloff. If that linkage is indeed real, then we should not only expect continued equity weakness, but even a pickup in it as the Fed plays catch up while also continuing to increase its pace of tapering.
We believe that it is no coincidence that volatility returned to the equity markets at nearly the same time that the Federal Reserve started to increase the rate of tapering. After all, if we are supposed to “Not Fight the Fed” on the way up, then we probably should also not fight them on the way down.
If indeed you want to “Not Fight the Fed” or also believe their tapering back in 2008 could have led to the financial crisis, then you would do as they are doing now and also be selling your riskier assets.
Market Microscope
Mood Swings
Stock Market
It’s been a month since we last published an Insights, but as far as the market’s price is concerned, that time might as well have been lost. The S&P’s price today is around $2640. The S&P’s price closed on Mar 29 at $2641, so essentially no change in price has occurred during that time. Don’t get us wrong, there has been plenty of volatility in the meantime, with numerous 1%+ intraday swings, but if you left on vacation for a month to your deserted island oasis, you would have thought nothing really happened in April when you returned. What this means from an investment strategy perspective is we have not had a conclusion to the price predicament we have been outlining the last few months as we still remain range-bound.
The chart below updates us as to the market’s recent movements. We have been looking for a decline below the 200 day moving average to help confirm a more bearish scenario, and we have been watching for new highs to add value to the bullish case. We remain with no resolution, yet.
Mood Swings
Sometimes news headlines don’t accurately capture reality, especially when it comes to markets. We’ve included some of these headlines and charts below.
The headlines followed the respective company’s earnings announcements. If one were to assume that earnings alone drive stock prices, then one would conclude we’d be sitting once again at all time stock market highs. That is simply not the case and is one reason why we believe you need more than just fundamental analysis to make better investment decisions.
In most cases, first quarter earnings have beaten estimates. In some cases the beat has been historic. Let’s look at the headlines of these Dow Jones Industrial Average members:
- Caterpillar’s earnings jumped over 30%. That is an incredible year over year number.
- IBM ‘s results weren’t as glamorous compared to some others, but they still beat earnings estimates by 3 cents.
- Barron’s declared for Goldman that “Trading is Back!”
- Intel had a “strong” outlook.
- United Healthcare even had investors seemingly jumping for joy.
But, if we look at the reactions to these earnings, we see that this excitement was very short lived. Earnings were great, yet stock prices of these companies have been hit hard. For whatever reason, this new reality suggests the market may have changed its mood to a “sell the news” mantra. This is one reason why we like to look at charts. This change in mood shows up in them and also helps us stay ahead of the market’s behavioral mood swings as well as avoid all this earnings “noise”.
How great have earnings been? By some measures they have been the best in 25 years.
The next chart from SentimenTrader puts into perspective just how great this earnings season has been. Over 80% of companies that have reported this earnings season (>75% of companies thus far) have beaten their earnings estimate, and this is shaping up to be the most positive earnings season in over 25 years.
Not only is this earnings season looking the best in at least 25 years, we also can see from the chart below that just having a beat rate >70% is rather unusual and really just a product of the 2000’s.
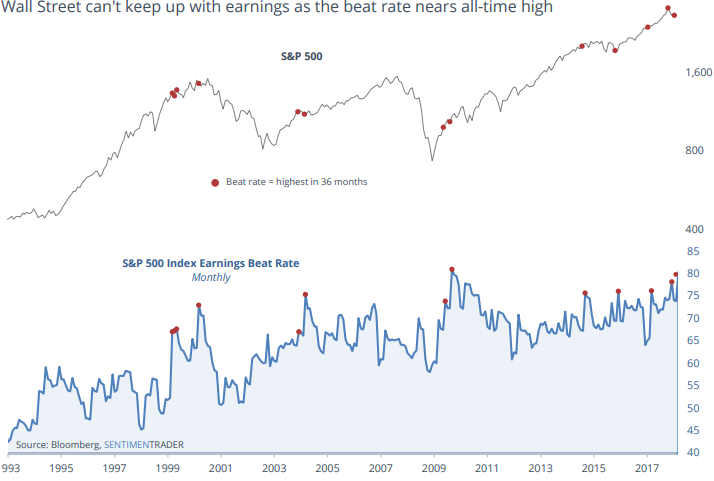 However, as the four examples shown reveal, positive earnings surprises are not necessarily reasons to celebrate. This year, for whatever reason, investors have been selling the good earnings news. SentimenTrader furthers its analysis with a look at all the times earnings beats were greater than any time over the prior 3 years (36 months) and concludes that over the study’s 25 year period this has occurred 12 times. The conclusion to the analysis was that stock price returns after such periods were average at best, offering little as to predictability of such significant earnings beats.
What we do know is that investor mood was indeed recently highly elevated. This was revealed by 2017’s well above average stock market returns, January’s well above average 5% return, and the much discussed tax cut driven earnings expectations heading into this earnings season. Since then, however, investor’s have been selling the good news, instead of buying it, and that suggests a negative mood swing on the part of investors.
We wrote about investor complacency on January 12 of this year, in what we dubbed “The Slumber Issue”. Read it HERE.
Coupling the new reality of a negative mood swing with the fact the price of the S&P remains lower than it was prior to earnings even starting, we remain cautious of these markets.
Worst Six Months
Also from SentimenTrader, the chart to the right helps summarize the “worst 6 months” market anomaly. Since 1950, the market has essentially done nothing between the months of May and October. 99% of the market’s returns have occurred in just 6 months of the year, between November and April.
As the callout on the chart also points out, when adjusting for inflation, the 6 month time frame beginning now actually has a negative 68 year return.
This is an amazing statistic that has little acceptable explanation behind it. Is it because the annual tax season has completed? Does it have to do with Summer and vacations? Any way you look at it, it’s an ominous reality.
The good news is any 1, 2, 3, or even 10 year period can buck the trend, and is why we don’t make investment decisions based on statistics alone. It’s certainly an interesting, thought provoking, anomaly.
Bottom line…we continue to be in a period of elevated risks, and one should not ignore the potential for substantial damage to portfolio values over the coming months.
Invest wisely.
Our clients have unique and meaningful goals.
We help clients achieve those goals through forward-thinking portfolios, principled advice, a deep understanding of financial markets, and an innovative fee structure.
Contact us for a Consultation.
Neither the information provided nor any opinion expressed constitutes a solicitation for the purchase or sale of any security. The investments and investment strategies identified herein may not be suitable for all investors. The appropriateness of a particular investment will depend upon an investor’s individual circumstances and objectives. *The information contained herein has been obtained from sources that are believed to be reliable. However, IronBridge does not independently verify the accuracy of this information and makes no representations as to its accuracy or completeness. Disclaimer This presentation is for informational purposes only. All opinions and estimates constitute our judgment as of the date of this communication and are subject to change without notice. > Neither the information provided nor any opinion expressed constitutes a solicitation for the purchase or sale of any security. The investments and investment strategies identified herein may not be suitable for all investors. The appropriateness of a particular investment will depend upon an investor’s individual circumstances and objectives. *The information contained herein has been obtained from sources that are believed to be reliable. However, IronBridge does not independently verify the accuracy of this information and makes no representations as to its accuracy or completeness.

