In this issue we discuss 6 Ways to Invest late in a market cycle, explore the past week’s volatility in more detail, and offer two explanations of why the markets fell so far so fast.
[maxbutton id=”5″ url=”https://ironbridge360.com/wp-content/uploads/2018/02/IronBridge-Insights-2018-02-09-1.pdf” text=”View PDF” ]
In This Issue:
MARKET RECAP: It’s All Phil’s Fault
Correlation is not causation. Just because things happen at the same time does not mean they are related. We look at two possible explanations for the market decline this past week.
PORTFOLIO Insights: 6 Ways to Invest when it’s Late in a Market Cycle
We review the characteristics of a market that is late in its cycle, and explain the six principles of investing during a late cycle environment.
MARKET MICROSCOPE: That Escalated Quickly
The VIX Index more than doubled in a 24 hour period causing some ETNs to actually close up shop. This rapid pace of the VIX’s move was unprecedented. Also, equities saw their biggest pullback since August of 2015 as one of our technical indicators has moved to a more conservative signal. Before all the fireworks we moved a portion of portfolios to cash, where it still sits.
On Our Radar
Trump Taxes: The tax bill has passed as companies continue to dissect how changes may affect them.
Earnings: 4Q Earnings season has begun, and companies have a high bar to continue the growth seen in 2017. GAAP Reported Earnings estimates for the full year have risen another $6 to $146.
Federal Reserve: The Fed is expected to raise rates 3 more times in 2018 as the bond market has already started to price this in.
Winter Olympics: The Winter Olympics kick off this weekend in South Korea.
Government Shutdown: The shutdown was avoided as a last minute signing of the latest bill occurred on Thursday 2/8/2018.
Economy: 4Q GDP rose by 2.6%, well below estimates above 3%.
Volatility: By some measures the recent bout of volatility was the most ever in such a rapid amount of time as the VIX spiked from under 20 to over 50 in a matter of hours during Monday’s (2/5) market slide. The increased volatility sent shockwaves across the markets. Still, it seems the VIX’s movements were exacerbated by the lopsidedness of the short trade as some estimates suggest that such a move higher in the VIX should have sent the S&P down 15%.
FIT Model Update: Uptrend with EARLY TOPPING PROCESS

Fundamental Overview: Although the Dow Jones Industrial Average declined over 10% from its peak to its trough during this latest decline, valuations are still very stretched. By most measures it would take a bear market decline (20%+) to bring valuations back in line with historical norms. One glaring example of this is the 5 Year Treasury Note’s yield of 2.5%. This typically safer investment is providing more income than the much riskier S&P 500’s 1.8% yield.
Investor Sentiment Overview: This week showed us one risk in being in a very crowded trade as the low volatility trade finally ended. The trade was so lopsided that a popular ETN used to short volatility literally blew up when Credit Suisse “terminated” its short volatility ETN (ticker: XIV) on Tuesday morning. So many investors had piled into the short volatility trade when the volatility index (VIX) rallied over 100% from the prior day, the ETN didn’t have the funds to cover its short positions, essentially bankrupting it. Essentially the short vol traders were caught in a massive short squeeze.
Technical Overview: Friday’s (2/2), Monday’s (2/5), and Thursday’s (2/8) crashes in stock prices essentially wiped out two months of gains as prices reversed back to late November levels. Our trend strategy and sector strategies gave us some sell signals as we increased our cash exposure this week.
Market Recap
The past week in the markets has been incredibly volatile, and as uncertain as any period since the 2008 financial crisis. There are many potential explanations of what cause the volatility over the past week. Some say it’s just inevitable, but we offer two possible explanations.
Maybe it’s all “Phil”s fault.
Last Friday, Punxsutawney Phil saw his shadow and the Dow fell 656 points. Then, following an Eagles Super Bowl win, the city of Philadelphia shut down to celebrate the victory and the Dow fell 1,175 points. To cap off a rocky week, Philadelphia again shut down for the Super Bowl parade on Thursday, while the Dow fell another 1,033 points. Thanks Phil.
We don’t mean to make light of markets falling so dramatically, but we point this out to highlight the importance that correlation is not causation. Just because things happen at the same time does not mean they are related.
Our Real Analysis of the Past Week
Based on our work examining the market behavior this week, we believe a series of things occurred:
- A Fragile Structure. The markets were very overextended from the record-low volatility over the past 6 months. This is a setup for a fragile market structure, as we have discussed previously. Low volatility increases risk, it does not reduce it.
- Liquidity was reduced. Record equity in-flows in January removed a large portion of potential liquidity for the markets. When selling started, there was a lack of buyers.
- Algorithms sold on Friday and Monday. There are many programmed trading funds across the globe. When they start to sell, it has the potential to create a self-fulfilling spiral. It starts with a large sell order in a thinly-traded market, which created a sell-order imbalance. Other computer programs see this and also enter sell orders. This makes sense to us, particularly when we noticed that volumes were normal levels (typically we would expect to see an increase in volume given such large declines).
- Risk Parity Funds sold on Thursday. There has been a dramatic rise of assets in what are called “Risk Parity Funds”. These funds target a specified level of risk. If risk rises, they must reduce their exposure. As risk declines, they increase exposure. As a result of the spike in volatility on Monday and Tuesday, there was anywhere between $200b and $400b of selling pressure from these types of funds.
- Key Technical Levels Provided Support and Resistance. This morning, the S&P 500 bounced off its 200-day-moving-average. This is the average price of the index over the past 200 days, and is a very closely watched level by portfolio managers. In fact, the S&P 500 tested its 20-dMA, 50-dMA and 200-dMA at some point during this week.
- Diversification Didn’t Work. As we explain below, almost every asset class was punished during the past week, as we have previously predicted.
Portfolio Insight
How to Invest Late in a Cycle
“There are two concepts we can hold on to with confidence: Rule No. 1: Most things will prove to be cyclical. Rule No. 2: Some of the greatest opportunities for gain and loss come when other people forget Rule No. 1” – Howard Marks, Investor
One of our persistent themes over the past few months has been discipline. We believe this is the most important trait that you as an investor, and us as wealth managers, must exercise when faced with late cycle investing.
First, what do we mean by “Late Cycle” investing?
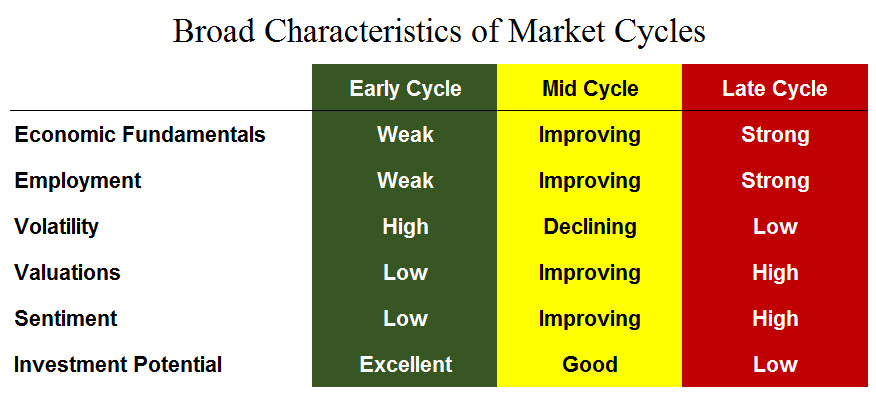
Every market, whether it be in stocks, bonds, real estate, commodities, currencies, etc, works in cycles. These cycles are not always predictable, and their turning points are definitely not predictable. However, it does not take a PhD in Economics to understand that a bull market that began 9 years ago is not in its early stages of expansion. Quite the opposite. In almost every measure that we watch, signs abound that we are late in the cycle.
The list below shows the broad characteristics of market cycles.
So what are the characteristics of a Late Cycle environment?
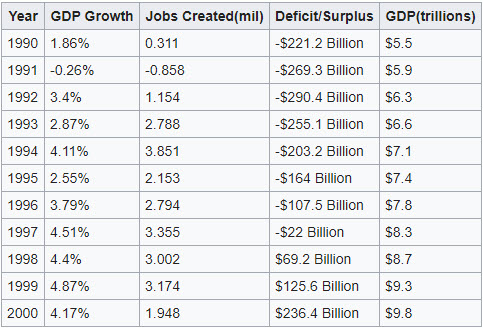
- Economic Fundamentals are Strong. Fundamentals always look the best at the top, and the worst at the bottom. During the Tech Bubble in the late 1990s the underlying economic conditions were quite good. GDP had expanded for 9 consecutive years, as shown in the chart below.
- Volatility is Low. More on this in the Market Microscope section below.
- Valuations are High. Prices tend to rise faster than earnings late in market cycles, causing various valuation measures to increase. We see that today in P/E ratios being near all-time highs.
- Optimism is High. The most consistent characteristic of market cycles appear in sentiment measures. Optimism is high near a market peak, and extremely low near market lows. This is easy to understand, as bull markets feel good and bear markets do not. No one likes to lose money.
How to Invest in a Late Cycle Environment
1. Shorten Your Time Frame (aka, Don’t Buy and Hold)
You should expect to own investments for a shorter period of time. The longer you hold an investment, the more likely it is that the next down cycle will occur while you own it. This means more careful screening of investments, and adhering to a strict exit strategy.
2. Reduce Your Tolerance for Downside Risk
Upside return potential is reduced late cycle. This doesn’t mean you can’t generate nice returns, but you must plan out strategies to get you adequate upside to compensate for your downside risk. We prefer a general 3-to-1 ratio: own investments with the potential to at least earn 3-times the upside versus the downside risk. So if we expect a 15% upside return potential, we want no more than 5% of downside risk.
3. It’s Okay to Miss Out on some Upside to Avoid Big Downside
One of the risks of late cycle investing is called getting “whipsawed”. This is where you own a position, get an exit signal, only to get another buy signal shortly afterward, resulting in a potential sell and then a soon after repurchase. In order to mitigate whipsaw risk it is important to structure exit and re-entry signals so that the potential loss is less than the potential loss of holding the position through the volatile periods.
4. Don’t Rely on Asset Allocation
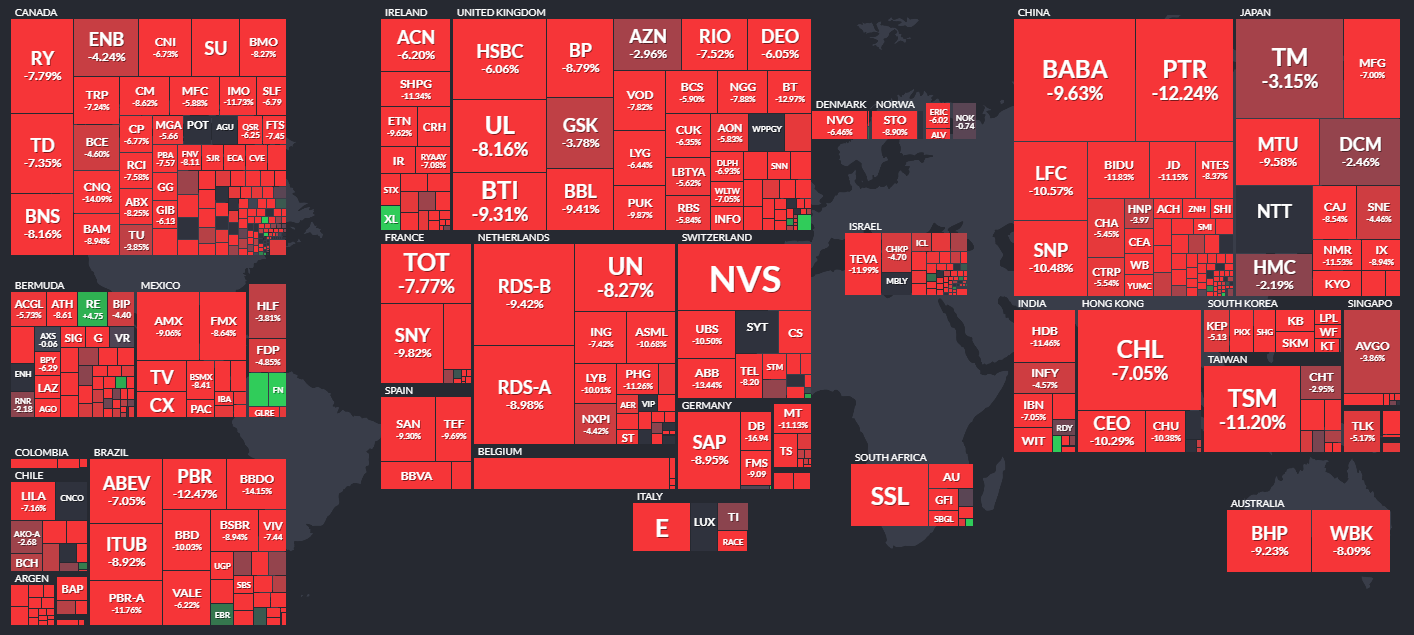
We have mentioned this is many of our previous reports. Asset allocation does not work when markets undergo stress. And the past week has definitely shown stress in markets with the Dow Jones down 1000pts not one, but TWO days this week.
Here is the performance of various asset classes from peak to trough from their recent highs:
- US Stocks (Large Cap, S&P 500): Down 11.82%
- US Stocks (Small Cap, Russell 2000): Down 11.21%
- International Stocks (EAFA Index): Down 12.58%
- Emerging Market Stocks: Down 13.87%
- Corporate Bonds: Down 5.47%
- US Treasury Bonds: Down 8.08%
- Gold: Down 4.16%
- Oil: Down 9.6%
- Bitcoin: Down 69.1%
- Euro (Ticker:FXE): Down 2.6%
- Emerging Market Sovereign Debt (Ticker: PCY): Down 6.4%
- Mortgage Bonds (Ticker: MBG): Down 4.3%
- Reits (Ticker:REIT): Down 13.3%
- Manhattan, NYC Apartment Rental Costs: Down 3.6%
- U.S. Dollar (Ticker: UUP): Up 2.4%
You get the picture. How well did a diversified portfolio prepare for and handle the downturn? Based on the numbers above, not well at all.
5. Don’t Listen to “Stay the Course” Advice.
The most common advice we hear from almost every major investment firm includes some combination of the following phrases: “Corrections are Inevitable”, “Stay the Course”, and “Markets Always Recover”. This advice is better than panicking, but it makes us wonder a few things.
For example, one of the country’s largest banks published a report to their institutional investors advising to sell stocks on January 30th. A subsidiary of this bank, one of the country’s largest investment firms, told clients to ride it out. There is a fundamental conflict with this advice.
We believe that most investment advisors do not understand how markets fundamentally work. Would you take your car to a repair shop that didn’t know how an engine worked? Yet, on LinkedIn we find article after article from advisors attempting to provide various reasons for the correction, but their conclusion is and always will be to “stay the course”. The irony is that this advice is exactly why investors panic as they lose confidence in their strategy.
6. Plan Investments within the Context of Your Overall Portfolio
Define your goals, define the overall structure of your portfolio, and design an investment methodology that fills the buckets.
Having a plan in place that reflects the cycle the market is currently in allows one to be fully prepared for weeks like the one we just had. Broad asset allocation may be sufficient during the early or middle stages of a cycle, but as we have seen the past week and exemplified in the example to the right where we have the last week’s performance across the world, it can fail you when you most need it during the late stages of a cycle.
As we mentioned in our Monday Special Report, “We have put in the work, so our clients can have peace of mind that we are taking every prudent step to address a variety of of potential market outcomes, good and bad”.
Market Microscope
That Escalated Quickly
One month ago we took a look at the extremely calm markets and one measurement of its serenity, volatility. In that issue we discussed the sleeping VIX. It seems Rip Van Winkle has awoken from his slumber! In that same issue we reiterated our stance that we were in a rising yield environment where we projected a 10 year Treasury approaching 3.0%. That has already come to fruition.
Late Cycle Investing:
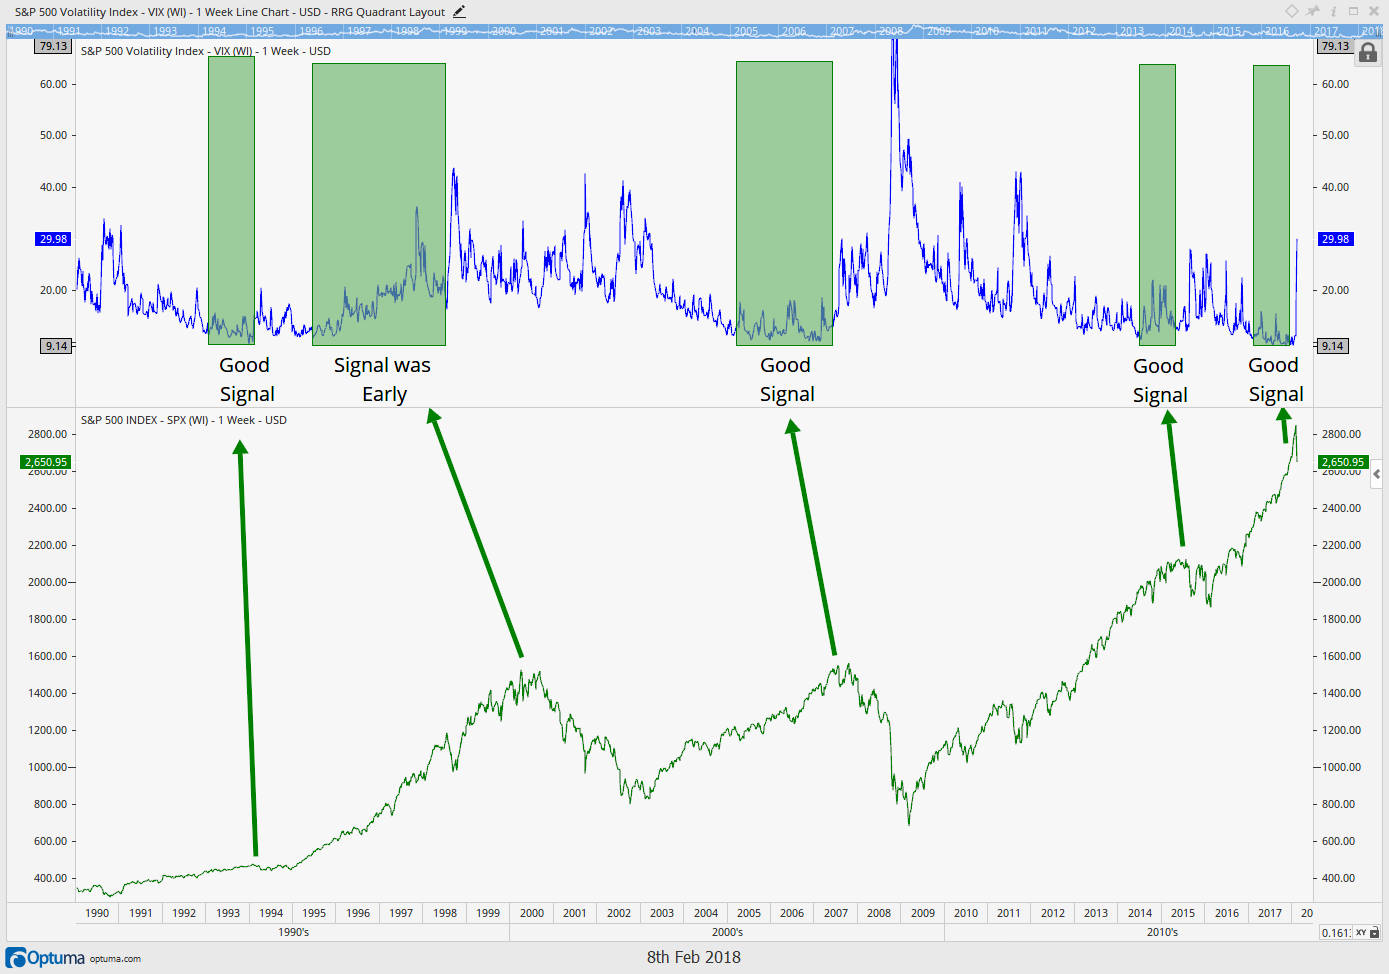
A persistent theme over the past year has been the record low volatility. Back on August 11, 2017 we discussed this as we proclaimed, “a low VIX should not be something necessarily celebrated, but instead should be treated more as a red flag as market tops almost always are associated with periods of low volatility”. In addition charts were provided showing the record low volatility and the record amount of speculative short VIX contracts (which have now contributed to the extraordinary VIX move discussed in more detail below).
The chart below is similar to the one we provided in our January 12, 2018 ‘Insights’. In that issue we showed 4 prior times the VIX was near all time lows. 3 of those 4 preceded meaningful market pullbacks, and we now have a 5th occurrence, which also is in the process of marking a meaningful market pullback with the S&P and Dow falling over 10% from their highs. Low VIX levels are associated with market tops, not market bottoms. Similarly a low VIX is also associated with being late in the cycle, as the chart below helps show. Low VIX levels typically occur prior to market tops and market tops are by definition late in the market’s cycle, so a low VIX helps us confirm we are indeed late in the cycle.
But a low VIX also tells us more. A depressed VIX means volatility expectations are low, and thus tolerance for any elevated volatility should also be low. Contrastingly, in a high volatility environment larger price moves are expected, and thus should be tolerated more openly. We keep our tolerance for volatility low by keeping our stop losses and exit signals tighter than we would earlier in a cycle, when increased volatility expectations suggest allowing more tolerance for price moves. Those tighter stops have helped us move some portions of the portfolio to cash, ahead of a lot of the fireworks and whatever may be on the near horizon.
Volatility:
Well that escalated quickly! If you haven’t heard, this past week we witnessed an unprecedented move in volatility as the S&P 500’s Volatility Index (the VIX) skyrocketed over 100% in just one day. Not to get too technical but the VIX Index measures the underlying cost of volatility in an S&P 500 Index Option contract. In short it tracks the cost traders are willing to pay for volatility uncertainty, and on Monday that cost skyrocketed.
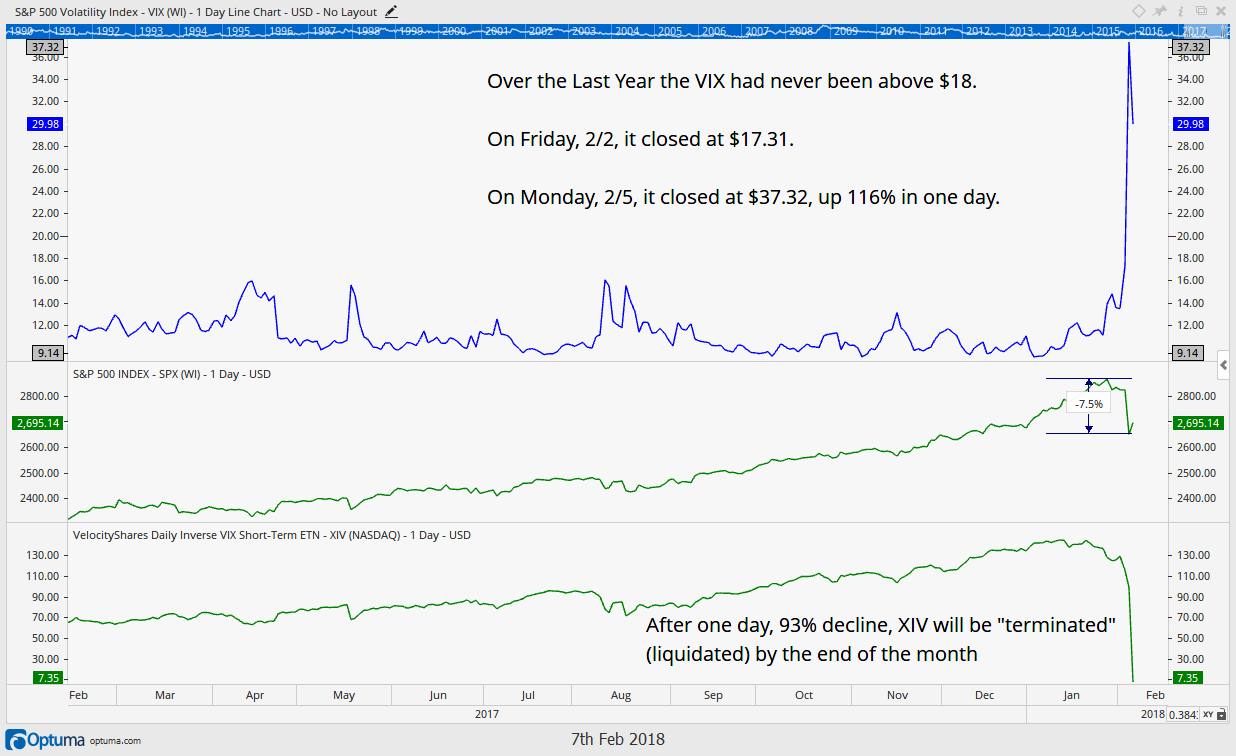
The chart below shows the recent history of the VIX along with the S&P 500 Index as well as a popular Exchange Traded Note (ETN) which allowed traders to participate on the short side of the VIX trade (owners profited when the VIX declined in price and lost when the VIX rallied in price).
The chart below shows that not once over the past year did the VIX close above the $18 level. That all changed on Monday, February 5, 2018 when the VIX more than doubled as the Dow Simultaneously fell over 1,000 points.
The move higher in the VIX was so unprecedented, that one exchange traded note (ETN), ticker: XIV, is having to liquidate whatever assets they have left as they couldn’t cover all the losses absorbed during the rout. For all intents and purposes the fund was caught in a massive short squeeze in the price of volatility which ultimately bankrupted them.
If there is a positive perspective to this story perhaps it is that the S&P was only down 7.5% from its peak to its trough since hitting its all time high two weeks ago. Some experts have suggested that similar moves higher in the VIX in the past would have sent the S&P down 15% or more.
The other silver lining is that our trend model gave us our first sell signal since August as we moved a portion of our portfolios to cash before most of the fireworks started. We remain with a somewhat elevated cash position as we continue to monitor the situation.
What this also means is volatility is likely here to stay, at least for a little while, as revealed on Thursday, February 8, 2018 when the Dow had its 2nd 1,000+ point drop in under one week. When extremely popular funds blow up, it can take some time for the dust to settle.
Stock Market:
Volatility has certainly picked up, but how much damage has actually been done to the markets?
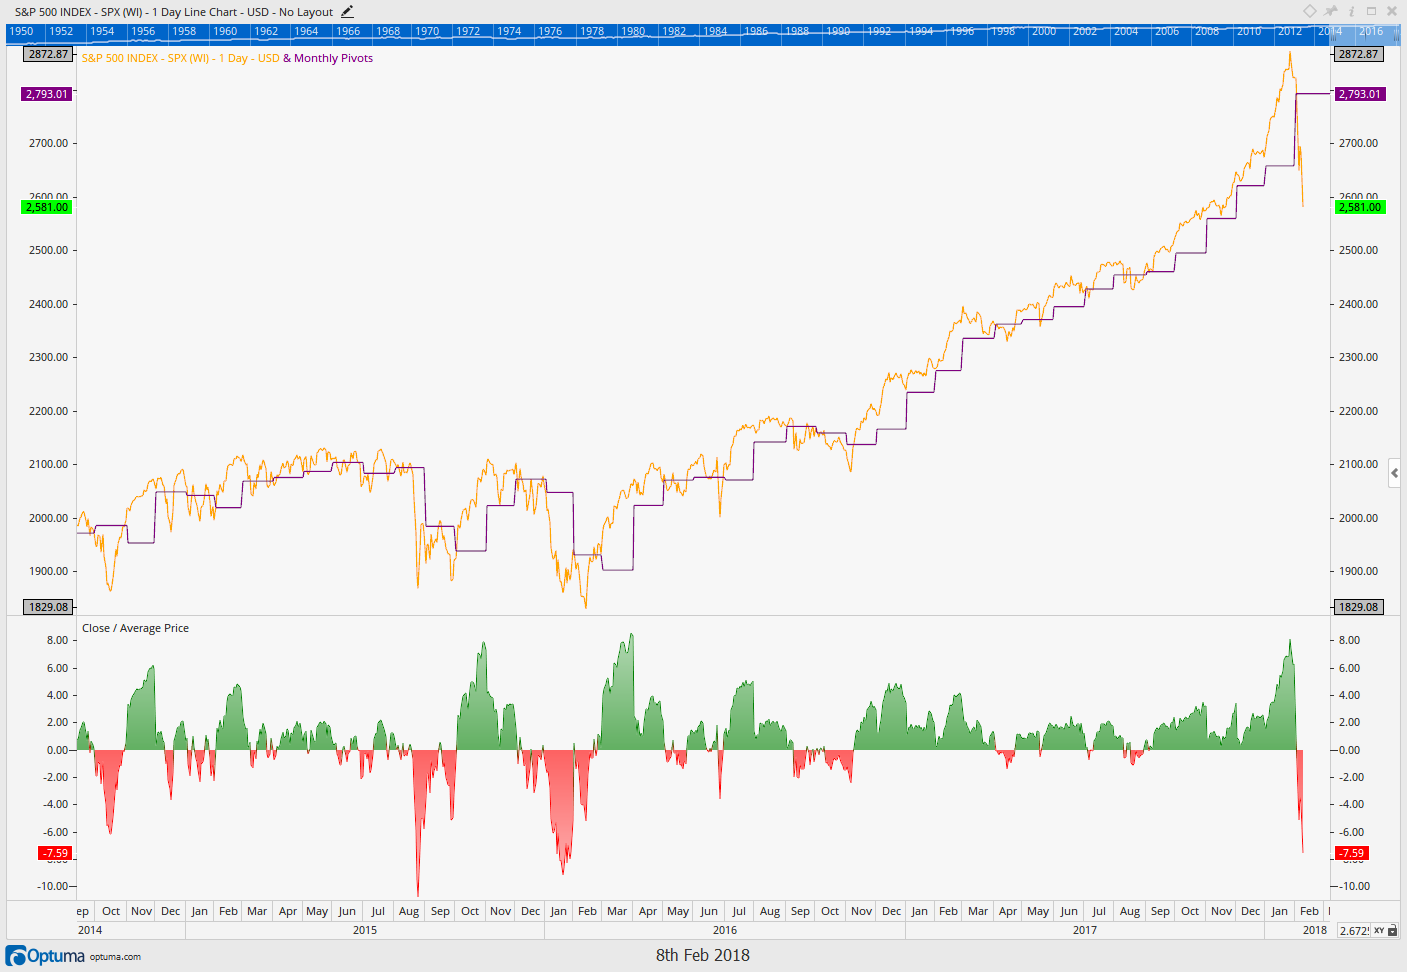
The chart below shows the same chart as discussed in our update two weeks ago with the S&P 500 (in orange) along with the prior month’s average price (in purple).
The bottom indicator reveals the percentage distance price is away from its prior month average, and the takeaway from that discussion was that the market (at 6% above the prior month’s average price) had only been that stretched above its average price 9 times over the past 7 years with seven of those nine instances resulting in a flat to down market at some point within the next few months.
In other words, putting new money to work at those stretched prices had an elevated amount of risk associated with it. The market has since heeded to that historical precedent and indeed pulled back to levels that are now over 7% lower than January’s average price (and down 10% from the all time high). So, once again that signal turned out to be a beneficial one, and we are now in the midst of the market’s first meaningful pullback in almost two years. But does this mean the bull market is over?
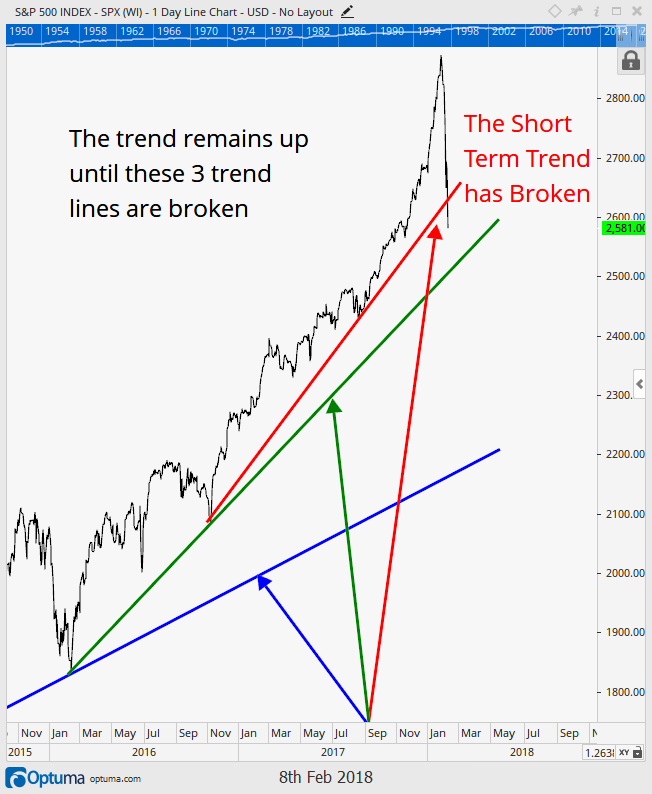
The chart below reveals the longer terms have not yet been affected by the recent short term market gyrations. The short term trend has broken down after the 10% pullback in the markets, but the intermediate and longer term trends remain intact. This is why we remain with some equity exposure at this juncture. However, further deterioration in price would have us continue our trend of raising cash.
Bond Market:
Another persistent theme we have been following is the continued deterioration of the bond market. We first wrote about this expectation in our inaugural ‘Insights’, published July 13, 2017, and since then the bond market has seen a fairly swift move higher in yields (and lower in price).
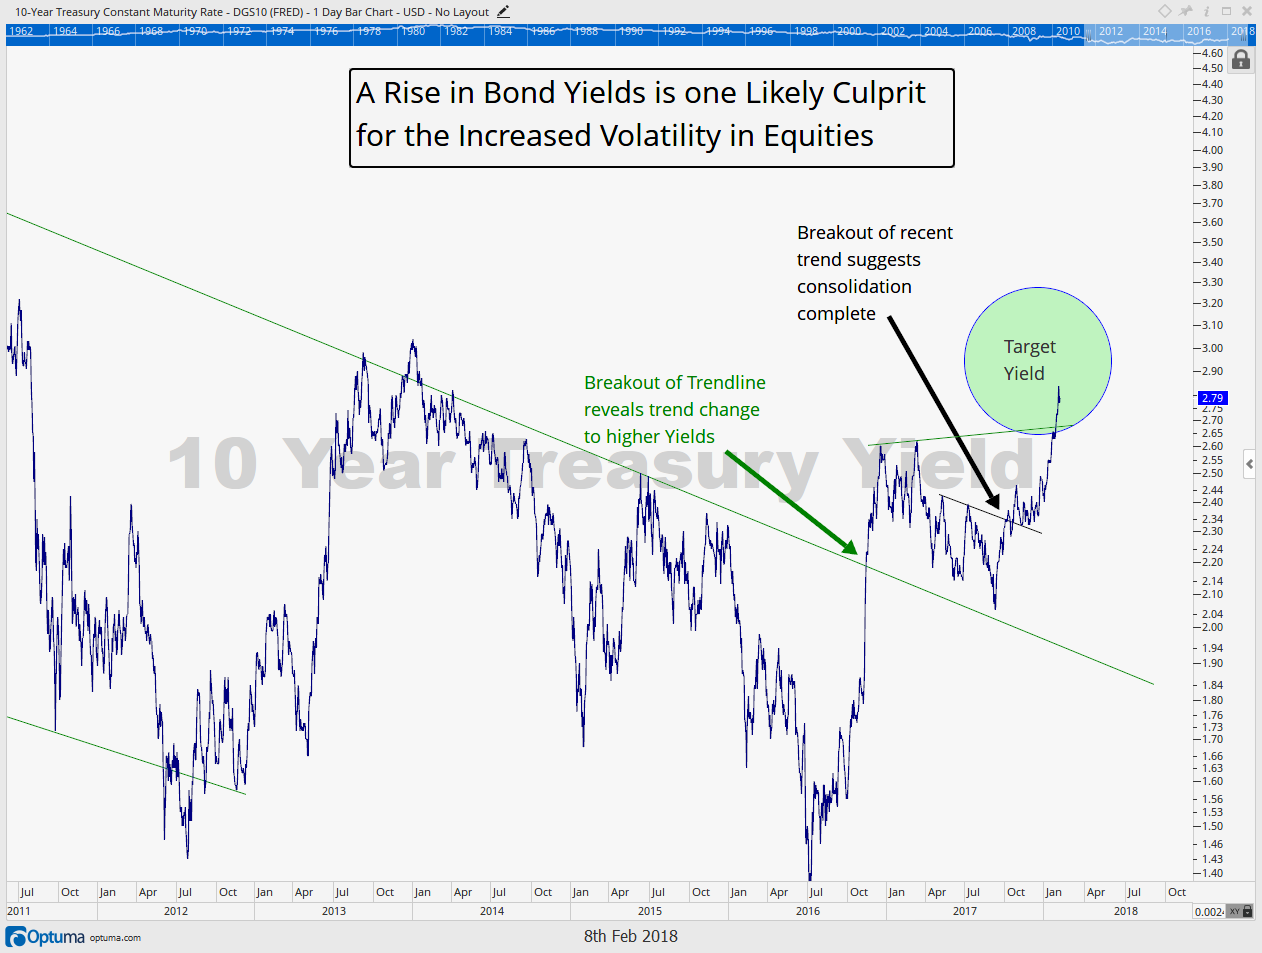
The next chart is one we published in October with our projection of a move toward 3% on the 10 Year Treasury. Updated we see that the target yield discussed then has already been reached as the 10 Year moves toward the 3% level.
Remember a higher bond yield affects not just bond prices, but it also affects equities prices. If you are looking for yield, why would you buy the S&P 500 with a yield of just 1.75%, when you can get a safer Treasury Bond that pays above 2%?
The September 29, 2017 ‘Insights’ went more in depth as to how bond yields affect stock prices, but suffice it to say that a rising yield environment is not good for bonds, it is not good for stocks, and it is not good for commodities (which provide no return and actually cost money to carry).
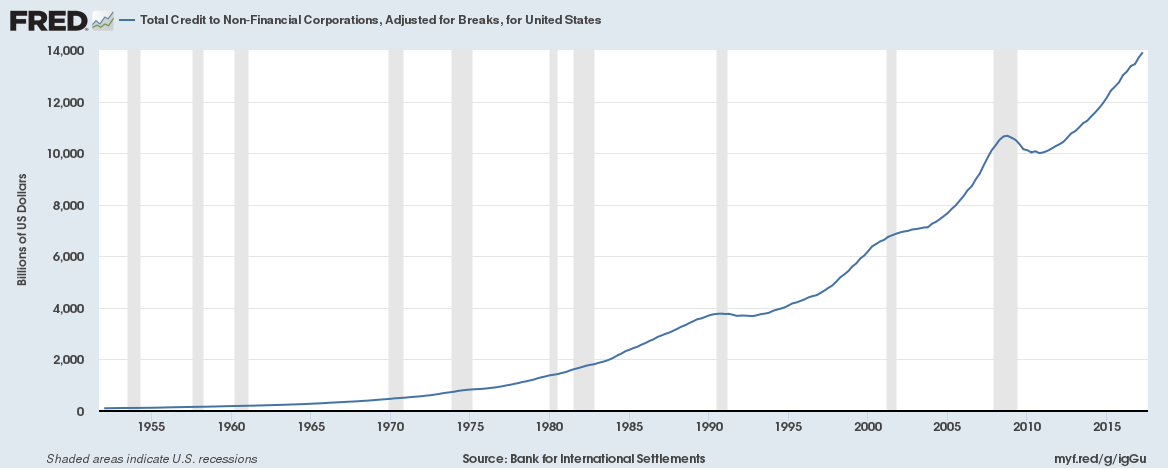
Another reason to be concerned about rising bond yields is the chart below from the Federal Reserve.
There is a persistent thought on Wall Street that corporate balance sheets are “stronger than they have ever been”. But, this is simply not true.
The chart below shows that debt to non-financial corporations sits at an all time high approaching $14T. This means there is now $3T more in debt today on corporate balance sheets than there was preceding the financial crisis.
This may not be such a huge problem in a low interest rate environment, but as interest rates rise, these corporations will be refinancing at higher rates, increasing interest expense and lowering earnings.
The reality is corporations have used the low interest rate environment to essentially lever up their balance sheets, using the increased debt to buyback shares and fund other short term priorities. Eventually this will probably come back to haunt, after 5 years when their debt comes due, they don’t have the cash to pay it back, and they must refinance.
Or they just convince Philadelphia to keep working.
Our clients have unique and meaningful goals.
We help clients achieve those goals through forward-thinking portfolios, principled advice, a deep understanding of financial markets, and an innovative fee structure.
Contact us for a Consultation.
Neither the information provided nor any opinion expressed constitutes a solicitation for the purchase or sale of any security. The investments and investment strategies identified herein may not be suitable for all investors. The appropriateness of a particular investment will depend upon an investor’s individual circumstances and objectives. *The information contained herein has been obtained from sources that are believed to be reliable. However, IronBridge does not independently verify the accuracy of this information and makes no representations as to its accuracy or completeness. Disclaimer This presentation is for informational purposes only. All opinions and estimates constitute our judgment as of the date of this communication and are subject to change without notice. > Neither the information provided nor any opinion expressed constitutes a solicitation for the purchase or sale of any security. The investments and investment strategies identified herein may not be suitable for all investors. The appropriateness of a particular investment will depend upon an investor’s individual circumstances and objectives. *The information contained herein has been obtained from sources that are believed to be reliable. However, IronBridge does not independently verify the accuracy of this information and makes no representations as to its accuracy or completeness.
