Predicting what markets will do is an effort in futility. Too many people proclaim their brilliance by making guesses on where markets will be in 6 months, next year, or many years in the future. Sometimes they get it right, but that doesn’t mean it was prudent to do so. We believe in listening to the markets and positioning accordingly. The foundation of successful investing, in our opinion, is to have a specific plan for each asset in your portfolio, and knowing what you will do if certain things occur. Buying assets with no plan, or simply holding a portfolio of various assets regardless of market conditions, is not investing, it is gambling.
[maxbutton id=”5″ url=”https://ironbridge360.com/wp-content/uploads/2018/08/IronBridge-Insights-2018-08-10-Plan-dont-Predict.pdf” text=”View PDF” ]
FIT Model Update: Market Correction
![]()
Sentiment: Market sentiment in January 2018 as measured by “Daily Sentiment Indicator” reached as high as 96 (on a scale of 100). As a contrarian indicator sentiment shows us how bullish or bearish the market is, and when the market is the most bullish is usually times when a temporary (or larger) top can form. This played out in January. Now, this sentiment measurement has again returned to an 85, and sentiment tops typically occur at levels above 75. Since sentiment follows the market, a decline in sentiment often follows and coincides with a decline in the markets. Current sentiment levels have us watching for a short term top.
Portfolio Insights
Plan, Don’t Predict
“Prediction is very difficult, especially about the future.” – Niels Bohr, Scientist
This week, the S&P 500 moved within 9.4 points of the all-time high, or a mere 0.33%. While it has moved away slightly from the highs, it is only one or two good days away from a break higher.
In our March 9th Insights report, we discussed four possible market outcomes. You can read the report HERE.
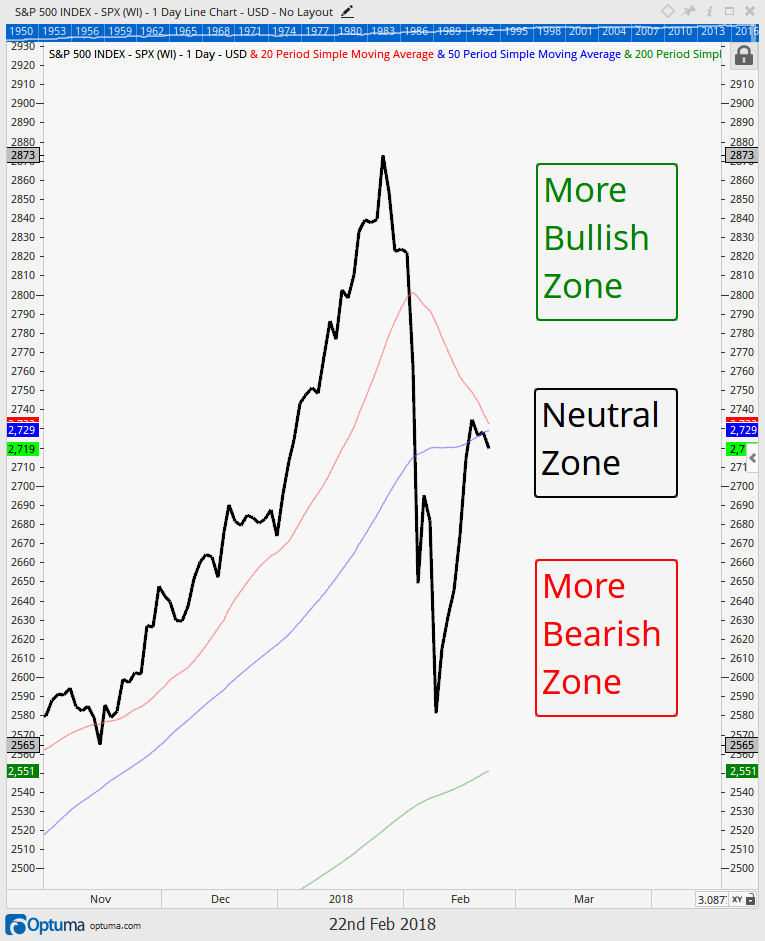
In February and March, and depicted in charts similar to the one to the right, we discussed four potential outcomes:
- Expectation #1: New Lows
- Expectation #2: Headfake Higher then New Lows
- Expectation #3: New Highs Volatility is Over
- Expectation #4: Sideways Consolidation for Weeks/Months, then New Highs
Two of these potential outcomes suggested higher prices were ahead. Expectation #4 appears to be what happened. The market was choppy for a few months, then began to make a more concerted move higher in July and August.
At the time, as noted in the chart below, we identified multiple levels that would trigger buy signals, resulting in equity exposure to be increased back to the levels clients had prior to the February drop. We have since stuck to this process, and as a result clients are back to being almost fully invested, with only one hurdle left for the market to overcome…new all time highs.
What should we expect now?
Before we get into the three scenarios, let’s take a brief inventory of both the good and bad things that could press the market towards its next move.
Good (Tailwind):
- Overall Economy. GDP posted a strong 4.1% growth rate in the second quarter.
- Corporate Earnings. (see more in the section below on this)
- Inflation. Recent readings on inflation show that inflation is increasing, but not at a detrimental pace.
Bad (Headwinds):
- Valuations. Unless one makes unrealistic assumptions about future earnings growth, stocks are over-valued at current levels by many measures.
- Fewer Stocks Participating. In January, more than 20% of the S&P 1500 (yes, 1500 not 500) were making new 52-week highs. This week with the market about to make another new high, only 6% of companies were at 52-week highs. This means that the current market is weaker now than in January.
- Fed. The Federal Reserve is embarking on “quantitative tightening”, withdrawing $40 billion per month from markets. The accommodative environment is over.
- Interest Rates. Higher interest rates can pose a threat to stock prices, as the risk-free return rises.
- International Stocks. International and Emerging Market stocks continue to be extremely weak. Emerging Market stocks are nearly 20% lower than they were in January.
- Tech Stocks Showing Stress. The undisputed leaders over the past few years are starting to show signs of weakness.
- Trade Wars and Geopolitics. While these remain potential risks to markets, we believe these to be lower risk than many other investment firms.
In the current environment, it becomes very easy to view the market through whatever lens you prefer. If someone believes the market will move higher, there is plenty of strong evidence to support that theory. Conversely, if one wishes to make a case for a much lower market, data can support that theory as well.
This is one of the primary reasons we stress that you must use a disciplined and unemotional process to determine how to position portfolios, rather than simply trying to guess which way the market will go.
Next our the latest market possibilities, and what our process tells us about what actions to take for each one.
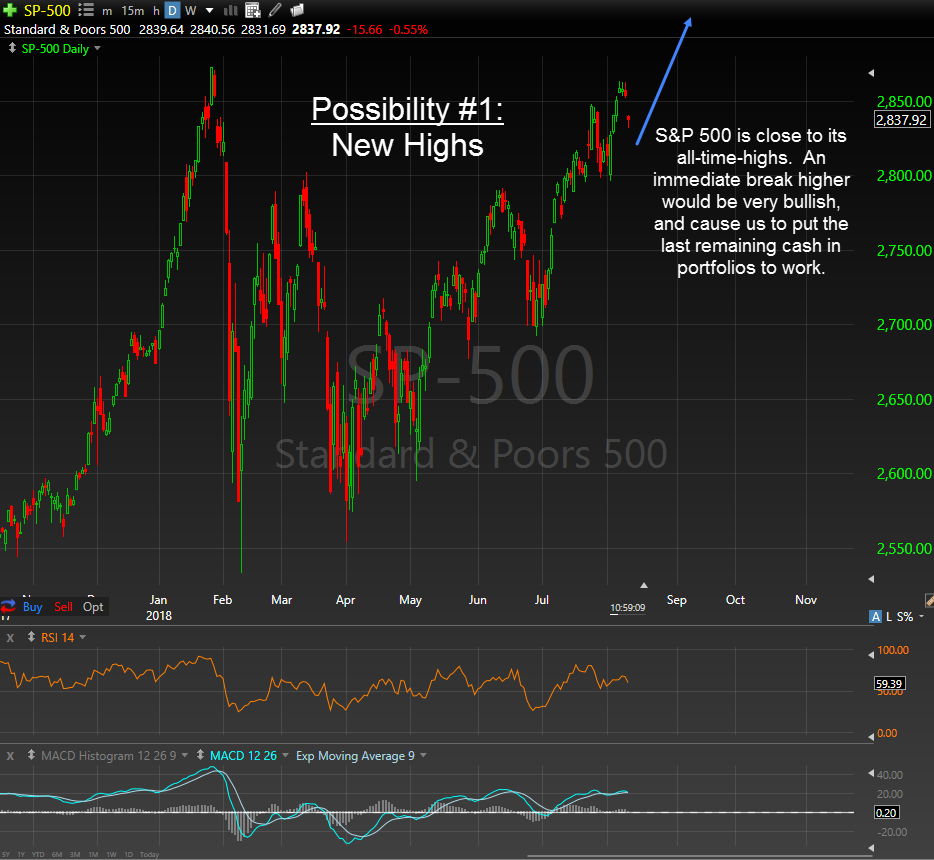
Possibility #1: New Highs
This is obviously the scenario that we all hope occurs. If the market decides to break to new highs, it would likely result in a continued move higher throughout the remainder of 2018, and probably into 2019.
Actions to Take:
- Become fully invested in target allocations with a sustained break above 2873.
- Focus on momentum to generate “alpha”, or outperformance relative to benchmarks.
- Raise stop-losses across the portfolio to reflect this breakout.
Areas that should Benefit:
- US Stocks, particularly small and mid caps.
- Floating Rate Bonds, as interest rates continue higher.
- Commodities and other inflation-sensitive investments.
Areas that may be Hurt:
- Fixed Income, especially longer-duration holdings.
- International Stocks and Bonds as the U.S. market remains the top performer around the world.
Possibility #2: Choppy, then Higher
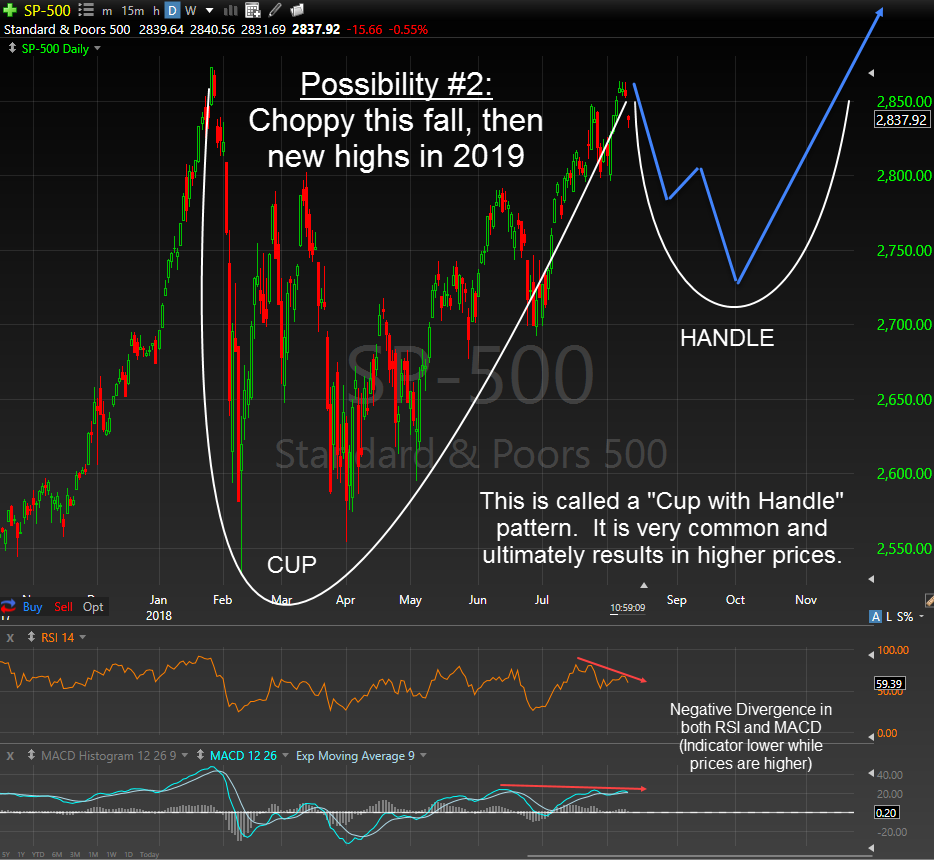
This scenario would simply delay the market’s ascent to new highs. There is a common pattern in stocks that has the potential to take shape with the test of the all time high we are seeing now, called a “Cup with Handle”. It is illustrated on the “Possibility #2” chart to the below.
Actions to Take:
- Keep discipline with an exit strategy, as the market still has many potential outcomes.
- Become fully invested in target allocations with an eventual break above 2873.
- Watch the behavior of aggressive investments versus safer ones. A relative increase in safer investments could suggest further downside.
Areas that should Benefit:
- US Stocks, particularly lower-volatility stocks.
- Defensive stocks this Fall, then more aggressive stocks on a break higher.
Areas that may be Hurt:
- International Stocks and Bonds, if the US Dollar continues its rise.
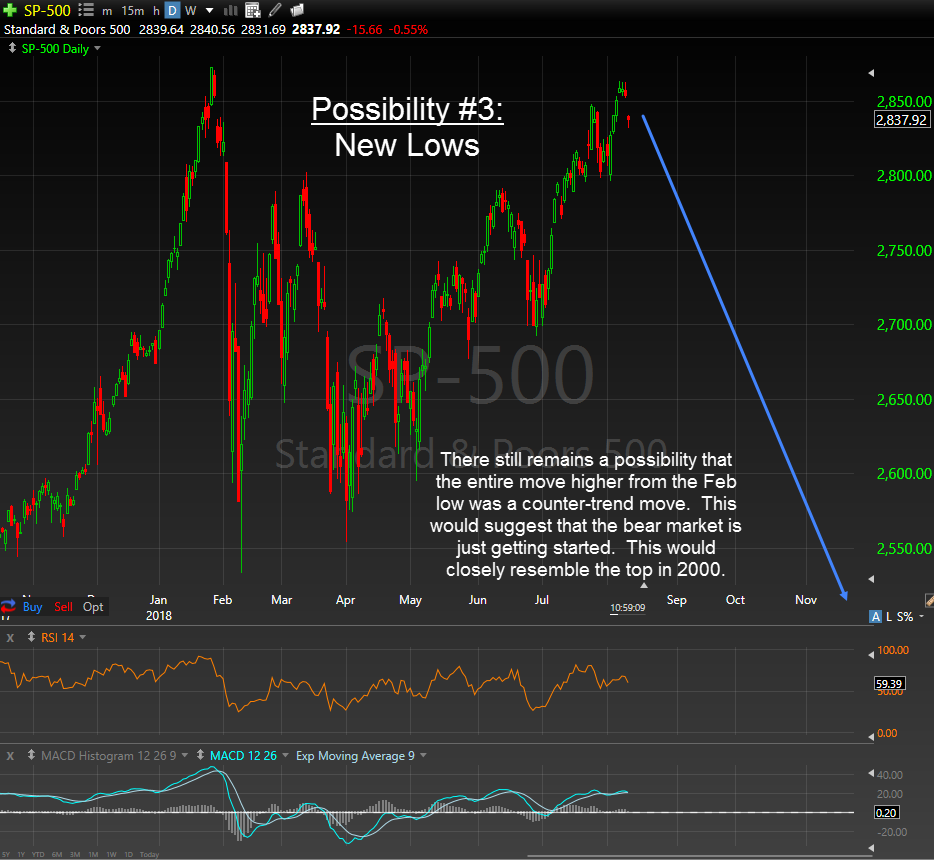
Possibility #3: New Lows
There is a saying that the market likes to punish as many people as possible, and this scenario would certainly do that. Most talk of a re-test of the February lows is gone, and optimism has taken back the reins. This may be a lower probability scenario, but is one that we cannot rule out.
Actions to Take:
- Stick to your exit strategies. Exposure to stocks would gradually decrease as exit signals occur, and cash in portfolios would rise. The end result is a portfolio with much lower risk.
- There would likely be very few buy signals, as our algorithms would rank cash higher than most other assets. Patience would be required as the conditions that would potentially cause this type of move reverted to sometime more positive.
Areas that should Benefit:
- Fixed Income, particularly higher quality and longer duration bonds.
- Defensive stocks, such as healthcare and utilities.
Areas that may be Hurt:
- US Stocks.
- International Stocks and Bonds.
- Junk Bonds.
- Commodities.
As we mentioned earlier, “In the current environment, it becomes very easy to view the market through whatever lens you prefer”. There certainly remains data to also support further downside, if the market wants to move that way.
We strongly believe that markets cannot be successfully predicted with any regularity. Attempts at predicting them have been proven to be statistically no better than random guesses. We cannot stress that enough. Thus, our philosophy is to listen intently to the markets, because they do convey plenty of incredibly valuable information.
We believe we are in the later stages of the market cycle that began in 2009. Complacency will be punished. Maybe not immediately, but eventually. There will likely be opportunity for profits before that happens, so we will continue to listen to what the market is saying, and position clients accordingly.
Market Microscope
Coin Toss
Earnings Continue to be Strong
Over 80% of S&P 500 companies reporting earnings have beaten their earnings expectations for the 2Q 2018. This used to be a big deal, but as Jason, founder of SentimenTrader states, “much like high school and college grades, there has been ‘average inflation’ – nowadays almost everyone is above average. The trend of earnings surprises is clearly higher”.
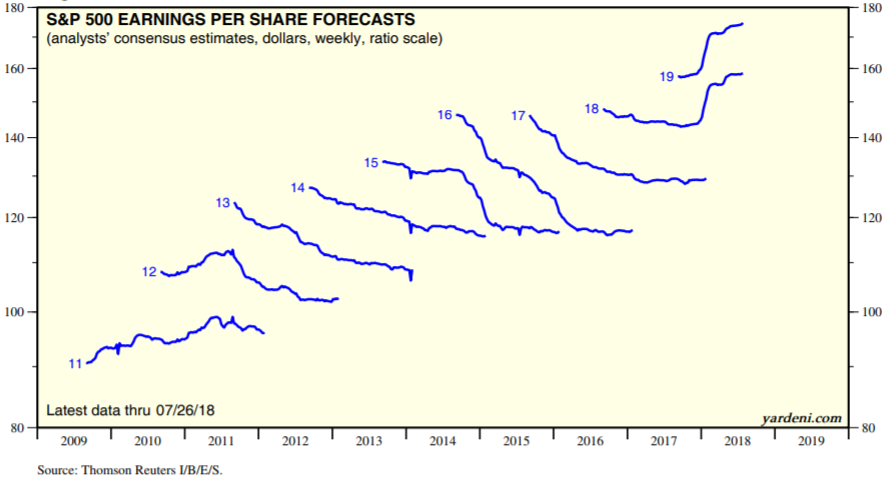
Even with the “average inflation” phenomenon, a beat number of 80% thus far this quarter is near an all time high (the average number of “beats” has been around 67% of the time). No doubt about it, 2018 earnings have been great and are expected to remain that way into 2019. But before we get ahead of ourselves, there has been a very clear tendency for earnings expectations to be high when they are first discussed 1+ years before they are due but then ratcheted down to more realistic numbers ahead of the actual earnings release date. The first chart below shows this earnings history and is known by its creator, Ed Yardeni of Yardeni Research, as the “squiggles chart”.
The above chart reveals the S&P 500’s consensus earnings estimate history of the stated year from when those earnings first came out to when they were actually reported. For example, notice 2011’s “squiggle” started in mid-2009 and 2018’s squiggle started in 2016? The 2018 squiggle ends with the current 2Q 2018’s estimates and will continue to be updated through Dec 2018’s earnings. We don’t yet have 2020 numbers, but we should start getting those beginning next quarter. One key thing to notice is that there certainly has been a persistent over-promise, then under deliver trend to earnings each year starting in 2012. Every year started out with high expectations, but estimates, however, were continuously ratcheted down as more information was learned.
In order to connect the dots from the opening paragraph, which says over 80% of companies are beating their estimates with the takeaway from the above chart, we should recognize that the “earnings beat” number is the here and now earnings estimate, not the one that was expected during previous periods. Since mid-2015, when the original 2017 operating earnings estimate was near $145, those estimates continued to be ratcheted down from 2015 to end 2017 nearer $130 operating earnings per share. In Dec 2017, around 80% of companies were beating their (now reduced to below $130) earnings estimates as well.
2018, however, is interesting for two reasons, one, earnings estimates are actually increasing (rather than declining), and companies are still beating those ratcheted up earnings estimates. Indeed, it is a special and positive year.
One key point to make about 2018 is the huge spike upward in earnings expectations. 2018 was well on its way to another year of over promising and under delivering, but the tax law changes occurred and earnings got a massive bump higher. That same bump affected 2019’s estimates as well.
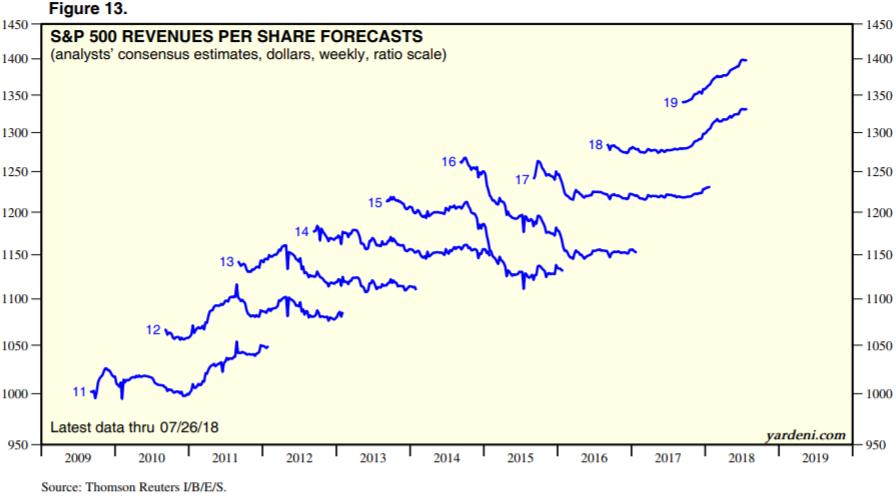
Another very interesting aspect is this same bump is occurring in revenue expectations. The chart below reveals the revenue “squiggles”. Revenues had been following the same over-promise and under deliver trend of the last five years, but that trend is no longer. The tax cuts have affected revenues positively as well, which is probably a side effect of them as companies expect their customers benefiting from the tax cuts to spend more as a result (spending as opposed to saving). What has not showed up (at least not yet) seems to be the tariff ramifications. Interestingly there is no down-tick or negative expectations as a whole to earnings from the recent tariff banter.
So earnings and revenue remain strong, so we should be all in bullish and expecting another very strong stock market in 2018 and 2019, right? That very well could be the case but there is an issue with this kind of thinking and it involves those pesky beings we like to call humans.
Making investment decisions based solely on earnings is a difficult proposition. The stock market is driven off of expectations as much as anything else, and expectations are driven off of human behavior. Even when earnings and/or revenues “beat”, stocks can and do sell off, and there are countless examples of this through history.
One great example of this just occurred in July 2018.
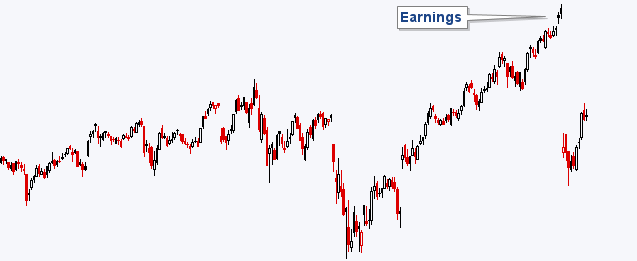
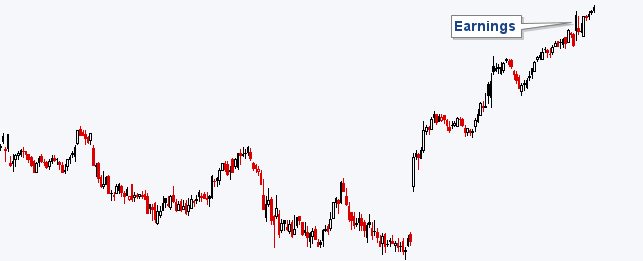
Check out the first two graphics below. Which one is Facebook’s earnings this quarter, and which is First Data Corp’s (FDC)? Shown on the right side is the latest 2nd quarter’s data.
Both stocks beat their earnings estimates by 2 cents, but both stocks behaved extremely differently from one another in the after math. One stock had an earnings estimate of 37 cents with a 2 cent beat of 39 cents actual, while the other stock had an estimate of $1.72 and also beat it by 2 cents, coming in with earnings of $1.74.
Both of these companies beat their earnings estimates, yet they both did not behave the same, nor as expected with an equity price rally.
One of the charts below is Facebook (ticker:FB) and the other chart is First Data (ticker:FDC). The markets responded in completely opposite ways to the same outcome.
Which Set of Earnings is Facebook and which is First Data?
Which Chart is Facebook and which is First Data?
How could these stocks have such vastly different outcomes when their earnings beats were exactly the same? Humans is how. Human beings have their own expectations that go well beyond consensus earnings estimates, and many of these expectations and thoughts may not even have to do with financials or the company at all. Humans could just feel like selling. They may have not liked the tone of Mark Zuckerberg. They may have found a different investment, they may have needed to pay a margin call, they may have even needed the money for a new house or to make bail.
As you may recognize, the second chart above is Facebook, which fell 20% following earnings. Who knows why, but the beautiful thing is that we may not need to know why. In fact it is impossible for anyone to ever know exactly why Facebook fell 20% and First Data rallied on the same amount of earnings beat. The market has proven time and time again that trying to rationale one, two, three, or many exogenous reasons as to why a stock price does what it does is a fool’s errand. Nobody knows why for certain.
It may be possible to predict what the earnings per share will be. That’s all math, and many analysts get paid a lot of money to do just that, but it is impossible to know exactly how a stock will respond in price to these events, such as earnings. The graphics above help put this in perspective as two companies which have the same earnings beat the same amount, do the exact opposite thing, to a drastic degree.
Taking this a step further, it is probably dangerous to invest in a company based solely on a hunch that it will beat earnings, as you walk a tight rope of “luck or skill”. Maybe it will beat and price will rise, but then again, it might pull a Facebook and fall. Sometimes beating just isn’t enough. On the flip-side there are also countless examples of a stock missing earnings expectations, yet it rallies in price. There are even examples of the same stock beating one quarter and rallying, and missing estimates the next quarter, and rallying. How come?
The same collection of unpredictable humans making decisions is the cause of all of these outcomes. Humans are the unknown variable that cannot be predicted. For this reason, humans have even been labeled as “irrational”, and it’s hard to argue with that considering human reactions can be completely opposite toward the exact same event.
This is why we at IronBridge don’t try to predict the market; You just can’t with any long-term success. Instead we prefer to listen to the market and try to recognize that there really is no “why”, but instead there is just “is”. Once an investor can get past this conundrum, then the doors toward success can more easily be opened. We don’t pretend to know exactly what the market will do in the future, we just hope to be along for the ride while it’s going up, and sitting on the sidelines while it goes down.
Whether this is because of better earnings, growing GDP, tariffs, currency wars, or Trump, who cares, it just is!
Invest wisely.
Our clients have unique and meaningful goals.
We help clients achieve those goals through forward-thinking portfolios, principled advice, a deep understanding of financial markets, and an innovative fee structure.
Contact us for a Consultation.
Neither the information provided nor any opinion expressed constitutes a solicitation for the purchase or sale of any security. The investments and investment strategies identified herein may not be suitable for all investors. The appropriateness of a particular investment will depend upon an investor’s individual circumstances and objectives. *The information contained herein has been obtained from sources that are believed to be reliable. However, IronBridge does not independently verify the accuracy of this information and makes no representations as to its accuracy or completeness. Disclaimer This presentation is for informational purposes only. All opinions and estimates constitute our judgment as of the date of this communication and are subject to change without notice. > Neither the information provided nor any opinion expressed constitutes a solicitation for the purchase or sale of any security. The investments and investment strategies identified herein may not be suitable for all investors. The appropriateness of a particular investment will depend upon an investor’s individual circumstances and objectives. *The information contained herein has been obtained from sources that are believed to be reliable. However, IronBridge does not independently verify the accuracy of this information and makes no representations as to its accuracy or completeness.

