The stock market is never obvious. It is designed to fool most of the people, most of the time.
Jesse Livermore, stock trader and author
Stock markets are complex.
Unfortunately, there are many variables that move markets higher or lower.
However, not all variable are created equal.
Two of the big ones are the P/E ratio and earnings.
The P/E ratio (or price-to-earnings ratio) is a simple measurement that takes price per share of a stock or index and divides it by the earnings per share.
If a stock trade at $100, and earns $5/share, its P/E ratio is 20. ($100 divided by $5).
Another way to think about this is that the P/E ratio is a gauge of how much an investor is willing to pay per dollar of earnings.
One interesting aspect of the market increase this year is that it has been exclusively due to an increase in valuations.
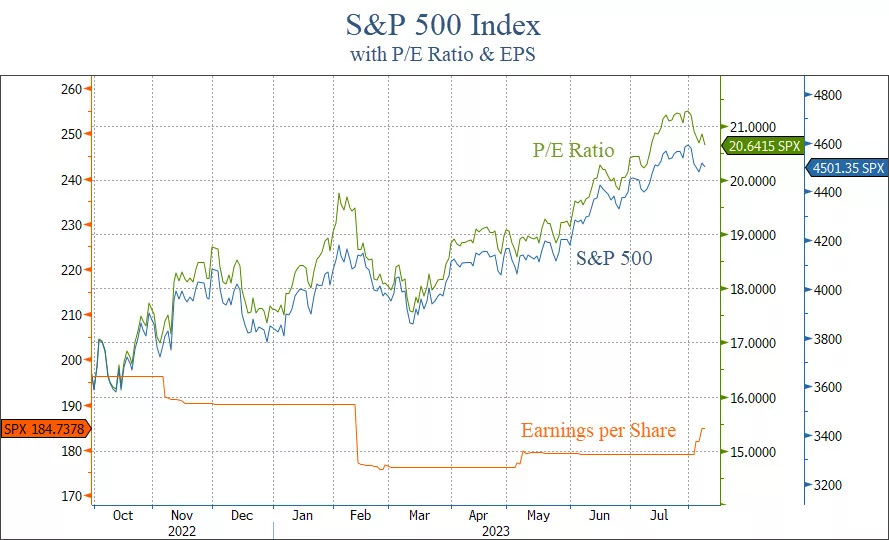
Last October, the P/E ratio for the S&P 500 index was 16.3.
Today, it is 20.6.
Meanwhile, earnings for the S&P 500 have fallen 9.3% since last summer.
The chart below shows this discrepancy.

In this chart, the P/E ratio of the S&P 500 (shown in green) has mirrored the price of the S&P 500 (shown in blue).
Meanwhile, earnings (in orange) have consistently fallen over the past year. Granted, there is a glimmer of hope with the slight increase so far this quarter.
This discrepancy between the P/E ratio and EPS is the result of market participants paying more per dollar of earnings, and is essentially a sign of speculation.
However, this discrepancy could actually be a good sign.
Why?
This type of behavior typically happens when markets exit a recession.
Prices tend to move higher first, before the fundamentals start to reflect a more positive environment.
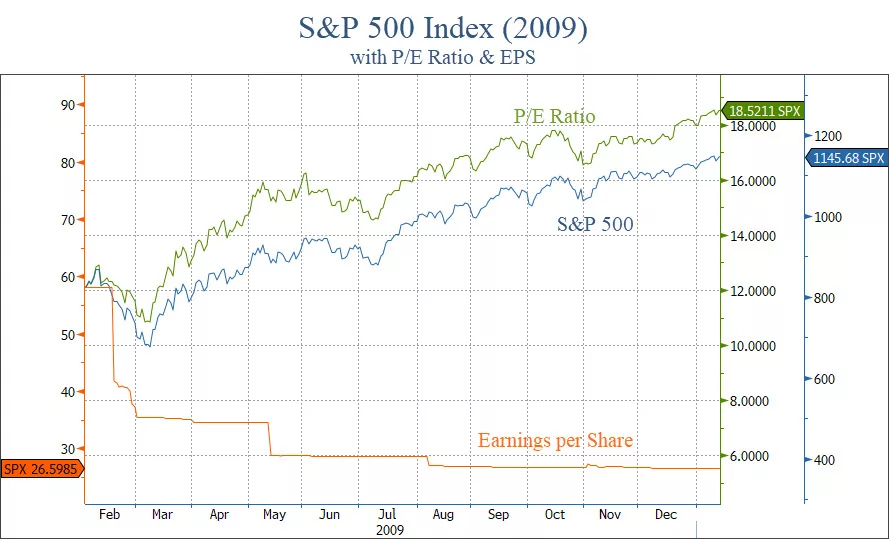
The next chart shows this same dynamic coming out of the 2009 lows.

The S&P and its P/E ratio rose in tandem after the lows in March of 2009, while EPS continued to fall.
There are major differences to consider in the comparison with 2009:
- Today, valuations are elevated by historical standards at 21. In 2009, the P/E ratio was 12.
- Interest rates today are over 5% and rising. In 2009, they were zero with no expectation of going up anytime soon.
- We had one of the largest recessions in history in 2009, while we haven’t had one at all today.
- Sentiment was extremely pessimistic in 2009, with optimism the overwhelming sentiment today.
So while today’s environment is very different from that of 2009, the behavior of the markets is very similar.
If earnings can start catching up to valuations, that will help remove the risk of a major decline in stocks.
Bottom line
While we are not out of the woods just yet, there are many positive developments happening.
With elevated valuations like we have now, the possibility of entering a long-term bull market seems low.
But the possibility of a major bear market is decreasing as well.
That means a sideways, choppy market for a long period of time could be what ends up happening.
In that type of environment, income and dividends will be important.
It will also be very important to not chase every market rise, and to not feel FOMO when markets go through periods of positive price action.
In a sideways market, the turtle wins the race.
Invest wisely!