• Skip to main content
  • Skip to footer

IronBridge Private Wealth

Forward with Confidence

  • Home
  • Difference
  • Process
  • Services
  • Insights
    • IronBridge Insights
    • Strategic Wealth Blog
    • Strategic Growth Video Podcast
    • YouTube Channel
  • Team
  • Clients
  • Form CRS
  • Contact Us

covid

It Came from Left Field

November 29, 2021

Confused baseball player

Last Friday, the day after Thanksgiving, the market fell almost 1000 points. What was that all about?

First off, let’s put this move in context.

Volatility Spikes

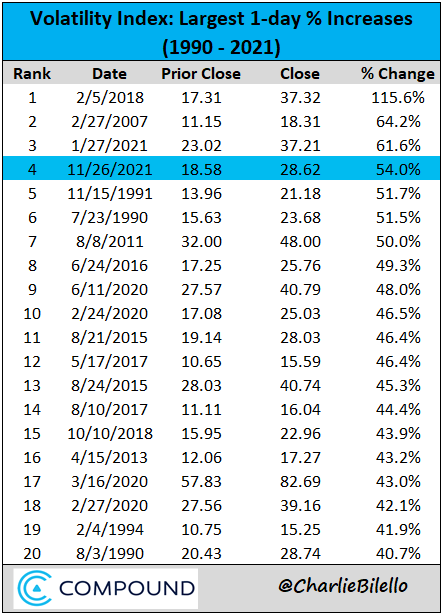
The VIX rose 54% on Friday. This was the fourth largest spike in the history of the volatility index, as shown below.

Largest 1-day increase in the volatility index (VIX) in history.

There are some interesting things that we find in this data:

  1. Surprisingly, the 3rd-largest spike happened this past January. Not pre-COVID January 2020, but this past January of 2021. (Like you, we don’t remember that either.)
  2. Three of these happened during the COVID crash (items 10, 17 and 18 in the chart above).
  3. Only 4 of these 20 spikes (20%) occurred during true bear markets. The other 80% occurred randomly during up-trends.
  4. The largest spike in VIX history happened a few years ago. It led to a 20% pullback in stocks.
  5. The 2nd largest spike happened in early 2007, nearly 8 months prior to the market top before the 2008 financial crisis.

This list tells us that the spike in the VIX last Friday was indeed historic. Let’s now look at this VIX spike on a chart, not just in a list.

The next chart looks at the VIX since just before the COVID crash.

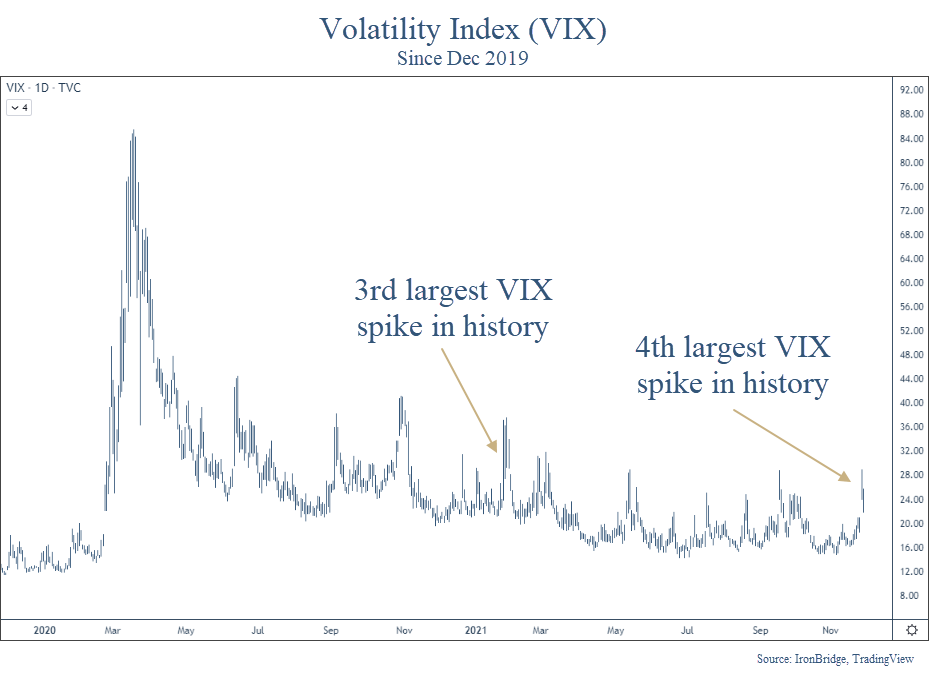
Well, that’s pretty strange. Friday’s spike higher was both historical and barely noticeable.

On first glance, it would appear that the VIX has done this many times during the past year.

Should we be Concerned?

With this volatility, should we expect Armageddon? According to mainstream media the Omicron mutation is going to be the worst mutation so far. But they are paid to sell commercials, not provide rational guidance.

Their constant hype of selling fear appears to be backfiring. Viewership is dramatically lower, and trust in the media is at an all-time low, and rightfully so. But we digress.

Bottom line, it’s easy to “blame” some kind of news for big market declines.

But the move on Friday looked to be more technical than anything else.

The day after Thanksgiving has notoriously low volume. Not many institutional traders are at their desk all day, and a small number of large trades can cause big dislocations when volume is low.

In addition, the market hasn’t had much volatility in the past year. So in a way, it made up for lost time.

So back to the question…should we be concerned?

Maybe.

Any time these types of moves happen, the most important development is ALWAYS whether we see follow-through or not.

As of this writing, markets are up almost 2%. We didn’t see any follow through lower just one day later. That’s a positive sign.

As the week goes on, we should start to get more clarity on what the market wants to do next.

We didn’t make any moves on Friday. Those are not the types of days to act upon.

That said, we do anticipate taking action in client portfolios this week:

  1. Our monthly trend signal resets on Wednesday, and that could cause us to raise cash.
  2. Big moves lower offer the potential to realize tax losses on certain positions. We can then offset some of realized gains that have occurred this year by selling some losers and rotating into different positions to avoid wash-sale issues.

Other than that, it appears for now that the move was simply random and out of left field.

The likely scenario is that we slowly move back towards all-time highs.

However, as always, we are going to stay vigilant in managing risk. And if that means increasing cash, we will do so as our signals tell us to. But for now, the move appears to be a random event that we should probably come to expect more of in the coming months and years.

Until then, we’ll keep watching the markets for clues.

Invest wisely.

Filed Under: Strategic Wealth Blog Tagged With: covid, markets, omicron, risk management, vix, volatility

Gas Prices Signal both Post-COVID norm and Inflation

June 8, 2021

Man's hand holding three hundred US dollars and gas nozzle while  pumping gas into parked vehicle

Over Memorial Day weekend, gasoline prices hit the highest for this holiday weekend since 2014.1

With the Colonial Pipeline outage in the rear-view mirror and an ever-increasing number of adults vaccinated, formerly cooped-up motorists made the most of what America has to offer. The average price jumped to $3.04 per gallon ($1.08 higher than last year’s lockdown prices) and oil prices have continued to demonstrate high demand in the week following. The Wall Street Journal noted a two-year peak on June 1, indicating prices exceeding 2019’s records.1,2

It’s not just prices at the pump that are increasing.

Crude oil, as shown in the chart below, is also showing a strong recovery from last year’s lows. This chart dates back to 2003, and shows just how high prices were in the early 2010’s.


Crude oil downtrend has been broken. A new trend higher has begun? Inflationary pressures are mounting.

The rise in prices signal two things:

  1. Inflation is coming back. We discussed this in our report last month titled “The Coming Inflation Wave(s)“.
  2. Post-COVID life is returning. These new peaks are a sure sign that things in America are returning to something like a pre-COVID normal. While there’s still a way to go, these indicators point to something like the world we once knew.

While we’ll all miss the cheaper prices at the gas pump, it stands to reason that as we begin to emerge from this unprecedented period, that there’s a summer out there to be enjoyed. You might be taking advantage of the weather, but we’re still working for you. Let me know if you have any questions about these developments and how they might affect your financial strategy.

1. CNBC.com, May 27, 2021
2. Wall Street Journal, June 1, 2021
The content is developed from sources believed to be providing accurate information. The information in this material is not intended as tax or legal advice. Please consult legal or tax professionals for specific information regarding your individual situation. This material was developed and produced by FMG Suite to provide information on a topic that may be of interest. FMG Suite, LLC, is not affiliated with the named representative, broker-dealer, state- or SEC-registered investment advisory firm. The opinions expressed and material provided are for general information and should not be considered a solicitation for the purchase or sale of any security.

Filed Under: Strategic Wealth Blog Tagged With: covid, energy prices, gas prices, inflation, oil

Footer

LET'S CONNECT

  • Email
  • Facebook
  • Instagram
  • LinkedIn
  • Twitter

AUSTIN LOCATION

6420 Bee Caves Rd, Suite 201

Austin, Texas 78746

DISCLOSURES

Form ADV  |  Privacy Policy  |  Website Disclosures

  • Home
  • Difference
  • Process
  • Services
  • Insights
  • Team
  • Clients
  • Form CRS
  • Contact Us

Copyright © 2017-Present by IronBridge Private Wealth, LLC. All rights reserved.