• Skip to main content
  • Skip to footer

IronBridge Private Wealth

Forward with Confidence

  • Home
  • Difference
  • Process
  • Services
  • Insights
    • IronBridge Insights
    • Strategic Wealth Blog
    • Strategic Growth Video Podcast
    • YouTube Channel
  • Team
  • Clients
  • Form CRS
  • Contact Us

elections

Gridlock is Good?

November 4, 2020

Markets across the globe surged today, despite election uncertainty. Just like in 2016, predictions about what would happen in the 2020 Presidential election were flat out wrong, as were market predictions for a market crash. It appears that gridlock, the Fed, and the potential for stimulus talks to resume are driving asset prices more than the uncertainty surrounding the election outcome.


“Gridlock is great. My motto is, ‘Don’t just do something. Stand there.'”

-William Safire, American author and New York Times political contributor


Given the fluid nature of the election results, we will be providing updates and context on portfolio positioning and analysis on how markets are responding.

We’ll keep these updates relatively brief, and we will likely be sending multiple reports over the coming days and weeks. As of this report, there has been no declared winner of the presidential election. However, it is becoming more likely that Biden could be the next President of the United States.

There are three main areas to discuss from yesterday’s election:

  1. Key Takeaways
  2. Market Analysis
  3. Portfolio Positioning

Let’s dive in.

Key Takeaways

Many people predicted that a contested election would throw the markets into turmoil, with numerous “experts” predicting a market crash if this happened.

There was no clear winner on Tuesday or Wednesday. Multiple states are still too close to call. Trump is threatening lawsuits and recounts. Neither side is budging. Results may not be known this week.

This is the exact scenario “experts” predicted would crash the markets.

Instead, markets were up substantially today.

Why?

Here is our initial reaction to the election results thus far:

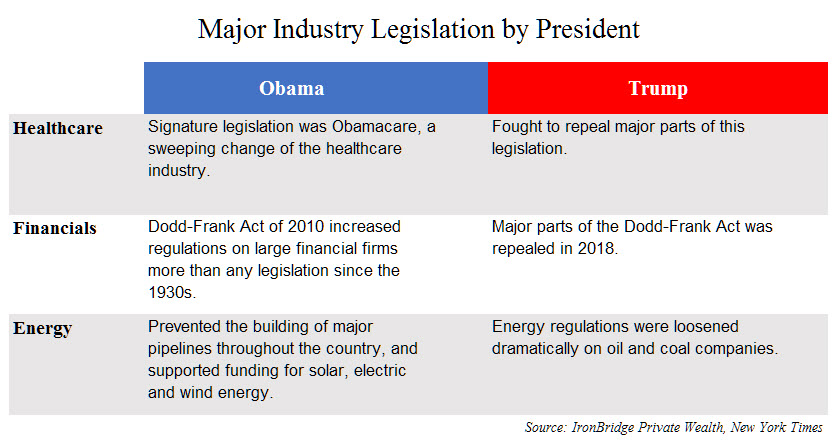
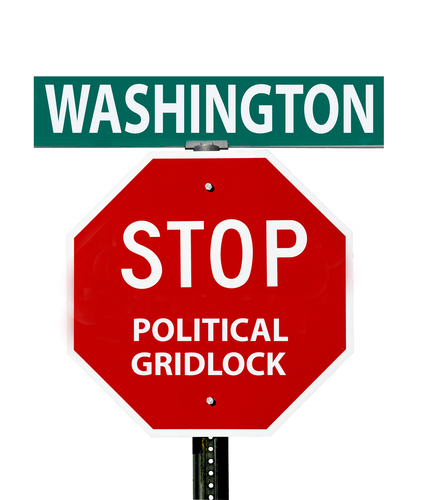
  1. Gridlock is good. There was no blue wave as many people predicted. The market is interpreting this to mean that massive tax increases on individuals or businesses will likely not happen. Some tax changes should be expected, but they may not be as punitive as many initially feared.
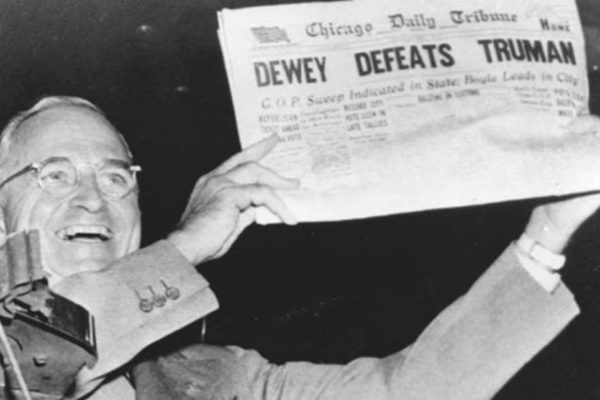
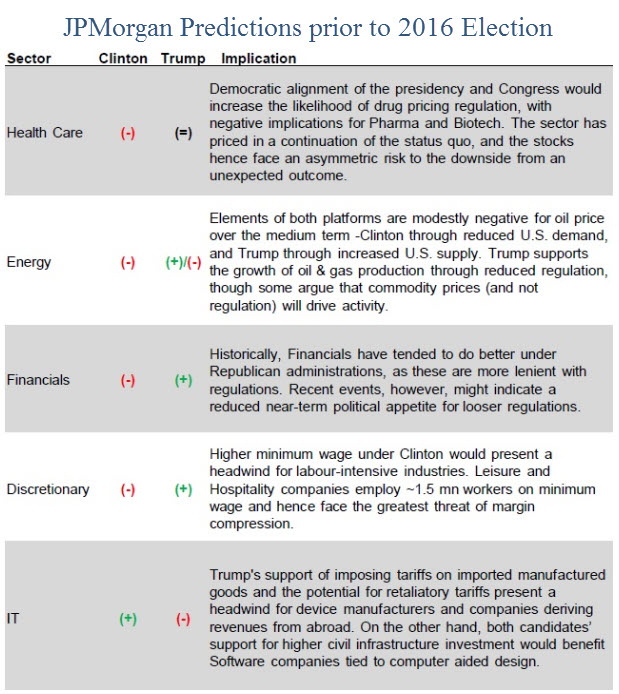
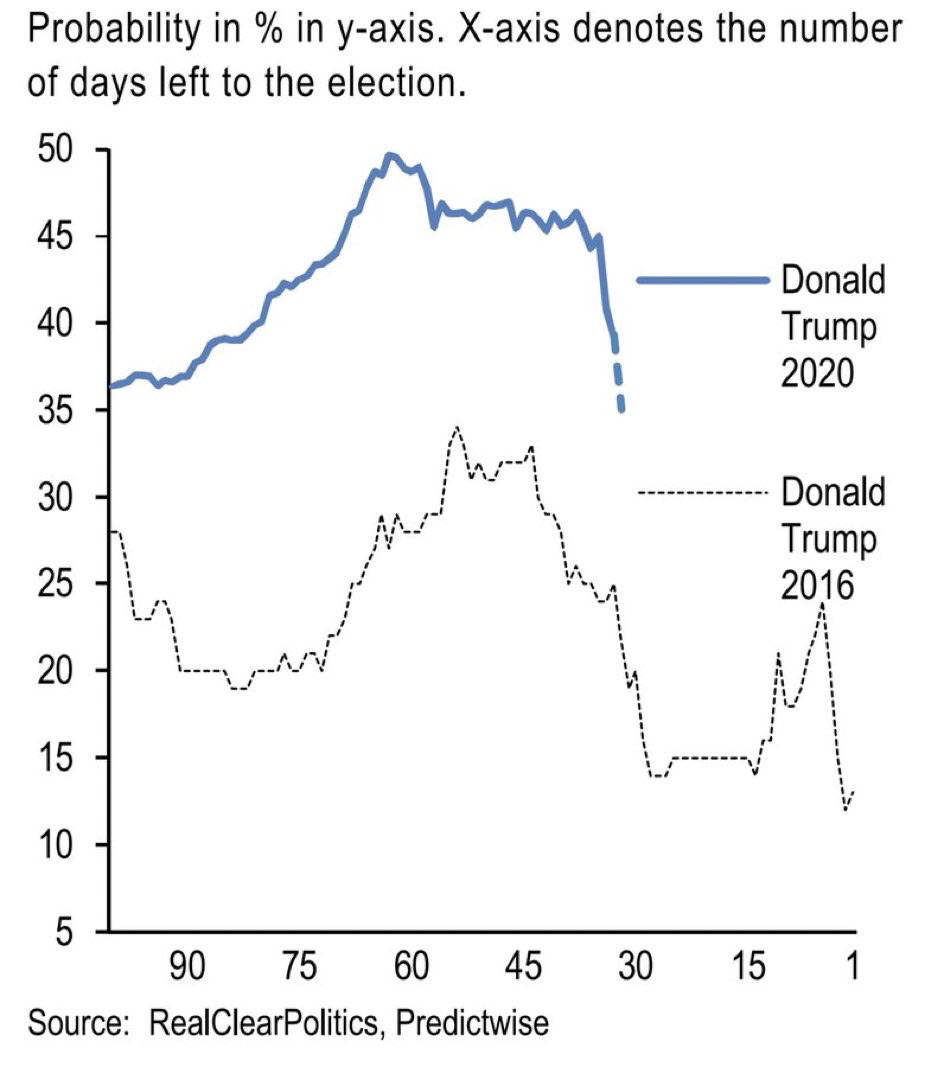
  2. Predictions are Useless. In 2020, as they did in 2016, the “expert” pollsters had it massively wrong. So did the “expert” investment firms predicting market turmoil. Don’t use predictions as a basis for making political or investment decisions.
  3. Price is King. Prices are ultimately all that matter to your account values. Our job is to grow your portfolio during times of opportunity and reduce volatility during times of stress. Prices are telling us it is a favorable time to be holding risk assets.
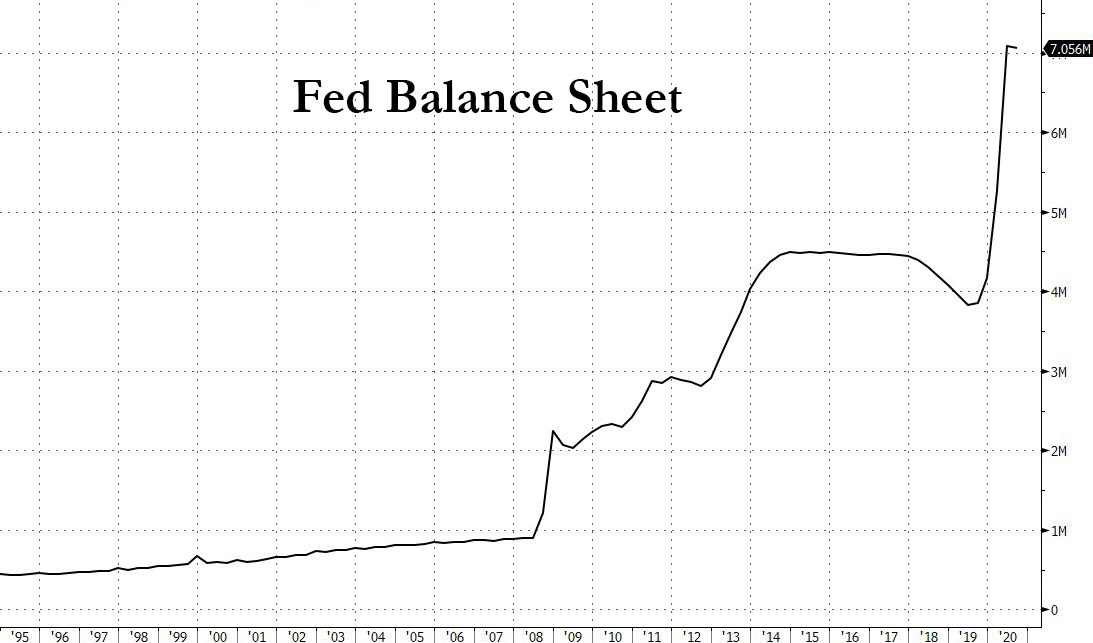
  4. It’s Still all about the Fed. We’ve been saying this for months, the primary driver of market prices is liquidity from the Fed. The election uncertainty and delayed outcome did not change that.
  5. Expect Stimulus Talks to Resume. With the election behind us (sort of), the market will likely focus on continued COVID-related stimulus packages, in addition to a multiple-trillion-dollar stimulus package in 2021 from whomever ultimately wins the presidency.

Bottom line, markets are reacting favorably to a balanced government, stimulus and continued Fed liquidity.

One interesting stat…this could be the first time in history that there is a Democratic president, a Democratic House, but a Republican Senate. The primary message from the US electorate: work together.

Market Analysis

Stocks surged today. That may change tomorrow, but the initial reaction to the election was very strong.  The leaders were large caps, technology, biotech and healthcare, and most were up over 4% today.  It is not just stocks that are strong…market strength is widespread across asset classes.  Stocks, bonds and commodities are all higher in response to the election.

Let’s take a quick look at a shorter-term chart of the S&P 500. The first chart below shows stock prices since October 19th.

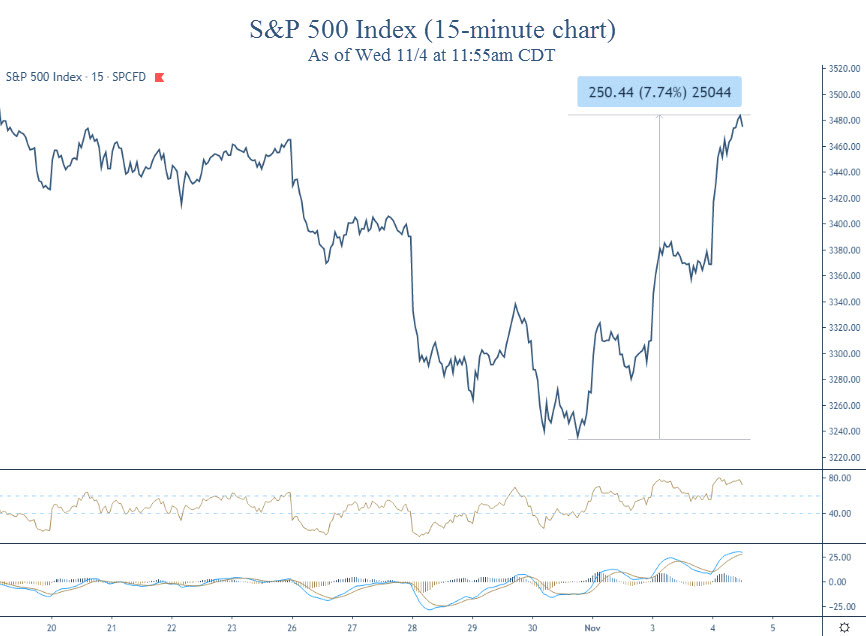
After a nearly 10% selloff during the second half of October, the S&P has surged almost 8% from recent lows. It is up over 2% today alone.

So much for that contested-election market crash.

Bigger picture, it appears that the market is continuing to consolidate after the massive surge off of the March lows.

The next chart is the daily chart of the S&P 500 this year. Since the September highs, stocks have been moving in a sideways and choppy manner. Today’s action looks like a continuation of that sideways move.

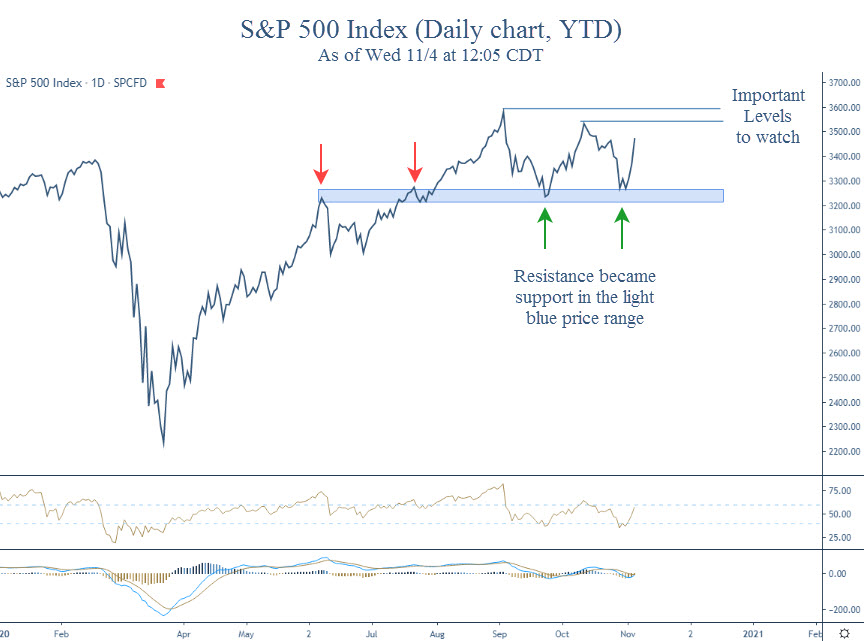
The market is clearly defining what it views as important price levels.

On the upside, if prices can exceed the two blue lines near the top of the chart (roughly 3500 and 3600), then prices could explode to the upside and enter what is called a “melt-up” phase. This could result in dramatically higher prices in a fairly short period of time.

On the downside, stocks have found support in the 3200 area (the blue shaded area in the chart above) multiple times over the past few months. If prices fell below this very important 3200 level, then probabilities rise dramatically that we will see further declines in prices. For now, that probability appears to be the lower likelihood outcome.

Until we see a decisive break out of this range in one direction or another, we should expect markets to be choppy, especially if there are any surprises from the vote counting process.

But the initial strong response by the markets is encouraging. We should expect continued Fed support of the markets, and discussion from the winning side about a multiple trillion dollar stimulus package following inauguration. We should also expect the COVID-related stimulus discussions to restart in Congress now that the election is done.

This is an excellent example of just how little impact these types of events usually have. This is not unusual. The data consistently tells us to pay more attention to what’s really happening under the surface of the market instead of the media-induced frenzy surrounding big events like elections.

Portfolio Positioning

As we have stated before in both this newsletter and during discussions with our clients individually, we do not make allocation and investment decisions based on events. Rather, we simply follow our predetermined process.

What actions have we taken for clients?

  • We have had increased cash exposure for clients since early September.
  • Last week, we had more sell signals get triggered, and entered election day with 25-30% cash, depending on our individual client’s pre-determined risk levels.
  • Today, we had a buy signal in our S&P 500 trend model. This moved 10-15% of portfolios from cash into the S&P 500 Index ETF this afternoon just before the market close.
  • Our signals are showing multiple areas of strength following the recent surge, and anticipate that we will likely get more buy signals in the coming days.

Overall, we have been pleased that our proprietary system has had us with higher than normal cash levels over the past couple of months, and it was reassuring to have extra cash in portfolios going into election day.

For now, our system is telling us that the probabilities favor higher markets over the coming months, but that could change quickly.

During times of volatility, there is the potential for what we call “whipsaws”. This occurs when a buy signal is followed by a sell signal in a fairly quick period of time. In any investment system that analyzes and follows trends, this is a potential risk. We have processes in place to help reduce the negative effects of these whipsaws, but they still happen nonetheless.

We hope this doesn’t happen, but if our signals tell us to be more defensive, we will adjust accordingly.

So expect to have increased activity in your accounts if markets continue to be volatile. The goal is to be positioned correctly for the market we have, not the market we hope to have.

For now, election day is over. The Fed remains supportive. We continue to have a balanced government. These issues are proving to be more important to markets than the actual results of the election or the potential contested nature of it.

All sides of the political spectrum can view yesterday’s results favorably. Democrats appear likely to win the presidency, but Republicans held many seats in the House and will likely have the majority in the Senate.

Maybe this is exactly what we all need. This has been a difficult year for many people, and let’s hope that we can move forward together.

Invest wisely.

Filed Under: Special Report Tagged With: biden, elections, gridlock, markets, presidential election, trump

Elections and Overconfidence

October 13, 2020

With less than a month to the election, we look at the dangers of overconfidence, analyze sector performance under tremendously different legislative environments, and discuss whether you should reduce risk prior to November 3rd.


“It ain’t what you don’t know that gets you into trouble. It’s what you know for sure that just ain’t so.”

-Mark Twain


Overconfidence

Mark Twain’s quote above seems appropriate for the weeks leading up to a Presidential election. It is about overconfidence.

The exact origin of this quote is not completely clear. It is credited to Twain, but many scholars have a hard time tracing it directly to him. Some give credit to one of his contemporaries, Josh Billings, who was a prominent political humorist in the late 1800’s.

Originally, Mr. Billings used it as a jab towards politicians. But over time, it has been used to criticize religion, the military, politics, environmental activists and finance.

This quote was included in the opening scene of an excellent film about investing called “The Big Short”. This movie was based on a book written by Michael Lewis. The main character is a hedge fund manager who bets big against the housing market leading up to the 2008 financial crisis.

The events in the movie are almost entirely true. The main character, who in both real life and the movie is named Michael Burry, was ridiculed for taking a stance that was extremely opposite of the consensus view that housing prices would never fall. By taking this position, he lost clients, lost employees, and almost lost his entire business.

When the financial crisis hit and home values across the country plummeted, he made hundreds of millions of dollars for himself and his clients. (We strongly recommend reading any of Michael Lewis’s books, particularly those about finance. They can be found on Amazon here.)

Both “The Big Short” and Mark Twain’s quote have one major theme…the danger of overconfidence.

An entire generation of financiers were convinced that housing prices would not fall. They were so confident in their belief that the bets they made brought down legendary companies like Bear Stearns and Lehman Brothers. Other companies who made the same bets and should have gone bankrupt are companies like Merrill Lynch, UBS, Wachovia, Countrywide, Fannie Mae, AIG, Washington Mutual, Lloyds and Royal Bank of Scotland. The overconfidence was amazingly broad and well accepted.

Presidential elections represent the apex of overconfidence in modern society.

Each election cycle, we ask presidential candidates to make bold predictions about how they will steer society to a better future. These days, it’s almost a job requirement to have unhealthy amounts of overconfidence. To run for the office, you must either have a massive ego or a very special calling. Usually both.

But presidential elections don’t only bring out overconfidence in the candidates. Investors, and the investment industry as a whole, are just as guilty of this on a very widespread scale.

With less than a month before the election, our inboxes have been bombarded with reports predicting the market outcomes under Trump versus Biden administrations.

All of these reports sound eloquent and well thought out.

But there is one important question…should we listen to any of them?

Previous Legislation by Industry

Nearly every conversation we have with clients and prospects right now includes a discussion about the election. Specifically, people are wondering if they should reduce risk before the election.

When considering an action like this (or any other action for that matter), you must first have a reliable understanding of how effective that implementation may be.

So let’s look at a few examples of major policy initiatives that were both campaigned on, and also legislated into action. And then look at the resulting performance that resulted from that policy action.

Most presidents have domestic policies that are very industry-specific.

President Obama and President Trump are polar opposites in many ways. Perhaps the most contrasting policy initiatives between Obama and Trump were in three main industries: healthcare, financials and energy.

The chart below shows just how different the two men were with regards to legislation that affects these industries.

President Obama passed major legislation that dramatically increased regulations on large financial institutions, energy companies and the entire healthcare industry.

In 2016, candidate Trump ran on an agenda of repealing each of these laws, and to a large extent was successful in removing large portions of them once he became president.

Surely these dramatically different policies would have a noticeable effect on the stock prices of each of these sectors.

Quite the contrary. Under President Obama, here is how these sectors performed annually during his administration:

  • Healthcare: 14.2%
  • Financials: 7.2%
  • Energy: 5.0%

Here are the performance of the same sectors under Trump:

  • Healthcare: 14.1%
  • Financials: 7.1%
  • Energy: -15.8%

Read that again.

Despite the huge differences in policy, the performance of healthcare and financials were practically identical. And energy did much WORSE under Trump than under Obama!

Policy differences sure didn’t lead to stock performance differences in these sectors.

If we look back to 2016, most investment firms were predicting that a Trump presidency would be very supportive for Financials and Energy. They literally couldn’t have been more wrong.

Let’s pick on JPMorgan, one of the more well-respected behemoths of the financial world.

The chart below shows their predictions from 2016 of which sectors would be hurt, and which would benefit under a Clinton versus a Trump presidency.

A green (+) in the column below each candidate represents which sectors they believe would benefit from that candidate becoming president. A red (-) represents which areas they believe that candidate’s policy will have a negative impact on the performance of that sector.

There is quite a bit of data on this chart, but the fine folks at JPMorgan essentially predicted that under a Trump presidency the best performing areas of the market would be Financials, Discretionary and Energy, while the Technology sector (IT in the chart above) would under-perform the broad market.

Just like people are doing in 2020, they laid out a very logical argument on why you should follow their highly intellectual musings and rely on their vast intelligence to guide your investment decisions.

You probably know where this is going.

Despite teams of “experts” in markets, politics, taxes, legislative processes, company fundamentals, and who knows how many other areas of expertise, they were flat out wrong.

Unfortunately, this doesn’t surprise us at all.

Maybe this is just industry-specific. Surely there were meaningful differences in stock performance of various sectors, and possibly the broad market as a whole under such different administrations.

The next chart, courtesy of LPL Financial, shows a more comprehensive sector performance under both Obama and Trump. The Trump data is shown through the end of September. The chart is organized in descending order by sector performance under Obama.

To continue picking on JPMorgan, let’s first look at the column under “Trump”.

Despite massive deregulation for Financial and Energy companies, they were the two worst performing sectors under Trump. Energy stock prices were hit especially hard, down nearly 16% per year. Most large investment firms predicted that energy stocks would be the single biggest beneficiaries of a Trump presidency.

To add insult to injury, Technology, which JPMorgan predicted would be the worst performer sector under Trump, ended up being the best performer BY FAR.

To be fair to JPMorgan, they were not alone in their poor efforts of prediction. Most large firms made very similar predictions, and all were made with a very high degree of confidence. Hopefully these firms didn’t use their overconfidence when implementing client portfolios, because their clients would have suffered dramatically if they followed their own advice. Or maybe they did shift client portfolios, which partially explains why we’re seeing consumer trust in financial institutions near all-time lows.

But if they didn’t shift client portfolios in that direction, why would they go to the effort of making these predictions in the first place???

To finish up with the chart above, it is incredibly interesting to us to see just how similarly the sectors performed under each president. The top two sectors were the same, the bottom two sectors were the same, and the rest were within a few percentage points of each other.

From an overall market standpoint, stock performance is very similar as well. The S&P averaged 12% per year under Obama and 14% per year under Trump.

This is real data.

Despite completely opposite legislation, and despite huge PR campaigns to rally support while the bills were being passed, there was very little difference in performance in nearly every sector.

So what explains the similarity?

It’s the Economy Fed Stupid

One of the more popular phrases during presidential elections was coined by James Carville, one of Bill Clinton’s primary advisors during his 1992 presidential campaign. He said, “It’s the Economy Stupid.”

He meant that how the economy is doing is the single biggest factor in whether an incumbent would win re-election.

Today, the single biggest factor in determining stock prices is simple…it’s the Fed.

We’ve written about this many times this year, and will write about it many times in the future. It continues to be the single most important theme for the markets.

The next chart below shows the Fed balance sheet since 1994. It is amazing just how much money has been printed this year in response to the COVID crisis. The values on the right side of this chart are in thousands. This means that the current Fed balance sheet is $7 million-thousand, or $7 Trillion for everyone on planet earth who is not an economist.

Stock prices have soared on the back of this massive injection of liquidity. Since the Fed started printing in late 2008, markets have relentlessly and consistently moved in tandem with the Fed’s actions.

And there is scheduled to be even more in the coming months, to the tune of nearly $4 Trillion of additional money printed.

This is what makes the market performance so eerily similar between Trump and Obama. The Fed began massive money-printing just before the start of Obama’s presidency. And they have continued until this very day.

Markets are responding to this liquidity by going up, despite what legislation has been passed.

The Fed is making company valuations irrelevant. They are making economic data irrelevant. They are making tax policy irrelevant. They are making geopolitics irrelevant.

And they are most likely making the presidential outcome this year irrelevant as well, at least as it pertains to the stock market.

Someday there will be massive consequences to these actions, but that day is most likely not today.

So What Should We Do?

Will the Fed’s massive support of the stock market help Trump get re-elected?

When the markets are higher in the 3 months leading up to the election, the incumbent president has won EVERY SINGLE TIME.

Will history repeat itself? Who knows. It is 2020 after all.

At this point, it doesn’t seem like that would be a very good bet. Biden has huge, double-digit leads in the polls. But continuing the theme of the danger of overconfidence, we would suggest that based on 2016, the Biden campaign and his supporters shouldn’t get too comfortable.

The final chart below shows the probability that Donald Trump will win during the days leading up to the election in both 2016 and 2020. This chart was derived from the betting odds via RealClearPolitics, and shows the likelihood of him winning versus the number of days left until the election.

At this same point in the election cycle, Trump had a 20% LOWER probability that he would win the election in 2016 than there is now. And the pattern is eerily similar.

So anyone confident that they know who will win the election is simply guessing, or more likely just trying to sway public opinion.

Should You Reduce Risk before the Election?

Let’s get back to the original question we keep receiving from clients, which we haven’t answered yet…”Should we reduce risk before the election?”

Bottom line, no. At least not as of the time of this newsletter.

And the other primary question…”Should we listen to the pre-election predictions?”

Once again, no. Don’t listen to the ivory tower academics at the large investment firms. They are most likely going to be wrong, despite spending lots of resources on trying to sound smart. And just like everyone else, if they were right, it’s as attributable to luck as anything else.

Our investment process raised cash for clients in early September, not because we were predicting volatility around the election, but simply because the market became volatile and we followed our predetermined process. As a result, most of our client accounts moved to roughly 25-30% cash.

The S&P 500 proceeded to declined 10% in September. Frankly, we thought that our system would likely keep us with increased cash exposure into or past the election. However, last week we had multiple buy signals. And despite the election drawing closer, our system had us increase stock exposure across the board, not decrease.

Now, the market is back to flirting with all-time highs. Despite the pending election, stocks are moving higher.

One thing is for certain…STAY NIMBLE.

Just because we invested in stocks last week doesn’t mean we will stay at our current investment exposures from now to beyond the election. A lot can happen, especially in this crazy year. We have our exits already mapped out in case volatility does return, so if our system tells us to move funds back to the sidelines, we will do it.

And if we do raise additional cash before the election, it does not mean that it will stay in cash long. We have predetermined buy signals to get our clients back in.

The anticipation of market volatility around the election is normal. It will happen this election, and will likely happen in every election for the rest of our lives.

The Lesson?

The main lesson is that you should create a process that is agnostic to anticipated risk.

The expectation of risk is greatly different than the realization of risk.

Adapting your portfolio when risk happens is key. When markets actually start to realize risk is when you should adapt, not when you think risk should happen.

Way too many investment managers fall victim to the same overconfidence that politicians and financiers make, and use their “experience” and “intuition” to make adjustments based on what is nothing more than guesses.

Don’t let it happen to you.

Most of our clients have heard us say this before. We don’t know what the market will do in the future. No one does.

And that’s okay.

Don’t try to guess when volatility will happen. Chances are that you will be wrong. And if your investment advisor is trying to guess when volatility will happen, they should stop also because chances are they will be wrong too.

By following a predetermined process, we don’t have to worry about the possible effects of the election on our clients’ portfolios. Our system will adapt to whatever the future may bring.

The best part of this process is that it allows us to have comfort in the fact that we don’t have all the answers right now. We don’t have to worry about whether we should worry about the election.

The most important thing to the market right now is not the president, but the Federal Reserve chairman. If that were to change, markets could undergo dramatic increases in volatility. But that appears to be very unlikely under either Biden or Trump.

Bottom line, the trend in the market is higher, and has been since the March lows. Valuations are stretched in many areas, but it simply doesn’t matter at this point. Don’t miss out because you think that the market should be volatile around the election. A pre-set plan will help greatly reduce the worry you may experience around big events like the election.

Then you can worry about more important things…like how a country of 330 million people can produce these candidates as our two primary options.

Invest wisely!


Our clients have unique and meaningful goals.

We help clients achieve those goals through forward-thinking portfolios, principled advice, a deep understanding of financial markets, and an innovative fee structure.

Contact us for a Consultation.

Neither the information provided nor any opinion expressed constitutes a solicitation for the purchase or sale of any security. The investments and investment strategies identified herein may not be suitable for all investors. The appropriateness of a particular investment will depend upon an investor’s individual circumstances and objectives. *The information contained herein has been obtained from sources that are believed to be reliable. However, IronBridge does not independently verify the accuracy of this information and makes no representations as to its accuracy or completeness.  Disclaimer This presentation is for informational purposes only. All opinions and estimates constitute our judgment as of the date of this communication and are subject to change without notice. > Neither the information provided nor any opinion expressed constitutes a solicitation for the purchase or sale of any security. The investments and investment strategies identified herein may not be suitable for all investors. The appropriateness of a particular investment will depend upon an investor’s individual circumstances and objectives. *The information contained herein has been obtained from sources that are believed to be reliable. However, IronBridge does not independently verify the accuracy of this information and makes no representations as to its accuracy or completeness.

Filed Under: IronBridge Insights Tagged With: biden, elections, investments, portfolio management, president, s&P 500, trump, volatility, wealth management

Footer

LET'S CONNECT

  • Email
  • Facebook
  • Instagram
  • LinkedIn
  • Twitter

AUSTIN LOCATION

6420 Bee Caves Rd, Suite 201

Austin, Texas 78746

DISCLOSURES

Form ADV  |  Privacy Policy  |  Website Disclosures

  • Home
  • Difference
  • Process
  • Services
  • Insights
  • Team
  • Clients
  • Form CRS
  • Contact Us

Copyright © 2017-Present by IronBridge Private Wealth, LLC. All rights reserved.