
Waiting for a correction in the stock market? It may have already happened.
If a cat sits on a hot stove, that cat won’t sit on a hot stove again. That cat won’t sit on a cold stove either. That cat just don’t like stoves.
mark twain
It’s hard to believe, but the COVID market crash ended 16 months ago.
It was truly a black swan event. Something that came out of nowhere and was unlike anything the global financial markets have seen in over 100 years.
One of the most common questions we receive is, “When is the next crash going to occur?”
This is a good question, and a very logical one. And one we think about quite often.
After all, we are seeing a rise in the Delta variant, many cities are re-instituting mask policies, and there is discussion of additional lock-downs. Sounds like February and March 2020, right?
On top of that, we have the random 1,000-point decline that happened on July 19th. Read our comments in our article “Are the Dog Days of Summer Over?“
So there are valid reasons to be expecting a sharp market decline.
But we have been receiving this question for well over a year now.
In the past year, there has been a great deal of hesitation to put cash to work in the stock market. Granted, some people were very quick to put cash to work, but most were very hesitant. And many remain so to this day.
Why?
To fully answer both the question “Why?”, and the question of whether we should expect another market crash soon, we need to understand the human behavior factors at play.
We’re All Cats That Sat on a Hot Stove
As humans, we don’t arrive at skepticism by accident.
In fact, being skeptical is an extremely valuable survival tool. Especially when we see conditions that were similar to past experiences that caused us pain or harm.
The are three basic components of skepticism:
- You perform an action.
- You experience pain.
- You learn to avoid the conditions that caused the pain.
It isn’t rocket science. In fact, we can probably just file this alongside the long list of other things we’ve said that won’t win us a Nobel prize.
In the quote that we referenced at the beginning of this report, Mark Twain presents the ultimate completion of this three-step cycle:
- A cat sits on a stove.
- The cat burns his you-know-what.
- The cat never sits on a stove again, regardless of whether it is hot or cold. Because every stove now looks like a hot stove to the cat.
Pretty simple, right?
Sort of.
Most problems in life arise when we forget to do Step 3: Learn from past experiences.
We have all experienced situations that may have caused us pain that we ended up right back in for no good reason.
Substance addiction, bad relationships, a bad job…there are all sorts of examples of people forgetting about Step 3.
Many times we’re cats who sit right back on top of that stove. And many times we are once again burned.
But what happens if learning from past experiences is the REASON we are harmed in the future?
What if we perform Step 3 beautifully, learn to avoid the situation that caused harm, only to then be harmed MORE by the fact that we avoided the situation that previously caused us pain?
This is what happens in financial markets.
When you lose money in the stock market, you have to go back on the same exact stove that burned you if you want to get back in.
This is where the complexity starts to set in.
In markets, you have to think about Step 3 differently.
The lesson learned cannot be one of complete avoidance.
You must have the cognitive ability to reshape HOW you learn lessons about what got you in trouble in the first place.
After losing money in a big market decline, most of us think that the lesson should be to NOT get back onto the market stove. After all, it looks pretty hot, right? Delta variant, super high valuations, a massive rally from last March and an out-of-control Fed all make us think the temperature on the stove is pretty darn hot.
But just because these things are happening doesn’t mean you should avoid it altogether.
Don’t Avoid the Stove, Just Start to Use a Thermometer
Instead of avoidance, you must begin to use tools that can assess both the current temperature of the stove (markets), as well as the direction and rate of temperature change of that stove.
It is a rational response to avoid the stock market after getting walloped by it. In fact, it is the exact response that would help you avoid that pain in the future.
Many investors go through a big decline and turn into real estate investors. Or private equity investors. And that’s okay.
Markets are not for everyone.
But don’t believe that getting burned on stove means that there is something inherently wrong with stoves.
There is an opportunity cost to avoiding the stove.
The public financial markets provide access to fantastic investment opportunities with a tremendously high degree of liquidity. The primary benefit of liquidity, or the ability to get out of your investment quickly at little to no cost, is that you don’t have to be right all the time. You can change your mind and you can easily get out of things that aren’t working.
You simply need to start using tools that allow you to assess the temperature of the market.
At Ironbridge, we use a wide variety of tools. We won’t get into the specifics, but we use momentum analysis, trend analysis, RSI, MACD, DeMark Signals, and many other data points that help direct our decision-making. We have then developed sets of rules that drive our actions.
The whole point is that it’s important to have some gauge of the temperature of that burner, and not not simply guess when we jump onto it.
So Is the Stove Hot or Cold Right Now?
Okay, enough of the long analogy about stoves. Let’s get to the market analysis.
Bottom line, while the S&P 500 has not seen a correction since last November, we have already seen a correction in many assets.
Let’s look at the following charts to show what we’re talking about:
- Russell 2000 (Small Caps)
- China Stocks
- Emerging Market Stocks
- Big Tech Names
- S&P 500 Sectors
- S&P 500 Index itself
Before we start, a brief note on stock corrections.
Corrections can take two forms. They can happen via TIME, or via PRICE.
A price correction is what we usually think of when we think about a market pullback. Stock prices were going up, then they fall anywhere from 5% to 30%. Then resume their move higher.
But markets can correct in TIME as well. This simply means that they go through an extended, multi-month period with little price movement up or down.
Both time and price corrections serve the same purpose: remove excesses from the markets and get the ratio of buyers and sellers more in balance.
Okay, on to the charts.
Russell 2000 (Small Caps)
First, let’s look at the Russell 2000. After a strong surge following the Presidential election, small caps have been little changed since February/March.
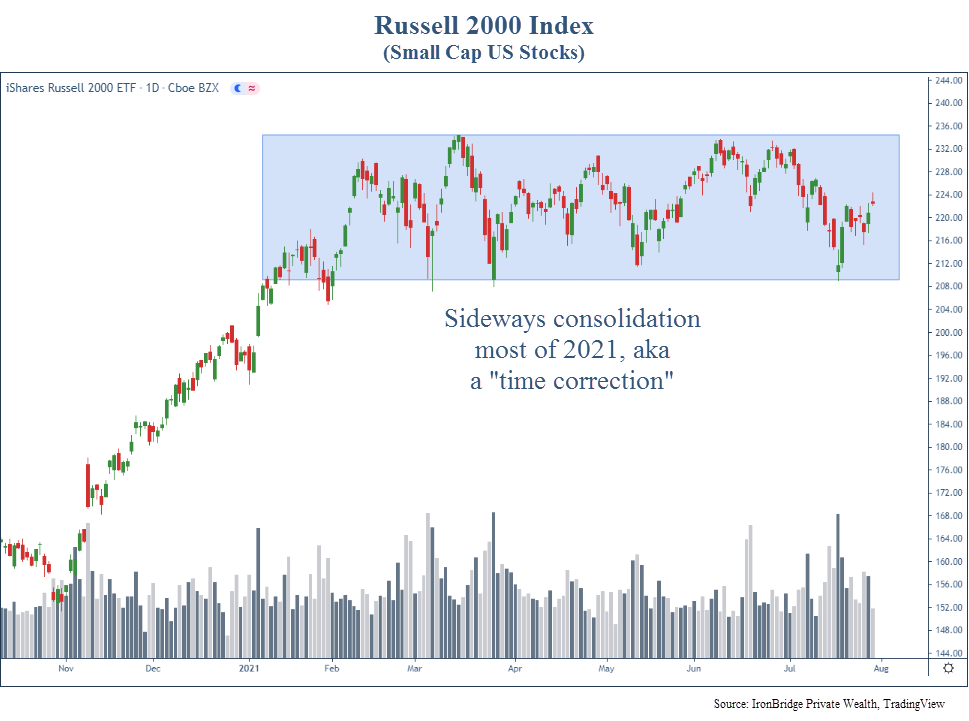
The blue box in the chart above is a classic correction in TIME. Small caps have been choppy with no direction for six months now. These patterns tend to resolve themselves higher, so we should expect that as the base case scenario.
However, a break below 208 in the chart above would be a more ominous signal. This could lead to selling pressure expanding across the market, and not just be isolated to small caps.
International Stocks
Next, let’s look at China and other international stocks.
The next chart is that of China Large Cap Stocks, using the ticker FXI.
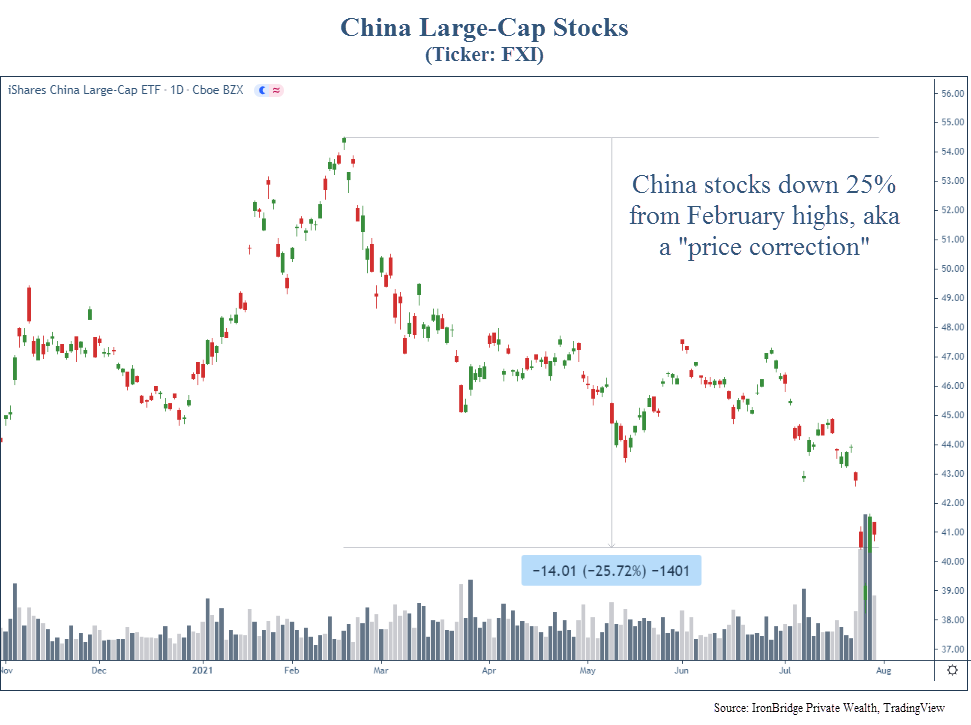
This is a classic correction in PRICE. Stocks are down 25% since February. There is little doubt the direction of this trend.
The same is true of other, more broad international stock indices.
Emerging market stocks are down over 15%, as shown in the next chart. This is no real surprise since China is the largest component. But it is another example of a major global equity market component that is experiencing a correction right now.
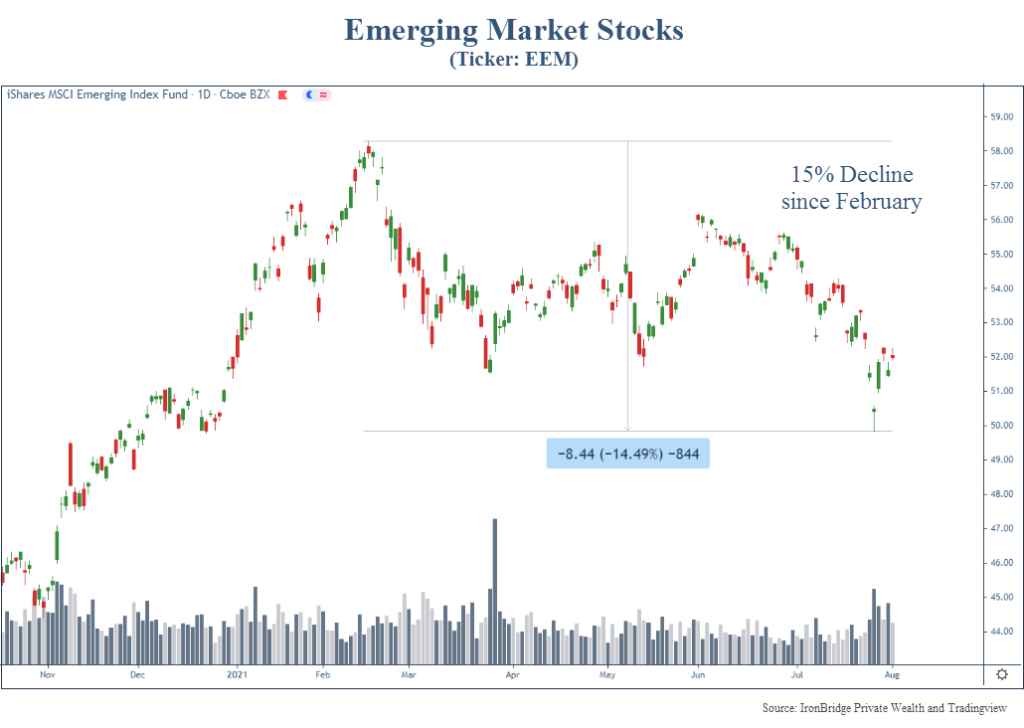
International stocks have been weak. There is no question about that.
U.S. Stocks
What about some of the major U.S. stocks?
Well, here is when we start to see what is really happening in U.S. stocks right now.
The next chart shows four of the largest U.S. stocks: Amazon, Apple, Microsoft and Netflix.
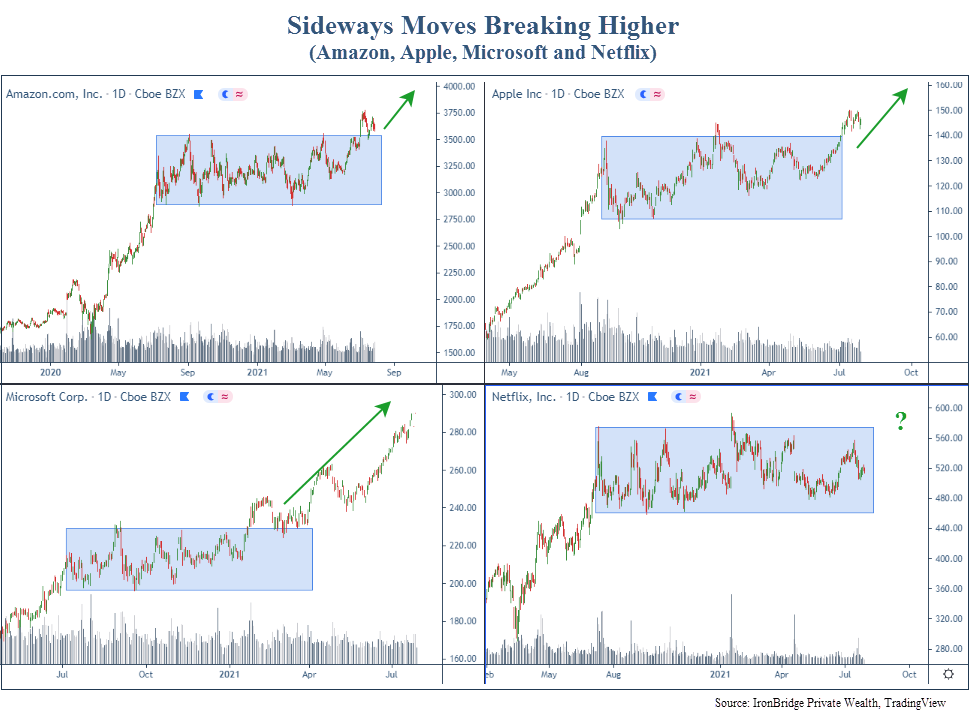
These charts show us that each of these stocks went through some sort of TIME correction in the past year.
- On the top left of the chart is Amazon (AMZN). It was in a sideways move for almost a year. It broke higher, but fell back into it’s chop zone last Friday after a 7% decline following earnings. This is called a “false breakout”. Meaning it may have longer to go before it breaks out of its sideways correction.
- Apple (AAPL), on the top right, shows a classic break higher from a sideways correction. It also spent over a year in a TIME correction before resolving higher.
- Microsoft (MSFT), on the bottom left, was in a TIME correction for the second half of last year. It has steadily been moving higher since the start of the year.
- Finally, Netflix (NFLX) is shown on the bottom right. This was a darling of the COVID period, and remains in a TIME correction since this time last year.
Each of these stocks experienced a correction. And these are major components of the S&P 500.
The fact that these stocks are breaking higher suggests we should have a bullish tilt to our thinking.
S&P 500 Sectors
Looking some of the sectors in the S&P 500, we see a similar picture.
The next chart looks at the Energy, Industrials, Tech, Financials and Consumer Discretionary sectors. We could have chosen more, but the chart gets way too busy.
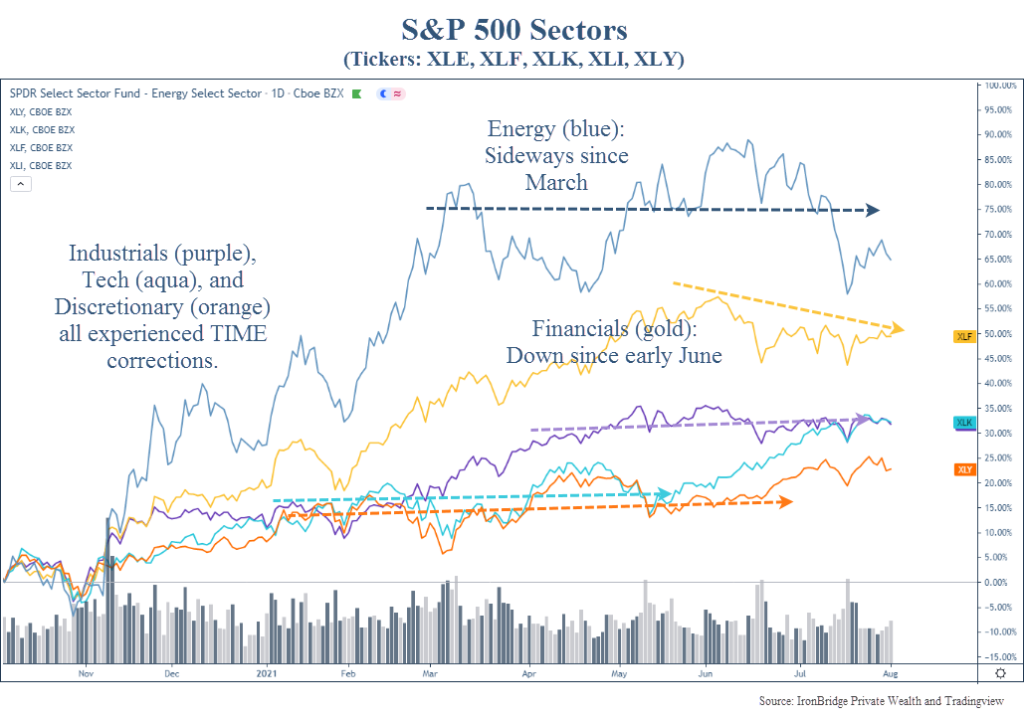
Each of these sectors have all seen some sort of correction in the past year. Most have been correcting in TIME.
Energy has been the biggest winner since the election. There is an excellent lesson here. The pundits on CNBC and elsewhere all predicted a Biden presidency would harm energy companies. That would make sense logically. But the market responded in exactly the opposite way. The lesson? Using the financial media for investment decisions is not a sound strategy.
This sideways movement of the major S&P sectors suggests that corrections are actually happening under the surface of the market.
But what about the overall market itself?
S&P 500 Index
But here’s the strange thing: Despite corrections happening in both the major stocks and major sectors within the index, the S&P 500 Index itself has been very strong.
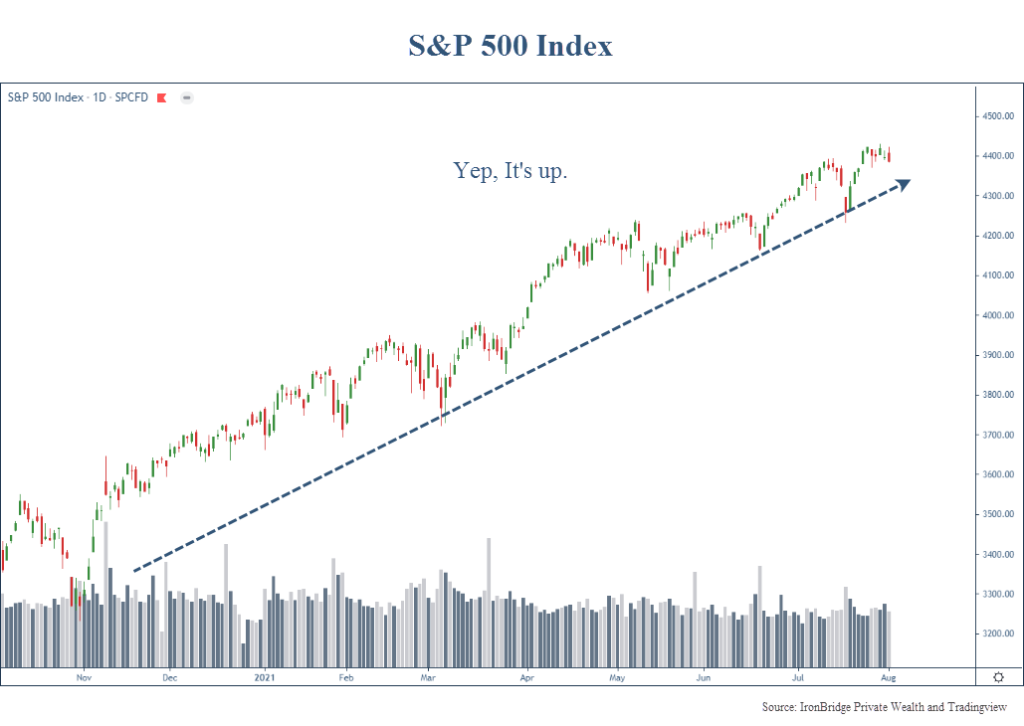
Despite the underlying TIME corrections happening in various sectors, and despite the obvious PRICE correction in international markets, the S&P 500 is up. In a very, boring, beautiful pattern higher.
So What Does All of This Mean?
It means that if you’re expecting a stock correction, it may have already happened.
As strange as this sounds, the underlying components in the markets have all mostly corrected already. Without an overall market correction.
Chalk this up as a win for indexers.
This is also why at IronBridge we have both active and passive strategies in place.
In fact, we have had the highest exposure to the S&P Index in our four-year history. We could only go about 5% higher in our portfolio weighting to the S&P 500 Index based on our rules. At the high point, clients had exposure of anywhere from 25-35% of their portfolios, depending on the risk level.
While the S&P has been boring, it’s more interesting to look at the small caps and international stocks.
Earlier this year, our clients had exposure to both of these areas. And both were stopped out at relatively small losses.
For small caps, that wasn’t such a big deal. Prices are similar to where they were when we exited.
But for international stocks, they are down 15-20% lower than where we exited.
Such is the nature of risk management.
We don’t know when things will reverse higher, chop sideways, or continue lower. Guess what, no one else does either.
But was has been interesting about this year is that there has been both volatility and no volatility at the same time. The stove is both hot and cold.
So it would be completely logical to expect the S&P to experience some sort of correction, either in PRICE or TIME.
But the underlying components suggest that we shouldn’t bank on it either.
There is a chance we have already seen the correction via the underlying components and the selloff in other areas.
If this is the case, the second half of this year should be strong. And will likely extend into next year.
If the S&P 500 does start to experience a correction, the likelihood is that it is relatively mild and most likely happens via a TIME correction.
In the meantime, look for opportunities to put cash to work, and stick with a disciplined risk management process.
Invest wisely!
