Portfolio Insights
The Now What Moment
“The ultimate measure of a man is not where he stands in moments of comfort and convenience, but where he stands at times of challenge and controversy”
-Martin Luther King, Jr.
 Is it just us, or does mid-December feel like a really long time ago? If you were on an island getaway, or spending time in some beautiful Italian villa the week before and after Christmas, boy did you miss some excitement. (And please send us a postcard). On Christmas Eve, the US stock market was down over 16% in December alone, and down over 20% from the highs of the year.
Not to be outdone, the bulls stepped up with a ferocious 1000+ point rally on the Dow the day after Christmas that has continued into early January. This rally helped limit some of the damage, and make 2018 look not nearly as bad as it otherwise could have.
The schizophrenic last two weeks of the year were a fitting way to end 2018. In our first Insights issue of last year, titled “The Slumber Issue” (read it HERE), we discussed how we thought investors were “asleep at the wheel”, having been lulled into a false sense of complacency caused by both 2017’s record low volatility and 9 years of a very strong market.
But that complacency quickly turned to anxiety in the spring…which turned back into complacency during the summer…and back to heightened anxiety in the fall. (Oh, the market, you evil temptress.)
So when the ball dropped on New Year’s Eve, just how bad was 2018? Frankly, not nearly as bad as it could have been. 2018 was, however, the first time ever the market finished negatively after posting positive gains through the first 3 quarters of the year.
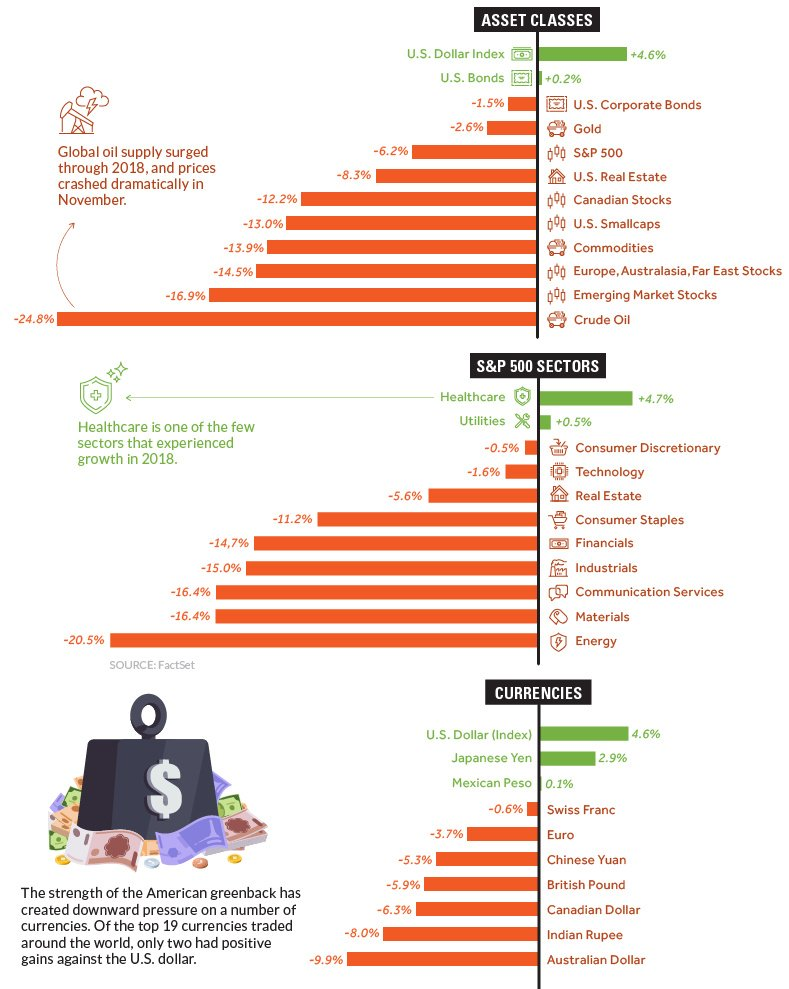
As shown in the chart below, courtesy of Visual Capitalist, 2018 was not just a bad year for US stocks. Almost every asset class across the globe finished negative for the year. Equity, Fixed Income and Alternative investments all posted negative returns. And the only reason we say “almost” is that US Treasury bonds eked out a measly 0.2% total return for the year, despite ripping 5% higher during the last two months.
Fast forward to today…even with the shocking declines in December and Q4, it does not appear to us that investors have shaken their complacency. One group whose confidence definitely has not been shaken are Wall Street strategists. As we discuss in the Market Microscope section below, their moderately optimistic forecasts in 2018 have been updated with enormously optimistic forecasts for 2019.
We do not publish year-end forecasts. It’s not because we are a smaller firm and don’t have the research staff to do so, and it’s not because we can look at the larger firms for guidance. No, it is simply because we don’t like BS. Markets are simply too complex to predict a year in the future with any consistency.
There’s a reason weather apps only show a 10 day forecast. The national weather service has difficulty predicting the weather in two weeks, and weather is based on physics. How on earth would the dynamics of millions of humans with different backgrounds, cultures, incentives, fears, greed, and every other emotion possibly be put into a calculator?
That said, we do strongly believe that if you listen to the market, it will reveal insightful knowledge on which parts of the market are being sought after by other, much larger market participants than us. That provides clues on when and where to invest to best be positioned so that the probabilities of success are skewed in your favor.
So as we look toward the future, what do we now expect from the markets? We think right now is the “Now What” moment for 2019. We have gotten a good bounce that has the important high yield debt markets (discussed in prior issues) participating. This is all good news as breadth and the plethora of other oversold signals that accompanied December are also working themselves out. However, if we look at the chart below, price really has only worked its way back to a very important zone – the level prices tested back during the February and April 2018 selloff with the October and November support levels also just above. So, we think the market has only worked its way back to its mean reversion, a very typical expectation in a bear market. Now is where the proverbial “rubber hits the road”; the “Now What” moment for the market.
Otherwise known as resistance, these price zones are levels we are watching for sellers to now re-enter the market.
The theory behind resistance levels (and support levels for that matter) goes like this: a typical investor may have bought stocks in the latter half of 2017 or January 2018, only to see them give back all of their gains and maybe even lose some ground. The investor may justify that the fundamentals all look good still and they haven’t really held the stock long enough to give the investment time to perform. “Let’s add some more here at cheaper prices”, they think. So the investor buys some more during the 1Q 2018 pullback. They watch as prices rise, proving how genius they are and feel good as the market makes new highs in 2018.
Then the 4Q happens and stocks pullback in October to just breakeven with 2017 levels again. And, again they justify holding and maybe they even buy some more. Stocks bounce a little, but, in December their investment rapidly falls over 10% and they have had enough. They vow to get out as soon as they get back to breakeven. The market is giving them that opportunity right now with the recent bounce as the average buyer throughout 2017 and 2018 is watching their investment now get back near break even. Will they all sell or continue to hold, hoping for a resumption of the bull market?
The implications of successfully overcoming this resistance area is quite large in our opinion. If price can exceed the two green boxes shown in the chart, then asset managers across the globe, will likely aggressively begin adding exposure to portfolios, it will trigger buy signals for many algorithms that trade on momentum signals, and will generally add to the feeling that maybe the worst is behind us for a while. It opens the door a lot wider for the bull market to resume, and potentially lead to an excellent year for performance and returns.
Conversely, markets moving lower from this general price range could easily signal that investors who were previously “trapped” by poorly timed buys in the fall have found their opportunity to exit at not that much of a decline. We believe remaining nimble, shortening your expected holding time for any investment, and being vigilant in managing risks will lead to a successful 2019, regardless of what the markets may have in store.
Time will certainly tell!
Market Microscope
Projections amid Conflicts of Interest
“The superior man understands what is right; The inferior man understands what will sell”
-Confucius, philosopher
There is a great book by Ned Davis (of Ned Davis Research) entitled ‘Being Right or Making Money’. At first glance you may look at that title and assume there is a typo. “We don’t mean or, we mean and. You have to be right in order to make money” are some thoughts that may be circling in one’s brain, but that’s the power behind the statement. You see, the two are not dependent on one another. In fact you don’t have to be right to make money. And, nobody knows this better than Wall Street Strategists.
It’s this time of year when the strategists all publish their year end stock market targets. What do we think they are trying to accomplish by publishing these forecasts?
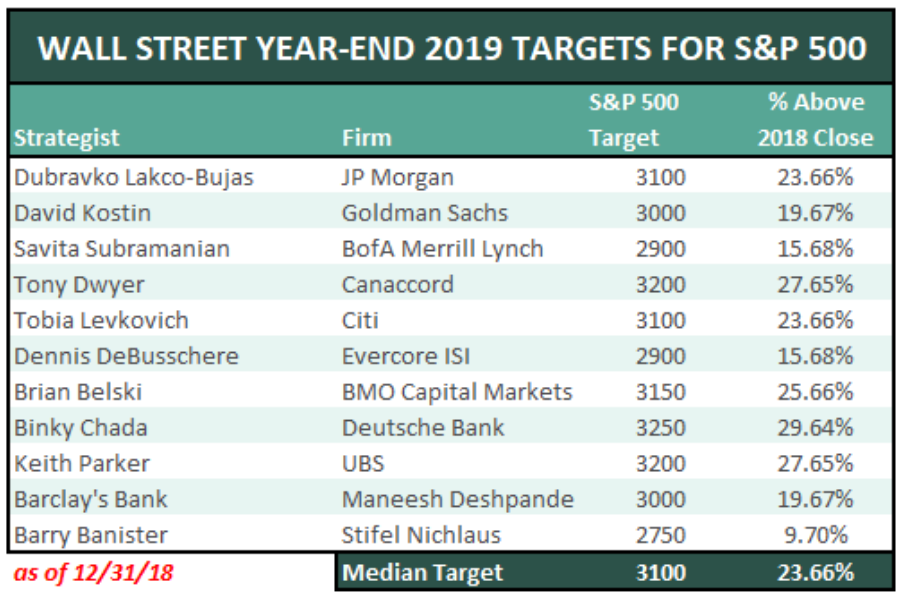
Do we think they are more interested in being right? Or are they more interested in making money? Look at the table below of 2019’s recently minted estimates.
What’s the takeaway here? With a median expected return of 24% in 2019, one would be dumb not to plow 100% into equities, right, because all the “experts” are uber-bullish? And, that is exactly what they want you to do. Why? Because that’s how they make money, of course.
Every single one of these firms makes money either on transaction fees, expense ratios, equity flows, or any of their other means that are tied to the popularity of the stock market.
If you were to take their advice and put all your money into the stock market and you make 24% in 2019, that’s great, you will be right, they will be right, you will make money, and they will make money.
But what if the strategists are wrong? Who is taking the risk of that possibility? What if the market actually falls for the year (like it did in 2018 – more on that below)? The strategists would be wrong, you would be wrong, but they would still make money while you lost money.
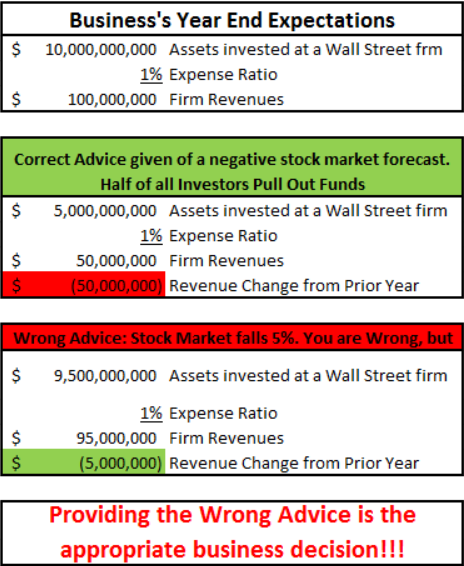
Below is a Game Theory analysis of this decision between the banks and the investor.
At the top we see that the businesses make money no matter the outcome as they collect their fees regardless if they are right or wrong.
Granted, in a down market, their fee would be compressed a little as their assets shrink in size (management fees are typically a percentage of assets), but that outcome still makes them plenty of money and is way better than if investors pulled all their assets from management and moved them into cash or other, safer, and cheaper options (which they presumably would do in the event there was a consensus negative market projection).
The series of tables below puts some math behind these outcomes.
In the first scenario, the strategist is correct and predicts that the stock market will fall in 2019. However, that is a disaster for the firm. In the event a strategist actually had the guts to suggest a down market, it is highly likely existing investors would pull their money from the stock market and park it in a safer environment.
There is very little incentive in making this call as the firm makes money in either scenario, and the potential loss from clients pulling their money out is way higher than the potential for the them to gain new clients by making the correct call. It just isn’t worth the risk, so they make perpetually bullish calls. All of them do as we see in the first chart.
This is the same reason you will rarely see a “sell” designation by an analyst. The farthest they will go is a “hold” or “market-weight”. There’s just no upside to making such a call. Nobody will buy the stock if it’s rated a sell, and thus nobody at the firm will make any money, therefore there is no incentive to ever rate anything a sell.
Even worse, that firm that was given the sell rating will probably never do business with the bank that gave them the sell rating, as it likely ruins any potential relationship.
Would you rather take your company public with a firm that has a bunch of buy ratings on all the stocks in your industry and thus likely to offer a buy rating on your stock and suggest a high stock price, or would you rather use the firm that gives a potentially more honest designation of a “hold” or even a “sell”, with a lower price target, potentially costing the CEO and all the insiders millions of dollars in personal wealth? Hmmm, this one’s a toughy. There just aren’t any sell designations on Wall Street, because there are no monetary incentives to provide them.
This is also why many advisors and money managers suggest “staying the course” and riding things out as they are often dis-incentivized to move assets out of equity funds and into typically cheaper, safer options. Those commissions and trails are often much larger for equity funds than they are for money markets and CDs. Who would have thought conflicts of interest exist on Wall Street!
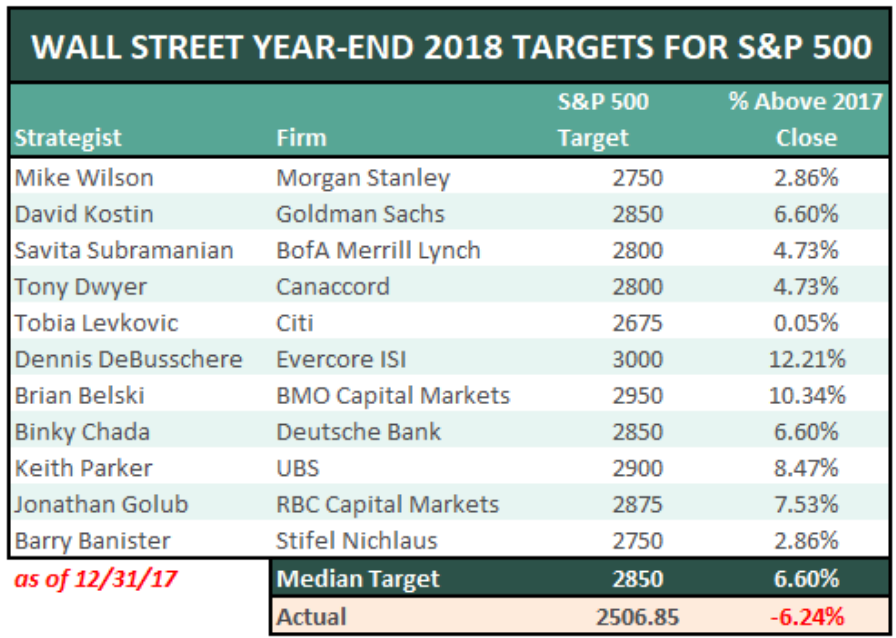
There’s no better example of this than last year. The next chart looks at Wall Street analysts predictions for LAST year, 2018. They got it very wrong as they were over 12% off in their 2018 projections!!!
That is a massive miss, yet here we are again with these same strategists trying to “make the right call” again.
We don’t know how many investment strategy reports we will read this year that will point to these targets as being reasons for being bullish, but it definitely will be a plethora of them.
Also no big surprise, not one Wall Street firm projected a negative year for the S&P in 2018. They never will, and if they miraculously did, it would never be more than just a few percent lower as the game theory math we looked at earlier shows us why. They could never predict a decline that would cause more funds to exodus than the amount of asset depreciation as a result of a decline in the market.
A 5% market decline lowers assets by 5%, but calling for a market decline of 5% would probably lose all these firms more than 5% of assets as a mass exodus by investors could occur.
We don’t even play this game. We prefer instead to listen to the market and participate when it’s being amicable and not participate when it’s throwing its tantrums. As a 100% fiduciary and independent firm, we are not beholden to our strategists “year end targets”. We also can put clients first and with our fee structure have zero difference in incentive between stocks, bonds, cash, real estate, or other investments.
A major part of making successful investment decisions is to just get out of the way of all the incentives. If you align your incentives with your clients then you can avoid these conflicts of interest, stop worrying about being right or wrong, and beat the big banks at their own game.
The interesting thing about this year is strategists are really sticking their necks out. They were wrong by 12% last year, and this year they are projecting an average 24% gain. This seems like a mistake.
Furthermore, there is a fairly wide dispersion among them.
In 2018 the widest spread in year end projections was 12%. This year the spread is 20%. Continuing with our game theory analysis, we understand why all the projections are positive. That’s the easy analysis now.
But why would they project 20-30% upside from here? What’s the benefit in going so big? That seems like a massive gamble with little positive payout. We are perplexed and would love to hear your thoughts why they would make such large projections.
Maybe they truly believe they can project the price of the markets in a year, but then they would be putting “being right” ahead of “making money”. What if the market only returns the trailing 20 year average return of 6%? Every single strategist would be wrong once again for the umpteenth year in a row, and massively wrong.
Perhaps they know they are really just competing with each other for bragging rights, but again, there’s real money at risk here, not just ego. If there ever was a year to stick your neck out and go for broke, perhaps this is the year to do it. If one strategist goes out on a limb and guesses a flat or even negative market in 2019, they would be over 24% away from the average pick and more than 10% away from the lowest estimate. They would be “the one strategist who got it right”, and could potentially come out ahead.
The stock market has negative returns 25% of the time with 24 down years in the S&P since 1926. 2018 was a down year and in year’s that follow down years, there is no real variance from average returns.
Some 2nd years kept going down (2002, 1931) while some 2nd years rebounded (2009, 1991).
So, from a purely statistical and historical perspective it seems to make more sense for these strategists to predict a high single digit return for 2019 (which none of them are doing) rather than the massive gain they are prognosticating. One thing we know is Wall Street is making decisions around money, so there must be a reason for such lofty S&P projections from the strategists. Do they really need such lofty projections to entice investors back into the market?
These projections have little meaning to us, since we believe they are all made up anyways in order to try to take from our coffers and fill theirs. One thing we do know is they will not be successful at that.
Invest Wisely.
Our clients have unique and meaningful goals.
We help clients achieve those goals through forward-thinking portfolios, principled advice, a deep understanding of financial markets, and an innovative fee structure.
Contact us for a Consultation.
Neither the information provided nor any opinion expressed constitutes a solicitation for the purchase or sale of any security. The investments and investment strategies identified herein may not be suitable for all investors. The appropriateness of a particular investment will depend upon an investor’s individual circumstances and objectives. *The information contained herein has been obtained from sources that are believed to be reliable. However, IronBridge does not independently verify the accuracy of this information and makes no representations as to its accuracy or completeness. Disclaimer This presentation is for informational purposes only. All opinions and estimates constitute our judgment as of the date of this communication and are subject to change without notice. > Neither the information provided nor any opinion expressed constitutes a solicitation for the purchase or sale of any security. The investments and investment strategies identified herein may not be suitable for all investors. The appropriateness of a particular investment will depend upon an investor’s individual circumstances and objectives. *The information contained herein has been obtained from sources that are believed to be reliable. However, IronBridge does not independently verify the accuracy of this information and makes no representations as to its accuracy or completeness.


