There is an old saying that the stock market has predicted 10 of the last 7 recessions. (Meaning stocks are more volatile than actual economic data.) But what happens when it’s the economic data that is showing weakness, while the markets continue to show strength? This is the situation today.
So who will win the battle between weak economic data and a strong stock market?
“I deal in facts, not forecasting the future. That’s crystal ball stuff. That doesn’t work.”
-Peter Lynch, Investor
Update: What Will the Fed do Next?
A few weeks ago in this publication we focused on the Federal Reserve’s recent, and controversial, decision to cut interest rates by “just” 25 basis points. To us the 25 basis point cut was no surprise as we concluded:
“The Fed simply follows the rate that the market sets. Period.”
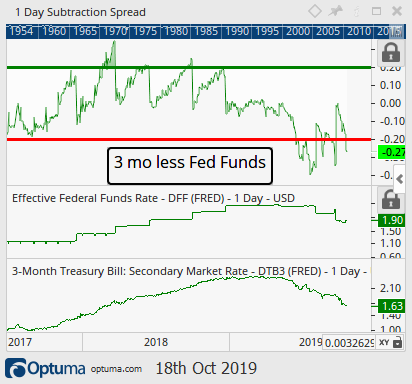
The Fed is meeting next week. Let’s take a look once again into our crystal ball, the ole’ 3 month Treasury Bill, to see what the Fed is likely to do.
We feel pretty comfortable stating that the Fed will most likely cut another 25 basis points. The updated chart below shows the Fed Funds Rate is now 27 basis points behind the 3 month Treasury (as of 10-22-19), leaving them enough space to satisfy the market with another rate cut.
Note: In the chart below, if the green line is below the red line, we expect a cut. If it is above the red line, we expect rates to remain unchanged.
If the discrepancy between the Fed funds and the 3 month continues to widen then it would open up room for them to cut a full 50 basis points, but at this point, the odds are of another 25 basis point cut when the Reserve Board meets October 29 and 30.
 Weak Economic Data vs Strong Markets
Markets are complex. A cornerstone of our investment philosophy is that they are so complex, in fact, that predicting them is almost impossible. Success at predicting is more a function of the probability of getting a guess right.
But understanding the overall environment at least lets investors factor in the broader conditions that exist in markets.
Single data points don’t tell you much about an investing environment. But when big themes start to emerge, we’d better pay attention. This is happening right now in economies globally. But it is happening with the backdrop of a stock market less than 1% from its all-time-high.
The first real big economic red flag that has occurred in 2019 has been the numerous inversions of the yield curve.
Discussed in the Sept 11 ‘insights’ (found here), this ominous sign has never previously occurred without a recession following at some point in the future.
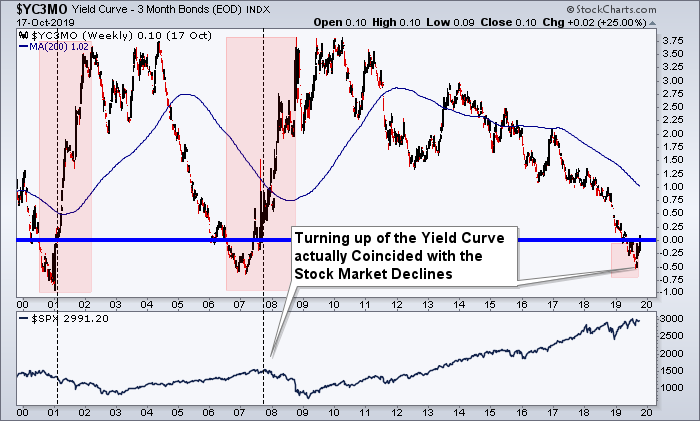
But, as we discussed back in our March 29 publication (found here), the key to forecasting a recession is not necessarily when the inversion occurs, but instead when the curve starts to steepen after an inversion.
The chart below is an update of the yield curve spread between the 10 year treasury Bond and 3 month Treasury Bill. It indeed shows, after a brief stint in negative territory, the yield curve is now no longer inverted. The 10 year yield is now 10 basis points above the 3 month yield. It was when this inversion ended that the real fireworks began during the last two recessions. So unless this time is different (famous last words), then indeed we should be on high alert of a recession within the next 6-12 months, especially if the curve continues to steepen.
One caveat is we have never witnessed an inversion in the United States with interest rates so extremely low, so maybe that puts this inversion in its own category.
Nonetheless, this chart suggests that caution is warranted, and we need to be on close watch for a market and economic turn lower.
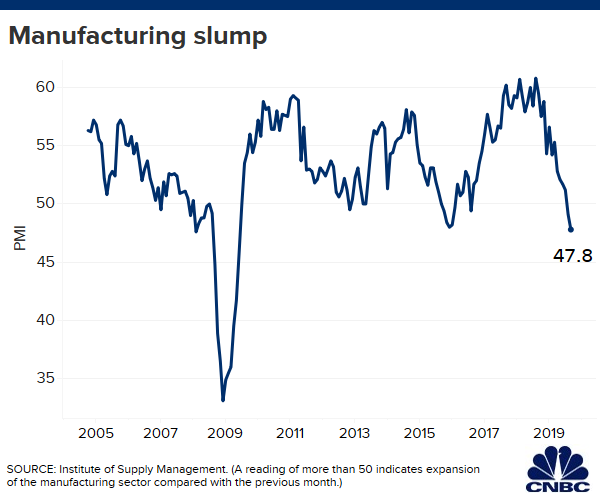
In addition to the yield curve inversion, more recently some dismal ISM Manufacturing numbers were printed, with that index now at its lowest level since the financial crisis and below the 50 level for only the 4th time in 10 years.
For reference, “ISM” stands for the Institute for Supply Management. This organization has been around since 1915, and conducts a survey of more than 300 firms in the attempt to measure changes in production levels from month-to-month. They conduct surveys on both manufacturing data and on services data. Companies that sell “stuff” to people are included in the manufacturing index, and companies that provide services such as technology or healthcare are included in the ISM Services index.
The chart below of most recent ISM Manufacturing survey shows that respondents are currently the most negative they have been since 2008. A move below 50 is correlated with manufacturing contraction.
This chart also suggests caution.
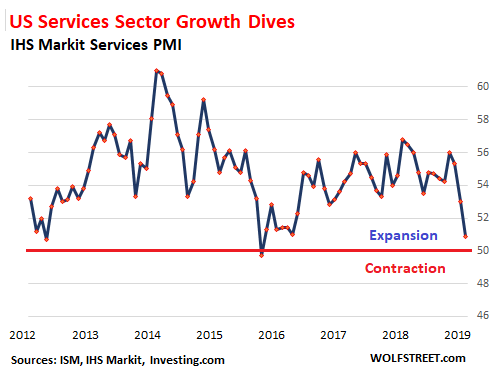
A few days later a disappointing ISM Services number followed, just above the 50 level on the Purchasing Managers Index for the services segment of the economy and the 3rd lowest reading since the financial crisis.
Again, it’s hard not to look at these economic indicators and not feel negative about where the economy is heading.
It’s not that the U.S. is the only bad apple of the bunch. In fact the U.S. was the lone good apple in what seemed a bad international bunch, for years, that is until now.
The below report shows industrial production has slowed across the globe as the U.S. (blue line) is now showing year over year industrial production slowing as well.
So not only are things weakening in the U.S. but they now join the rest of the world in a potential economic contraction.
But, here is the issue we have with all of this economic deterioration.
If things are looking so poor economically right now, why haven’t the stock markets priced things in and headed lower?
That’s what conventional wisdom suggests should occur, and to us, that is the most important thing to look at. Why hasn’t the stock market “led” all these economic indicators by falling too? After all the stock market is the top leading economic indicator.
One of the most dangerous words in finance is “why”. Why can get us in a lot of trouble. Why doesn’t my dog listen to me? Why did my three year old just start screaming as loud as he can for apparently no reason? Why is the sky blue (well maybe we finally figured out this one)?
Our suggestion, spend less time pondering the whys of this world, especially when it comes to investments, and focus instead on the what is.
Here’s one example as to why trying to fit “why” into the market’s narrative is a dangerous game.
- Friend 1, “Why is the Fed cutting rates again?”
- Friend 2, “Because the economy is slowing again”
- Friend 1, “Why is the Economy slowing again?”
- Friend 2, “Because the velocity of money is slowing”
- Friend 1, “Why is the velocity of money slowing?”
- Friend 2, “Because borrowing from banks has slowed”
- Friend 1, “Why has borrowing slowed?”
- Friend 2, “Because spending and hiring is slowing”
- Friend 1, “Why is the stock market still up then?”
- Friend 2, “I don’t know, let’s short it”
So should we just go short here because the economy is falling apart? This same conversation could have easily been had in August 2019 when the S&P 500 was 5% lower than it is today, just as it can just as easily occur right now, in October 2019, around 1% from new all time highs. It also could have easily been had after the last rate cut of the last rate cutting cycle, Dec 16, 2008, when virtually all economic indicators were looking poor during the depths of the financial crisis but also happened to occur near the market’s generational lows in price.
The point is: deteriorating economics can and have occurred throughout history, but that doesn’t mean the stock market has to or will fall.
We think it’s more important not to ponder the “why” this is occurring, but instead accept the reality of the situation as what is and then go from there.
That reality is the stock market is not pricing in a recession, not yet anyways, and we must respect that and forget the whys or why nots. Does the fact the yield curve has inverted and the ISM Manufacturing and Service indicators are falling actually lose you money? Again, let’s focus on the facts that actually matter to you and your account. The whys and why nots just do not matter, but the price of the stock market does matter.
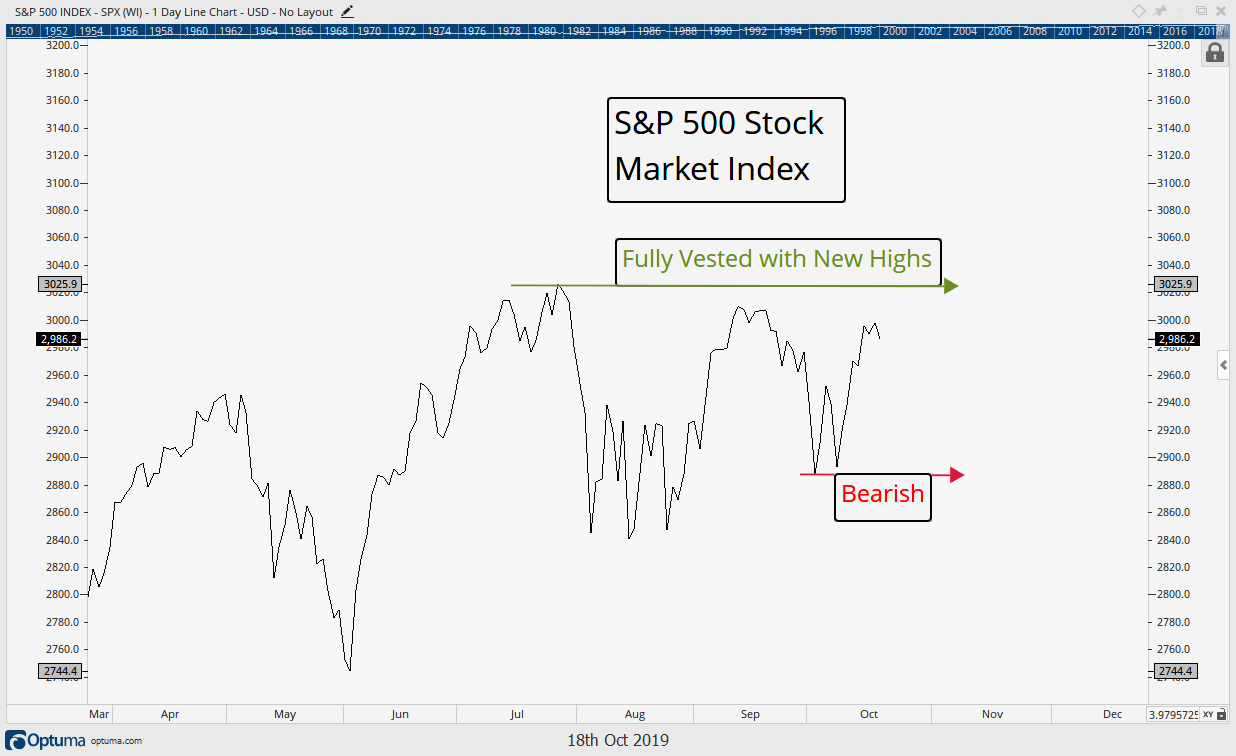
The stock market thus far has not fallen on this bad economic news, and that matters most. Price-wise it remains range bound, still below July’s all time highs and above August’s six-month lows, as it has largely been range-bound since April 2019 now trying, once again, to bust through its upper resistance.
Our updated key price levels are highlighted above. These are the levels we are watching to get 1) either fully allocated yet again or 2) scale back our holdings.
We followed our own advice and did indeed add to exposures recently when the market broke out of its August range, but we still also have some cash on the sidelines through our Tactical Strategy as we wait for prices to overcome overhead resistance (new highs) and offer us better reward to risk ratios (a concept we discussed in more detail in the second half of our last ‘Insights’, The Fed’s Secret Indicator).
In the meantime the market has continued the chop it has been in since April as we wait patiently for its outcome.
Invest Wisely!
Our clients have unique and meaningful goals.
We help clients achieve those goals through forward-thinking portfolios, principled advice, a deep understanding of financial markets, and an innovative fee structure.
Contact us for a Consultation.
Neither the information provided nor any opinion expressed constitutes a solicitation for the purchase or sale of any security. The investments and investment strategies identified herein may not be suitable for all investors. The appropriateness of a particular investment will depend upon an investor’s individual circumstances and objectives. *The information contained herein has been obtained from sources that are believed to be reliable. However, IronBridge does not independently verify the accuracy of this information and makes no representations as to its accuracy or completeness. Disclaimer This presentation is for informational purposes only. All opinions and estimates constitute our judgment as of the date of this communication and are subject to change without notice. > Neither the information provided nor any opinion expressed constitutes a solicitation for the purchase or sale of any security. The investments and investment strategies identified herein may not be suitable for all investors. The appropriateness of a particular investment will depend upon an investor’s individual circumstances and objectives. *The information contained herein has been obtained from sources that are believed to be reliable. However, IronBridge does not independently verify the accuracy of this information and makes no representations as to its accuracy or completeness.

