Confirmation bias is one of the most prevalent mistakes investors make in the market. They are bullish or bearish, likely for the wrong reasons. In reality a better approach is to not be bullish nor bearish, which will allow for a more well rounded investment analysis and decision making. We provide compelling reasons to be both bullish and bearish, helping show just how futile such a stance in the market is.
[maxbutton id=”5″ url=”https://ironbridge360.com/wp-content/uploads/2018/09/IronBridge-Insights-2018-09-27-What-do-you-See.pdf” text=”View PDF” ]
FIT Model Update: Late Cycle Bull Market
The Fed raised rates once again to between 2.0% and 2.25% on Wednesday, Sept 26. These rate rises should trickle into shorter term investments such as checking, savings, and CD accounts over the coming weeks, offering further reason to look at cash and cash alternatives as viable short term holdings, especially during times of market stress. With the rate increase, the yield curve is on the verge of inverting, something that has preceded every single recession of modern time.
Portfolio Insights
What do you See?
“Your worst enemy cannot harm you as much as your own unguarded thoughts.” – Buddha
The Mind Hears what it Wants to Hear
Have you seen the picture below before? Is it a picture of a young woman or of an old lady? When we first looked at it, we initially saw a picture of a young woman with her head turned away. However, after coming back to it a second time, the jawline of the young woman became the nose of an older lady with her head tilted slightly down. The mind (and this picture’s artist) are incredible things, aren’t they?
However, the mind can also get us into trouble, especially when investing. We operate with biases on a daily basis. The question is, “What do we do about these biases?” Before we can solve a problem, we must identify it, so let’s identify some biases.
Fast Company magazine helps us call out five biases that we may be guilty of on any given day. More importantly, by recognizing when these biases are occurring, it can help us make better decisions in the markets, in business, and in life in general. Here’s the list of their top five biases (in no particular order) we can be guilty of:
- Confirmation Bias – Seeking only evidence that supports a belief or expectation. Example: This occurs every two years during the Congressional and Presidential elections. It also occurs in the stock market, which we will dive into in the Market Microscope section next.
- Availability Bias – Relying on information that is readily available more so than harder to find information. Example: The media likes to talk up a lot of different topics, therefore our minds are more likely to remember those topics, and try to make decisions based on them alone.
- Anchoring Bias – Utilizing a reference point that may be far from the actual value. Example: Being provided a low estimate for a project may make all other estimates look ridiculous, when in fact they are reasonable.
- Overconfidence Bias – People who have had success, tend to think it will continue, which can lead to bad decisions. Example: A hedge fund manager who has been correct in the past, and lets his ego prevent him from admitting mistakes and changing course.
- Rush to Solve – Being in a hurry and not utilizing all available information to make a decision. Example: Deadlines are a major reason people may fall victim to the rush to solve bias.
We encounter a lot of these biases on a regular basis, but confirmation bias is the one that we encounter in the markets every day. Are you a bull or a bear? What reasons do you use to justify your position? Both consciously and subconsciously we humans seek out data to confirm our preconceived notions about what the future may hold.
Having a default point of view by itself is not necessarily a bad thing. After all we all must make choices one way or another, but if you choose a side (bull or bear) for the wrong reasons, likely you will fall victim to confirmation biases and look only for information and data that supports your viewpoints, ignoring most, if not all, differing data.
With mid-term elections coming up, politics are an obvious example of this bias. Do you choose Fox News or MSNBC for your nightly news and commentary? Viewers of those stations typically are watching the program that already confirms their political views and biases. This is a blatant confirmation bias example that likely results in a viewer not getting all the information and viewpoints. Psychologists would suggest switching the station to the one you least like in order to avoid confirmation bias and allow for you to make a more informed decision.
We at IronBridge are neither bullish nor bearish, and by not taking a bullish or bearish stance in the markets we can avoid (or at least reduce) mistakes that can occur from confirmation bias. If we said we were bullish, we may fall victim to looking (and presenting) only bullish arguments, charts, and data in order to justify that position. We would talk about earnings growth, tax cuts, and a strong economy. If we were bearish, we may focus on the negatives, such as all-time extreme valuations, high debt loads, trade tariffs or geopolitics. We live in a complex world, and things will never be always good or always bad.
Instead, we recommend investors try to remain as neutral and objective as possible. Markets work in cycles. There are times to be bullish and times to be bearish, a time to reap and a time to sow. Confirmation bias can prevent the objective execution of investment decisions. If prices are rising, we want our clients to participate in that trend. If they are falling, we want to avoid costly damage to hard-earned wealth. Simple as that.
Successful investing is about getting the probabilities of profit in your favor, and positioning your portfolio accordingly. Strict self-assessment, and recognizing your own potential biases is a great step towards that success.
Market Microscope
Both Sides of the Coin
“The eyes see all, but the mind shows us what we want to see.” – William Shakespeare
Are you bullish? We have some charts for you!
Are you bearish? We have some charts for you!
But wait, there’s more!
Sounds like an infomercial doesn’t it? Sometimes we feel that way about the markets as the manager of a long-only mutual fund shows off all his knowledgeable reasons why the market will continue to go up. After his commentary, the manager of a short equity hedge fund then goes on television discussing all the various reasons why he expects a bear market in the near future. Both managers are very compelling and state many indisputable facts that reasonably support their theses.
However, there’s a reason why neither manager waffles between bullish and bearish and a reason why you will probably never see somebody on CNBC say they don’t care which way the market goes. Most managers must support their fund’s mandates, and thus must be biased toward the market in that direction. Most are also benchmarked to an equity only index and must stay as near as 100% vested at all times.
This is really a shame as they are all blatant examples of confirmation bias sprinkled in with a large dose of conflicts of interest. The long only fund manager must find stocks to be long, and he will always find compelling reasons to support that bias. Just as the short only manager must always find (and will find) a bear market thesis somewhere. They are on television to sell their particular investment strategy, not provide objective information. The news station likes it too, because they are simply trying to sell commercials!
Why do you see way more buy recommendations than sell recommendations for stocks by the big banks? These analysts serve the long-only side of the market and are thus biased to be long as they take in fees from the long only fund managers as well as fees from their own ETF, mutual fund, and structured products that only make money if you “are invested” in them.
Luckily, IronBridge has a luxury most managers don’t. We don’t have to be bullish or bearish, and we also have the ability to go to cash and stay in cash (when necessary). We don’t earn fees from ETFs, mutual funds, or other structured products, only the fees our clients pay us to be their 100% fiduciary manager.
But, let’s play the game, let’s provide some candy for the bulls and some candy for the bears and see which side has a more compelling argument. We will see that whatever side of the camp you want to be on, there is plenty of Halloween candy for you to feast on.
Unfortunately most of these talking points are unproductive from an investment strategy perspective. Still, charts are fun to look at, so let’s take a gander!
The Bullish Case
There are many reasons to believe a continuation of the bull market that started in 2009 may continue for another few months, if not for another few years into the future.
Let’s look at three of them: the Fed, the Economy, and the Market Cycle.
Bullish: The Fed
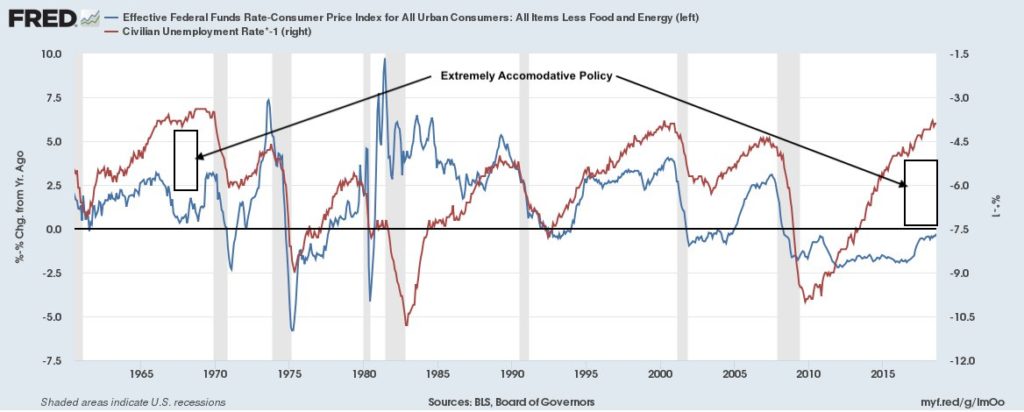
First, despite numerous rate hikes over the past couple years, there is data that suggests the Fed is still in an extremely accommodative position. The chart below, courtesy of Jesse Felder, shows that by one measurement the Fed is still as accommodative as any time in the past 80 years.
This chart looks a the effective Federal Funds Rate minus inflation, versus the unemployment rate (inverted). Large gaps have previously led to periods of continued low unemployment, implying a strong economy and higher stock prices.
As recently as this week, the Fed’s comments suggest they believe the economy still has room to move higher, and is continuing to increase interest rates at a slow pace.
Bullish: The Economy
Second, the economy is strong. Second quarter GDP came in at 4.2%. The economy has been consistently growing at a 2-3% pace for many years. The typical signs of an impending recession are simply not here, and the economy is not over-heating, which would signal the last phase of the economic cycle.
Bullish: The Market Cycle
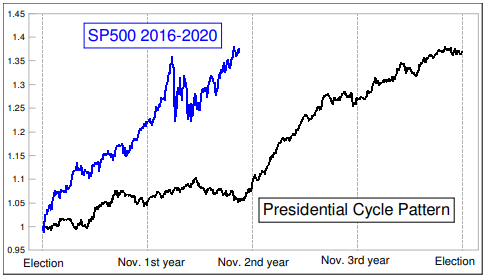
Third, while we believe the market is late in the current cycle, there are seasonality patterns that suggest the next 18 months could be strong. The chart to the right shows a well known market cycle called the Presidential Effect, courtesy of McClellan Publications.
The third year of a presidential term is by far the strongest historically. This pattern measures the 12 months from November to October of a President’s 3rd year in office. The average market return has historically been over 15%. In fact, the last time a president’s 3rd year in office was negative was 1939!
Buyer beware though, because one issue with using historical statistics as well as trying to pick a bullish or bearish investment stance as a strategy is being revealed now. The 2nd presidential year was supposed to be a flat year, yet the market is up over 10% this 2nd year of Trump’s term. Utilizing this strategy alone would have had you out of the market over the last year, to the detriment of your portfolio.
However, looking at the Fed, the Economy and the Market Cycle, the case can be made that the current market cycle supports a bullish view. So should we move all our chips into stocks and enjoy the bullish case? Let’s look at the other side of the argument next.
The Bearish Case
To examine the bearish case, we’ll look at three areas that strongly suggest this bull market is over, and we should expect a large market decline any time.
These areas are: the Fed, the Economy and the Market Cycle.
Bearish: The Fed
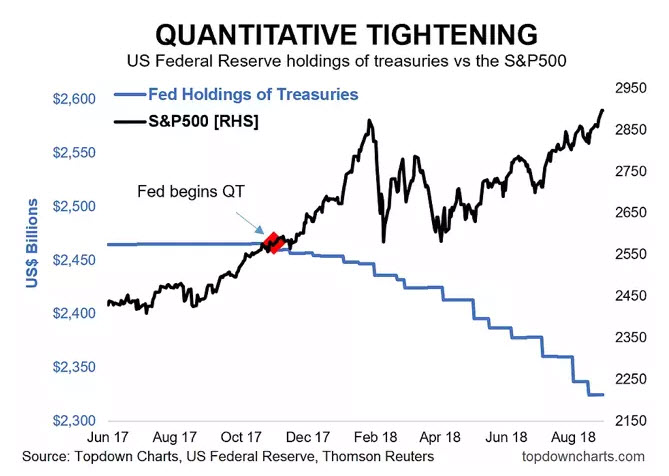
First, the Fed. There is little argument that the Fed’s actions over the past 10 years have resulted in higher stock prices. The S&P 500 index rose in lock-step with the Fed’s balance sheet, as the Federal Reserve implemented various Quantitative Easing programs designed to inject liquidity into the financial markets.
However, since last year, the Fed has reversed these programs, removing liquidity from the system and doing what has been referred to as “Quantitative Tightening”.
If adding liquidity to the markets resulted in higher stock prices, removal of liquidity must have the opposite effect.
The chart below shows the opposite: stocks have continued to move higher while the Fed balance sheet has shrunk. At what point will the market reflect this reduced liquidity? We call this the “Fed Premium”, and it suggests that stocks are poised to fall, and fall big.
Bearish: The Economy
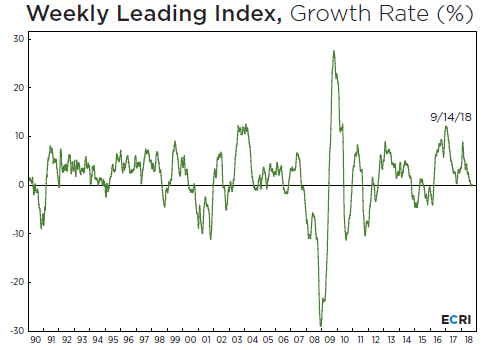
What about the Economy? Isn’t it strong and robust? Yes, but the economy is always the strongest at the top of the cycle and the weakest at the bottom. Leading economic indicators are showing a deterioration in the areas of the economy that project future economic activity, as shown in the next chart.
This chart shows an economy that is moving in a positive direction, but slowing. In fact, the growth rate is about to move negative, meaning that leading indicators are showing cracks in the strong economic narrative. This index is not a perfect indicator, but it does imply that the economy could be weakening.
Bearish: The Market Cycle
Finally, the Market Cycle also suggest that caution is warranted, and that we should be watching for a potentially very large decline.
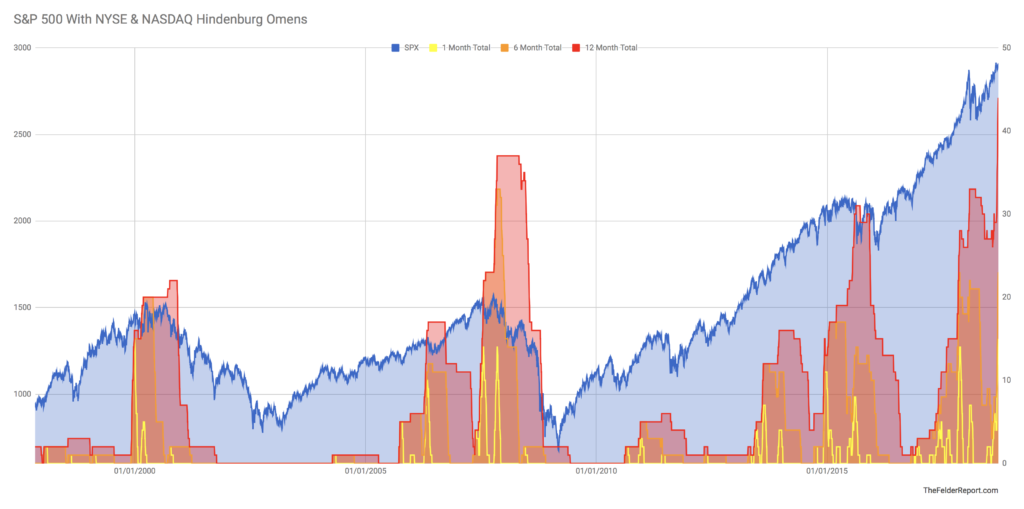
One indicator suggesting caution is called the “Hindenburg Omen”. This is a term coined by the late Jim Miekka and is an indicator capturing extremes in market breadth.
An “Omen” has 3 requirements:
- New 52 week price highs and new 52 week lows must each be more than 2.8% of all advancers and decliners
- NYSE Composite Index must be above the level it was 50 days ago.
- The McClellan Oscillator must be below zero (a cumulative breadth tool)
When an omen occurs it suggests a split market in which there are a good number of stocks making new highs but also a good number of stocks making new lows. Ultimately it signals a divided market, and that division has been showing up all year, to the tune of 44 occurrences this year alone. The 44 number is largely irrelevant on its own, but when you notice that 1) this is the most occurrences ever over the last 40 years, and 2) that these omens have historically occurred during market topping processes, it becomes much more meaningful. The chart below shows in red the three other times there were this many Omens. 2000, 2007, and 2015 is not good market company to keep.
So, which case is more compelling? Are you a bull or a bear? Either way, you have plenty of evidence to support your bias.
But hopefully you see how biases in the market can be a dangerous thing. Perhaps you disliked Trump before the election and you absolutely despise him today, that bias may have had you miss out on a major move higher in the market. The same would apply for President Obama’s term. Or, perhaps you invested in Bitcoin last year because all of your friends were getting rich. These are all biases that may have resulted in investors making faulty business/investment decisions. The S&P is up over 30% since Trump was elected, and Bitcoin has now fallen over 60% from its peak near $20,000 late last year.
Instead of picking sides in the bull/bear debate, we prefer to allow the market to do what it may, while we participate in the uptrends and do our best to avoid any potential downtrends.
The only way to really do this successfully is to allow the market price and other objective indicators be your guide and largely ignore all the biases that try to creep inside our minds. And most importantly, to apply a disciplined, objective and repeatable process.
Investors will not be able to get out of the way in the event of a downtrend if they are biased bullishly. They will continuously have reasons to be bullish and continuously have reasons to “stay the course”. Similarly, investors who are perpetually negative will always be able to find a reason to avoid the markets. They will remain out of the market, even while it is rising in price.
We prefer to remain neutral and allow the markets to run their courses, taking advantage where we can, while we can, and for as long as we can. The market price is the final judge and jury when investing.
Buddha said it best, “your worst enemy cannot hurt you as much as your own mind”. Getting rid of biases, especially the confirmation bias, gets us one step closer to making better financial decisions.
Invest wisely.
Our clients have unique and meaningful goals.
We help clients achieve those goals through forward-thinking portfolios, principled advice, a deep understanding of financial markets, and an innovative fee structure.
Contact us for a Consultation.
Neither the information provided nor any opinion expressed constitutes a solicitation for the purchase or sale of any security. The investments and investment strategies identified herein may not be suitable for all investors. The appropriateness of a particular investment will depend upon an investor’s individual circumstances and objectives. *The information contained herein has been obtained from sources that are believed to be reliable. However, IronBridge does not independently verify the accuracy of this information and makes no representations as to its accuracy or completeness. Disclaimer This presentation is for informational purposes only. All opinions and estimates constitute our judgment as of the date of this communication and are subject to change without notice. > Neither the information provided nor any opinion expressed constitutes a solicitation for the purchase or sale of any security. The investments and investment strategies identified herein may not be suitable for all investors. The appropriateness of a particular investment will depend upon an investor’s individual circumstances and objectives. *The information contained herein has been obtained from sources that are believed to be reliable. However, IronBridge does not independently verify the accuracy of this information and makes no representations as to its accuracy or completeness.

