Ooh, see the fire is sweepin’
Our streets today
Burns like a red coal carpet
Mad bull lost its way
– Rolling Stones, “Gimme Shelter”
The mad bull has lost its way.
And an historically volatile year is getting worse.
Last week it appeared that the market may have saved itself from more volatility.
But out-of-control inflation numbers once again show that this environment is anywhere from over.
In fact, it’s getting worse.
We don’t say this lightly, but the risk of a major market melt-down is extremely high right now.
The way the market structure looks right now is concerning.
Here are four of our major concerns:
- The Fed wants to reduce inflation, despite the consequences to the market or the economy.
- The bond market is cratering.
- Positioning in the market still remains bullish, despite very bearish sentiment.
- Patterns within the market are mirroring previous major declines.
We’ll briefly discuss each of the above, but let’s talk about portfolio positioning first.
Portfolio Update
Two weeks ago, the market rallied, and caused us to add measured equity exposure to portfolios.
As of today, all of that increase has been reversed, and equity exposure is now lower than it was three weeks ago.
Overall, we are extremely underweight exposure to stocks. And we expect that to be reduced throughout the week as well.
The next chart shows how your equity exposure looks relative to the maximum amount of equity you could potentially have in your portfolio.
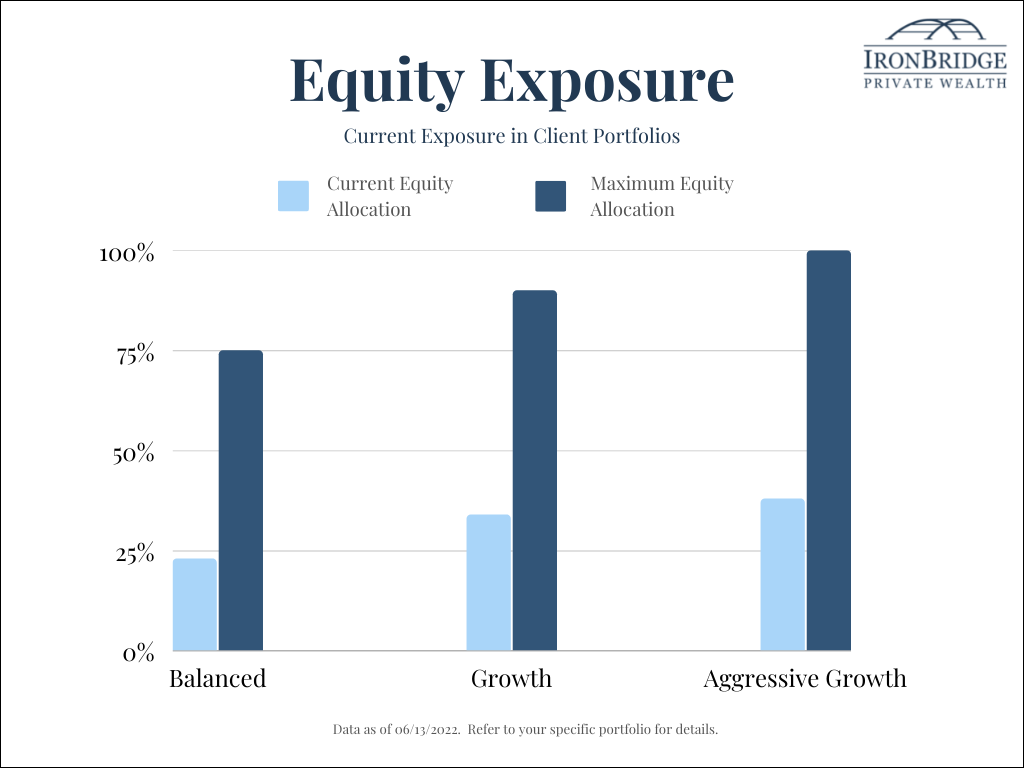
The remaining balance is in cash and short-term fixed income.
NOTE: When we say “cash”, we are referring to cash and cash equivalent ETFs in your account. The following tickers are considered either cash equivalents or short-term fixed income, with very little volatility: FTSM, BIL, GSY, RAVI, SHV and PSDYX.
By the end of this week, it may make sense to use inverse ETFs to hedge equity exposure for a short period of time, while holding certain positions that are still showing favorable risk/reward metrics. (We did this during the COVID crash in March of 2020, and it proved to be a very effective risk management tool.)
So while we have already reduced your equity exposure dramatically, it could get even lower as the week goes on.
As always, please reach out to us directly with any questions.
The Fed
The Fed meets this Wednesday.
They are in a bind.
Earlier today, the market was projecting a 72% probability of a 0.50% rate hike, with a 28% probability of a 0.75% hike.
However, after the market, the Fed apparently leaked data suggesting they would do a 0.75% hike instead.
Probabilities immediately rose, and the market is now projecting a 93% chance of a 0.75% hike on Wednesday. All in the matter of a couple hours.
The next chart shows the probability earlier today, courtesy of the CME group. Click on the chart to be taken to their website. The bar on the left is the probability of a 50 bps rate hike, and the one on the right is for 75 bps.
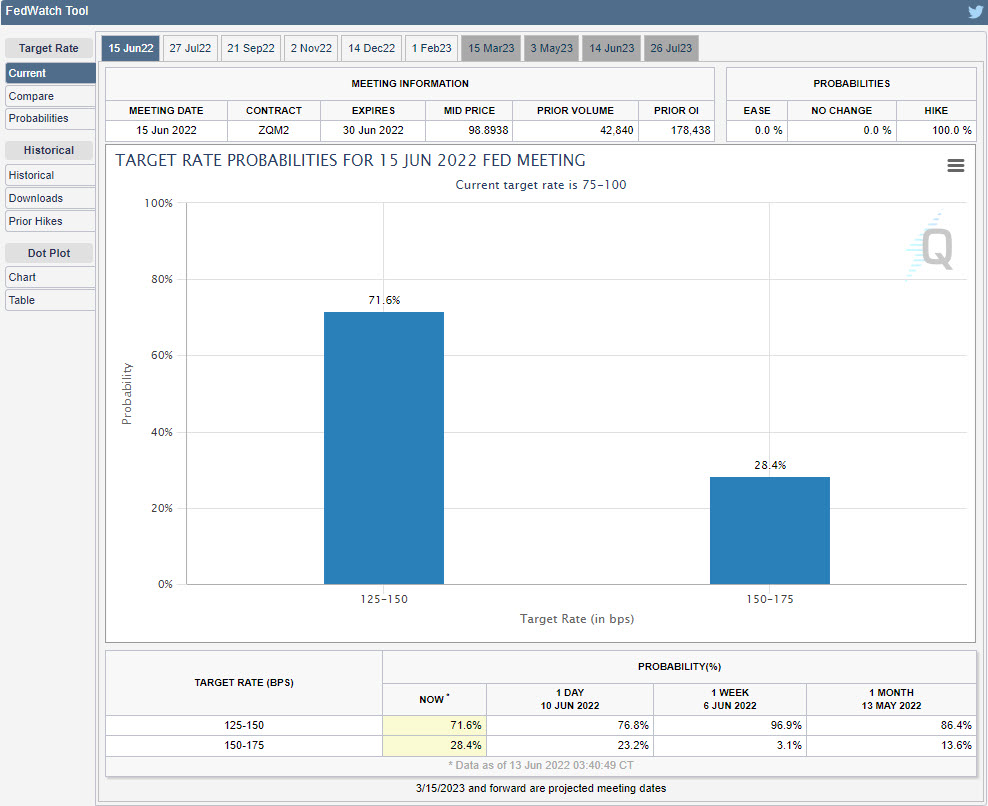
And here are the probabilities now…
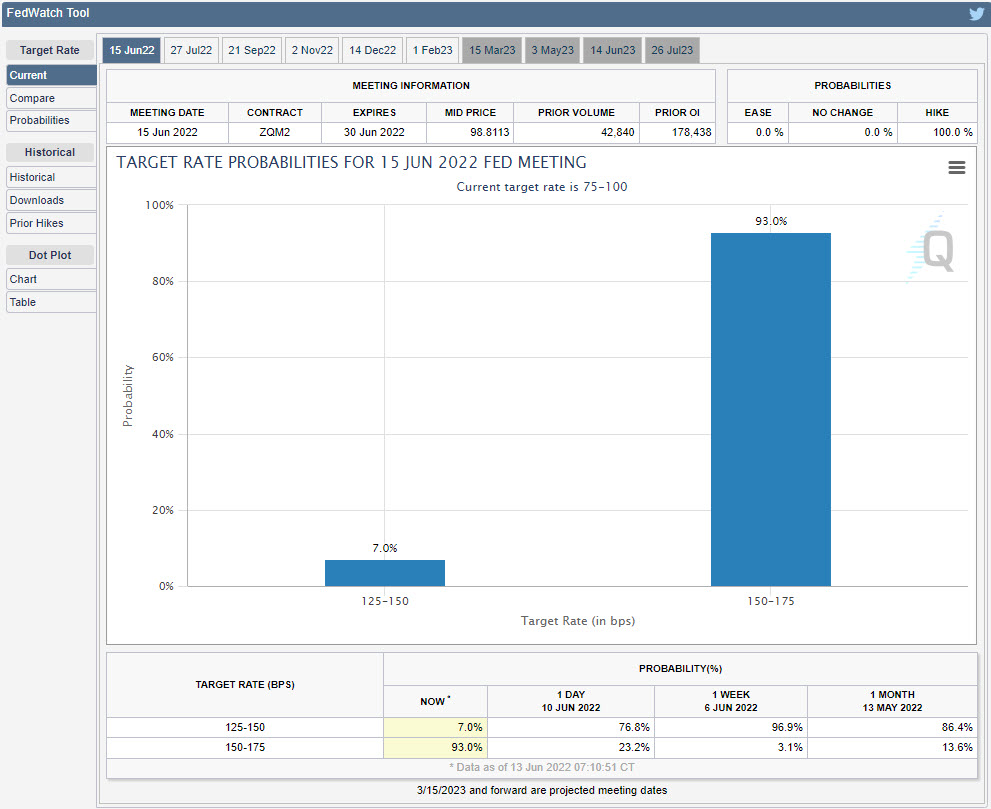
Just over a week ago, the probability of a 0.75% rate hike was only 3%. So in a few short days, the Fed changed their mind.
They have a fundamental choice to make: do they crash the markets and economy and reduce inflation, or do they blink and let inflation get further out of control?
It seems pretty clear which approach they want to take: fight inflation and the markets be damned.
Frankly, they are sleeping in the bed they made.
They let the bull market get crazy, and now the mad bull has lost its way.
The Bond Market
Bonds typically are a hiding place during volatility.
But when the Fed is raising rates, bonds have had more volatility than stocks.
In fact, long-term US treasury bonds are down over 58% over the past two years, as shows in the next chart.
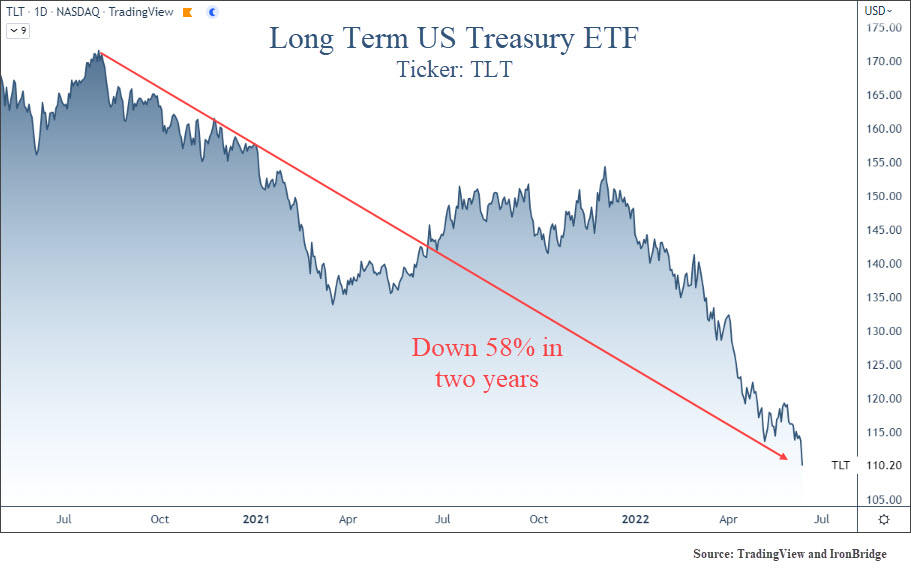
This is not a sign of a healthy environment.
Positioning versus Sentiment
One of the things we’ve been watching as a positive for asset prices is sentiment.
Sentiment is a contrary indicator.
When sentiment is extremely positive, market prices can be near a top.
Conversely, when sentiment is extremely negative, like it is now, it can be a sign that a low in prices are near.
However, new data has come out showing positioning by investors.
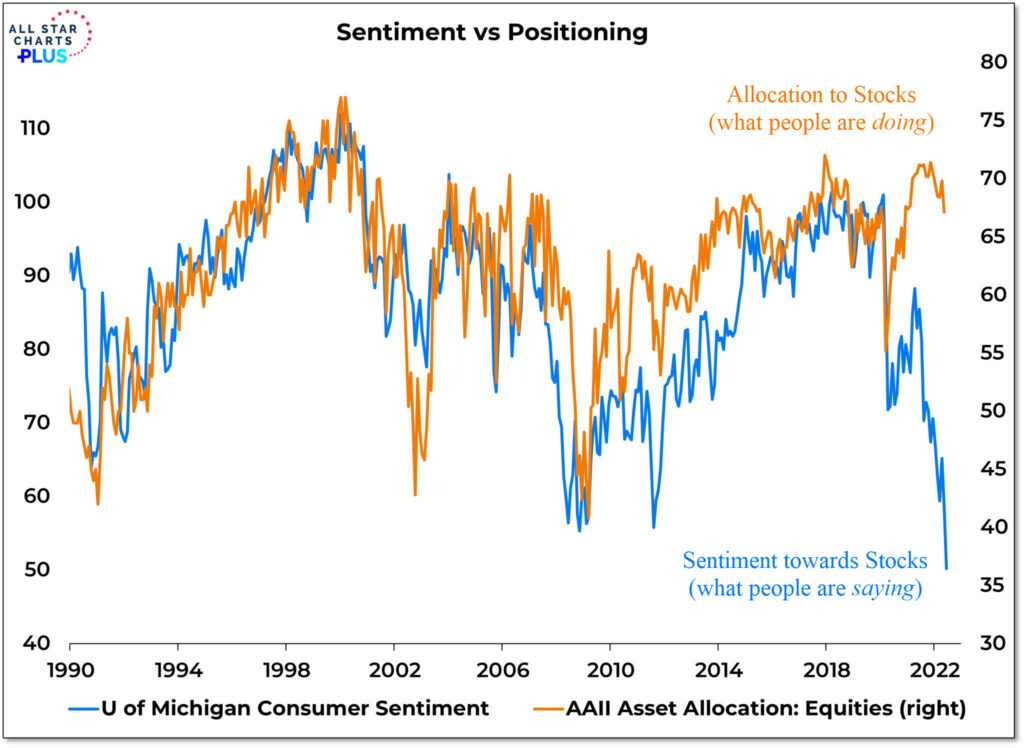
And what is shows is that what people are saying versus what they are doing is very different.
The next chart, courtesy of All-Star Charts, shows this variance.
The orange line is positioning. This shows the current allocation to stocks by a survey from the AAII (American Association of Individual Investors).
The blue line is sentiment. It shows the University of Michigan Consumer Sentiment readings.
Previously, there has been a very strong correlation between the two.
Now, this correlation has broken down completely.
This suggests one of two things:
- Consumers are overly pessimistic, and will ride out this storm.
- Investors are overly allocated to stocks, and a massive shift out of equities is about to occur.
Our guess is that the second scenario is the likely outcome.
Market Patterns are Similar to Previous Major Bear Markets
First of all, every decline is unique. We do not use this type of analysis in our day-to-day investment management process.
But it is interesting just how closely the current market environment resembles major bear markets from the past.
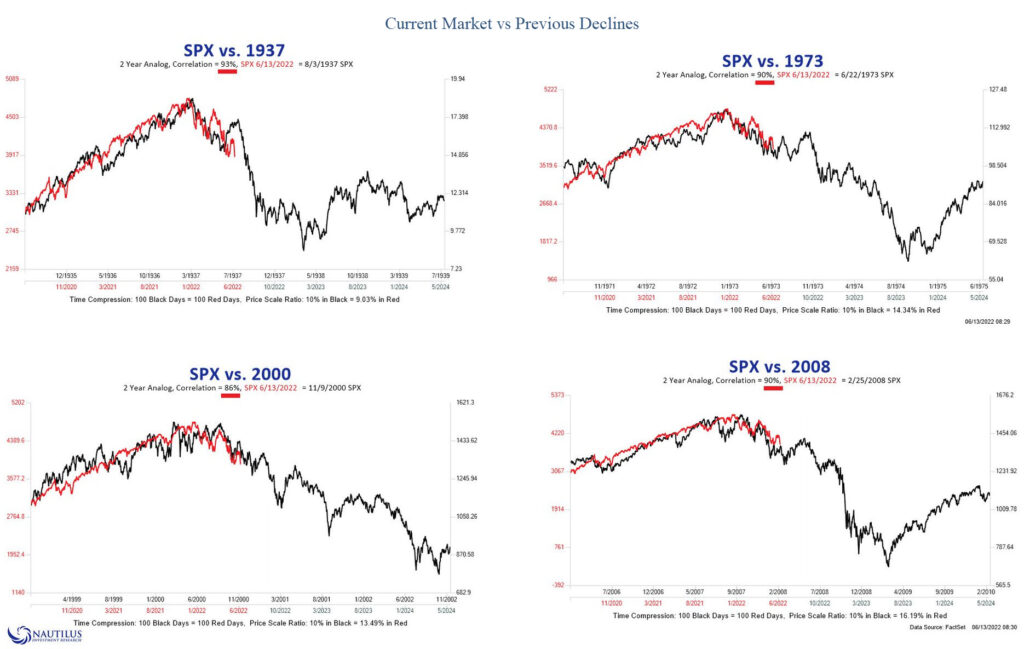
The final chart, from Nautilus research, shows how the current environment compares to other major bear markets in 1937, 1973, 2000 and 2008.
(Our apologies for the small print…click to view a larger version.)
The correlation of the current market to each of these previous bears is very high.
In fact, the current market has over a 90% correlation with each of these environments.
Again, we don’t have any direct inputs based on analysis like this, but it does suggest that the overall pattern is similar to other major tops. And we should be aware of these types of correlations.
Bottom Line
We were hoping the volatility was over, and that the extremes in sentiment that we have seen recently were going to be good signs of an impending low.
However, our concerns now are “how much further can this fall”?
We wish we knew.
The bottom could have happened today. We doubt it, but it could have.
However, the bottom may very well be much, much lower from here.
And we’re not going to wait around to see what happens. We’re not going to HOPE things change. We’re not going to stand by and let an out-of-control market destroy your hard-earned capital.
We are going to ACT. We have already taken major steps to reduce risk, and are prepared to take even more as warranted.
We’re in a time of MAJOR risk for markets.
Today felt a little panicky. Our guess is that it starts to feel much more panicky in the coming weeks and months.
If we are wrong, we will gladly admit it and add equity exposure back into your portfolio.
But if we are right, we will help you avoid what is potentially one of the largest bear markets in history.
When the mad bull finds its way again, we’ll be prepared.
But in the meantime, we’d rather protect your portfolio than stand by and watch it fall.
Invest wisely!
