That is the great fallacy: the wisdom of old men. They do not grow wise. They grow careful.
Ernest hemingway, “A farewell to arms”
Bear markets are not fun.
We all know that.
But there are valuable lessons from bear markets if you learn them.
Fortunately (or maybe unfortunately), we’ve lived through quite a few over the past 25 years. And given the volatility experienced during that period of time, our investment “age” would place us as old men. (The women of IronBridge remain obviously youthful.)
So Hemingway’s line from “A Farewell to Arms” resonates with us.
Bear markets may or may not create wisdom, because each one is different.
We don’t know how this one will play out. No one does.
But we have learned to be careful.
This got us thinking about various lessons we can learn from previous bear markets, and how we can apply them to today.
Below, we look at some higher-level lessons that relate to you and your well-being, as well as those learned from financial markets directly.
Let’s dig in.
Lesson #1: Keep Your Financial Plan on Track
The worst possible outcome of market volatility is not a decline in your wealth…it is a decline in your LIFESTYLE.
Don’t let that happen.
A good financial plan will factor in volatility in your portfolio. It is called stress-testing, and it is a statistical analysis using variable portfolio returns.
The chart below shows an example of hypothetical return projections for an actual client’s financial plan.
This is just one of a thousand different potential scenarios our planning software uses to stress test someone’s probability of success in a financial plan. (Please do not hesitate to reach out if you would like us to update your individual financial plan.)
Two major things we notice about this projection:
- Returns are not linear. Our software does not assume the same return every year.
- Returns aren’t always good. Four of the first five years in the chart show negative returns. The worst projected decline is negative 28%.
Assuming variability makes your plan more realistic.
By projecting that bad years will happen, your portfolio can better weather the storms when they happen.
Lesson #2: Avoiding Large Declines is Key
This seems like the most obvious lesson, but avoiding large declines is the SINGLE MOST IMPORTANT thing you can do when investing.
Why?
Because when you experience large declines (which we define as 25-30% or greater), you don’t only sacrifice your financial plan, you lose the most valuable investing commodity there is: time.
You lose time by requiring huge gains to get back to where you were before the bear market began.
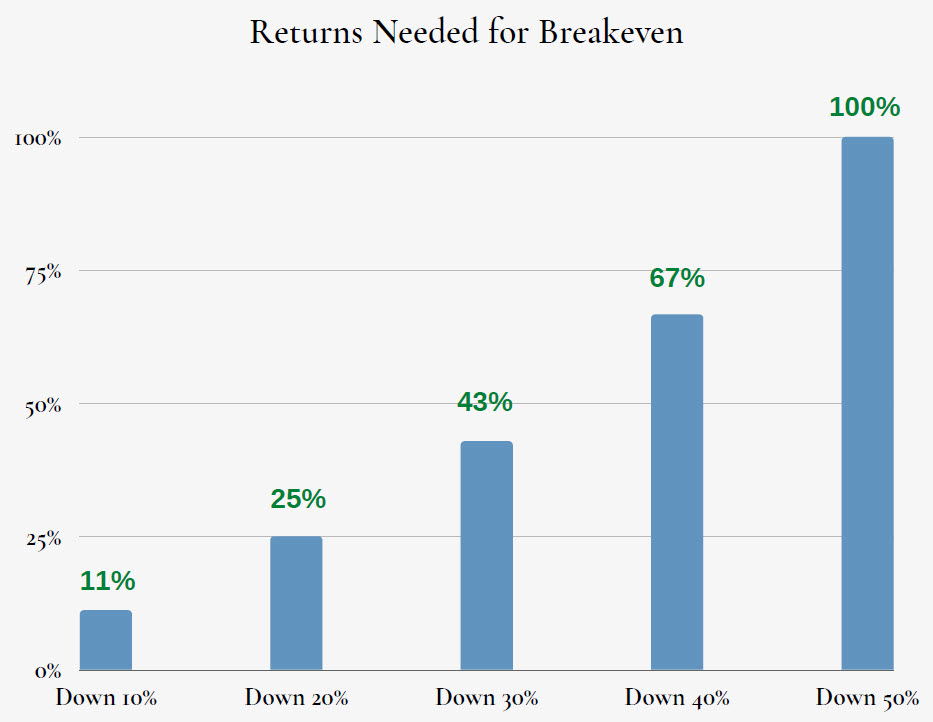
The next chart shows the return needed to get back to breakeven for various portfolio declines.
This chart shows that if your portfolio is down 10%, you need an 11% return to breakeven.
What stands out to us is that if your portfolio declines 30%, you need a whopping 43% return to breakeven. This is a huge return that takes multiple years to accomplish.
If you have a 40% or 50% decline, you need incredible future returns to get back to where you were.
These types of declines are not only painful emotionally, but will have hugely negative effects your long-term financial health.
Having the ability to move to cash is critical in our opinion.
Cash and short-term fixed income are the only predictable places to hide when major volatility hits the market.
Lesson #3: Diversification is Not Risk Management
Having different assets in your portfolio does not mean your portfolio is protected against large declines.
This year is a perfect example.
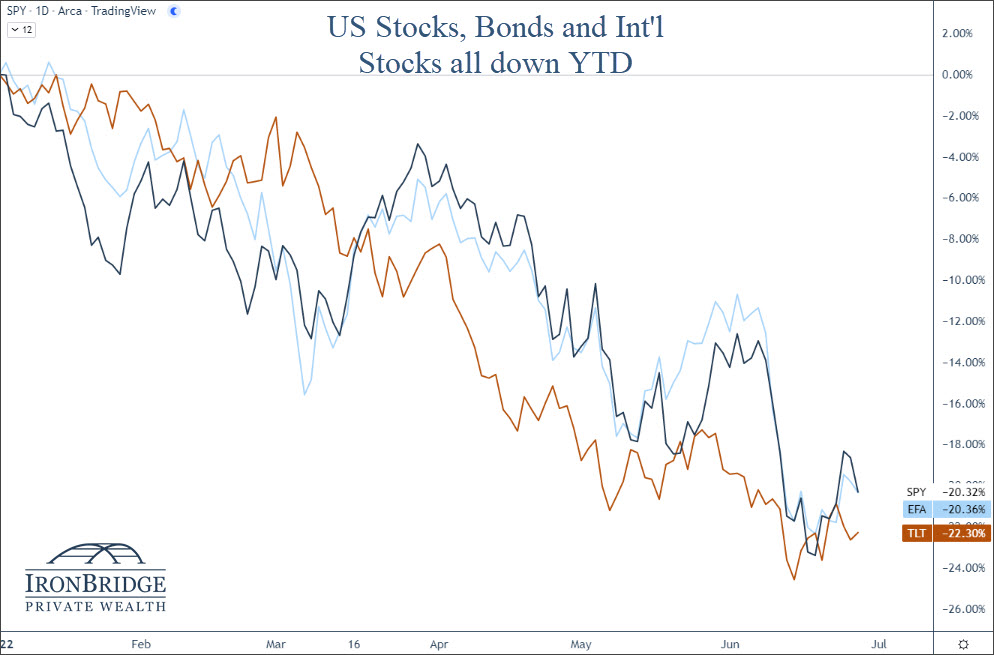
As of today, long-term bond prices have fallen MORE than stocks on a year-to-date basis, as shown in the chart below.
Maybe this changes in the second half of the year.
But relying solely on diversification as your primary risk management tool is not a good strategy to avoid large declines.
Lesson #4: Prices can Fall Further than You Think
There’s an old saying in the markets:
“How does a stock fall 90%? Easy, first it falls 80% then it gets cut in half.”
The lesson is that prices can be extremely volatile in bear markets, and can fall well beyond what may seem logically possible.
Let’s look at an extreme example of this today: Zoom stock.
Zoom was a darling of the COVID period as people abandoned the office and went remote. We at IronBridge became Zoom clients, and still use it many times per day.
Their earnings have consistently increased over the past two years, as shown on the bottom half of the chart below. The top half is price (blue line), and the orange is earnings per share.
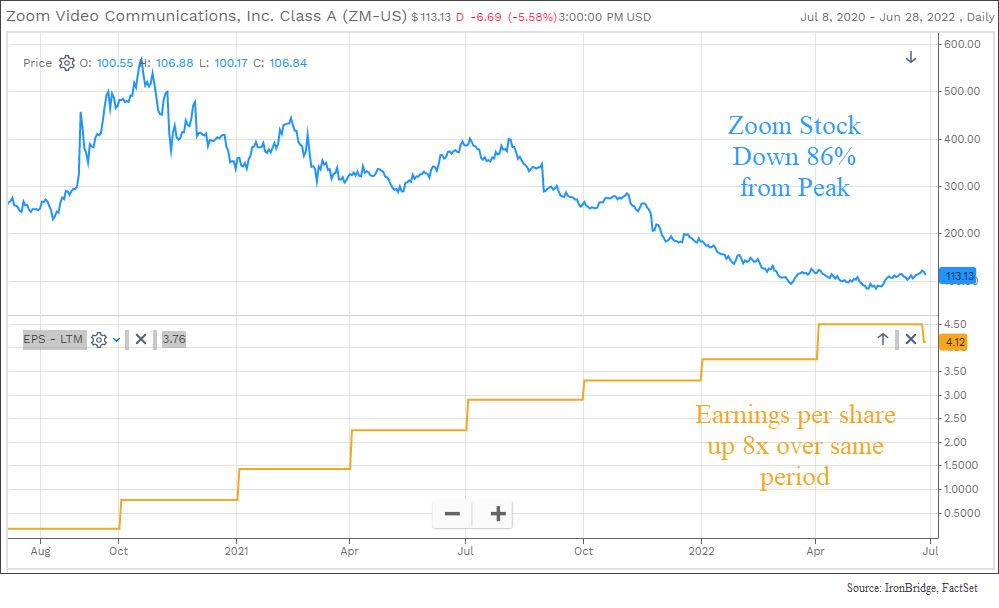
Not only have earnings increased, but they have massively increased (up more than 8-fold).
Over the same period of time, however, the stock has been crushed.
It was down 86% from peak-to-trough. Ouch.
This illustrates perfectly that the market is not always logical. We would go a step further and say that more times than not it is very illogical.
But if you are prepared for it, both strategically and emotionally, you can handle the fact that it will probably do things that don’t make sense.
Lesson #5: Markets Lead, Economic Data Lags
One of the most common arguments during the early stages of a bear market is that the economic backdrop is strong.
The problem is that economic data is backward-looking.
In 2008, the initial GDP numbers were positive for most of the year. It was only until late 2008 (when the market was down nearly 40% on its way to being down over 55%), that GDP was revised lower for previous quarters.
It showed that the actual recession started nearly 12 months before, in late 2007. But in real time, GDP didn’t go negative until the market already declined.
Don’t rely on forecasters to give you any help, either.
Here are forecasts from the 12 largest investment firms in 2008. This was published in Barron’s magazine in early 2008 after the market had already peaked and was down nearly 20%.
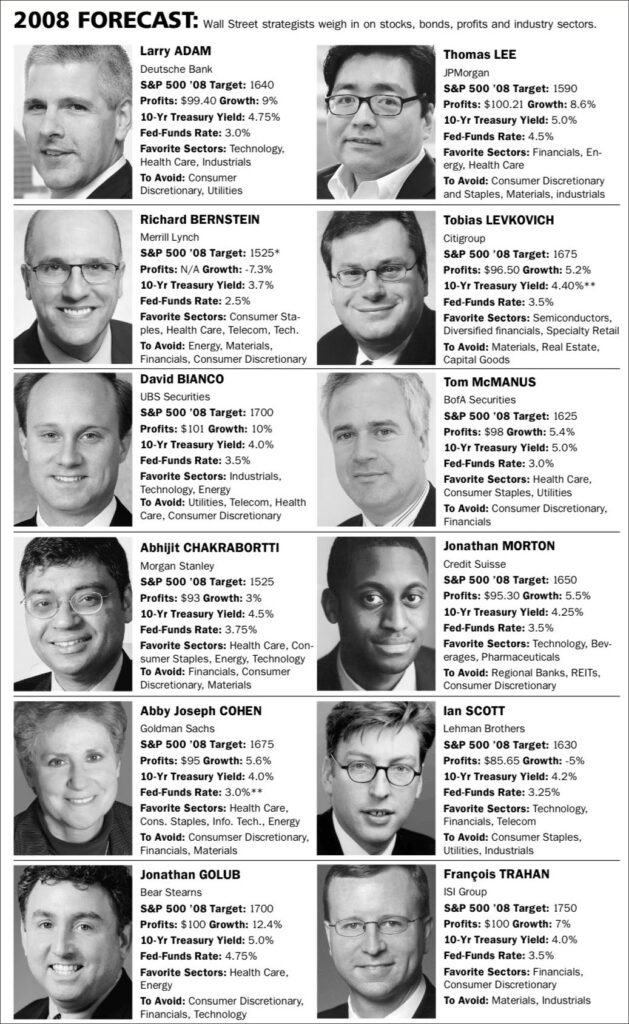
Just over a year later, the S&P 500 bottomed at 666 (this still freaks us out a bit). Most of these forecasts were wrong by over 1,000 points. Nice work.
Instead of looking at the economic data itself, like the fine prognosticators above were, pay attention more to the trends of the data:
- Is economic data improving or deteriorating?
- Are companies lowering forward guidance, or do they foresee continued strength?
- What are leading economic indicators doing?
- Is previously reported economic data being adjusted higher or lower?
Markets will price in risk before the economic data reflects the risk.
Sometimes the markets are wrong. After all, not every bear market results in a recession.
But if you can identify how economic data is trending, you can better assess the overall risk in the market.
Lesson #6: Bear Markets Don’t Repeat, but They Tend to Rhyme
No bear market is exactly like a previous one.
But there are similarities.
For one, there tends to be excess speculation somewhere in the economy or markets.
In 2008, it was real estate. In 2000, it was tech companies. Today, central banks have printed our way into a complete mess. In addition, crypto is one area where we are seeing excess speculation turn into massive losses in value.
In addition to working off excesses, bear market patterns tend to look similar.
The first chart below compares 2008 to 2022.
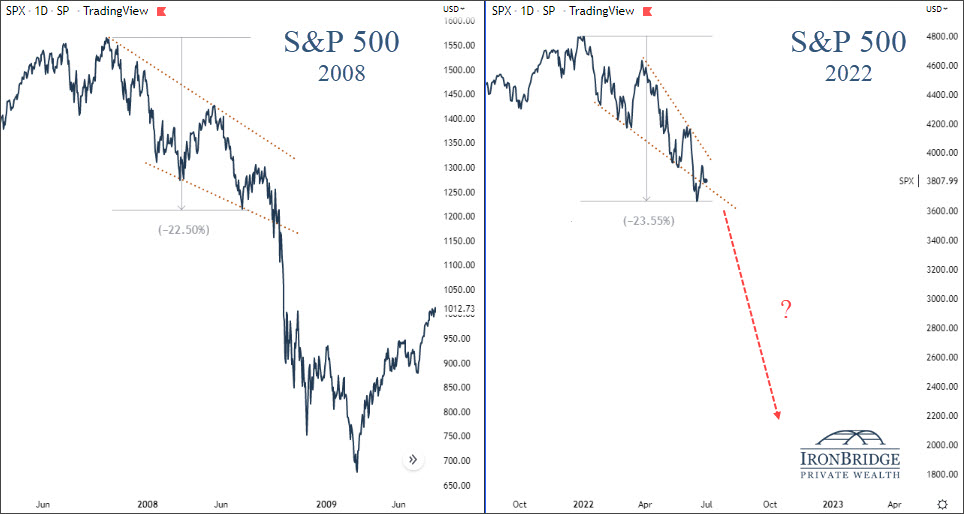
Looks pretty similar to us.
In 2008, there was a 22.5% drop before the bottom fell out of the market. Today, markets are down 23.5%. Maybe this suggests we are close to a similar outcome.
But there are plenty of chart comparisons that don’t result in massive declines.
In 1984, there was a recession, and the Fed was fighting inflation.
The next chart compares 1984 to today.
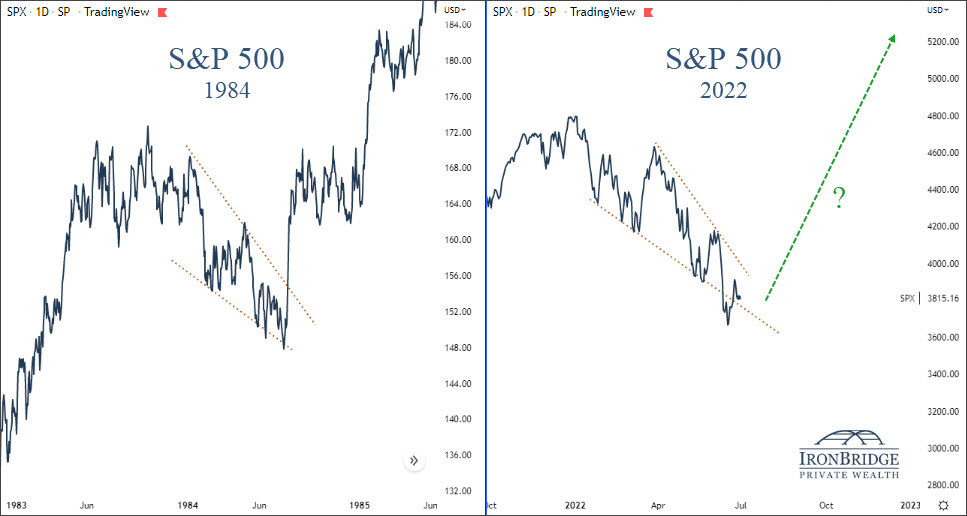
The pattern here looks pretty similar as well.
While both comparisons pass the eye test, each environment was different than today.
So while looking at these types of charts are interesting, they shouldn’t drive your behavior one way or another.
Lesson #7: Bear Markets can Happen in either Price or Time
When most of us think about a bear market, we naturally think of 2000 or 2008.
These were bear markets in PRICE.
In 2000, the Nasdaq fell over 70%. In 2008, the S&P 500 fell more than 55%.
Those of us in the markets then will remember those periods for the rest of our lives.
At their core, bear markets work off excesses of the previous economic and market expansion.
Prior to both 2000 and 2008, markets grew at rates that were were unsustainable. By the time these bear markets were done, prices collapsed and all the excesses were removed.
Price corrections tend to happen over the course of 1-3 years.
But markets can correct in TIME as well.
We haven’t seen a correction in time in quite a while.
In fact, the 1970’s were the last real sideways bear market.
The final chart looks at the Dow Jones index back to the late 1800’s.
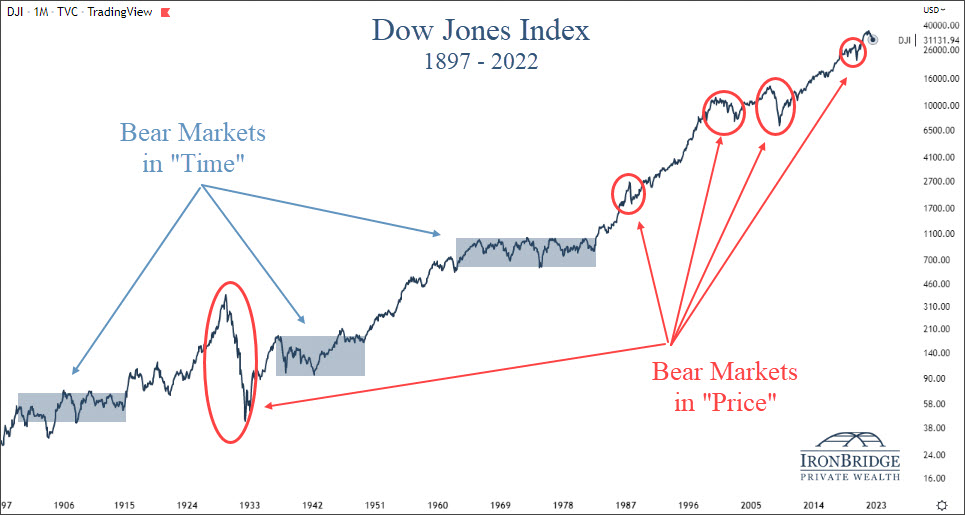
This chart shows 5 major periods of sharp price declines: 1929, 1987, 2000, 2008 and 2020 (circled in red above).
The tamest of these periods was 1987, when the market “only” lost 34%. Each other time, markets fell well in excess of 40-50%.
Additionally, there were 3 major bear markets that occurred in “time” (the blue shaded areas above):
- 1900-1915
- 1934-1950
- 1968-1982
Each of these periods lasted either 15 or 16 years. That’s a long time to have to wait for returns to start moving higher again.
Fortunately, these major bear markets don’t happen all that often.
But one thing in common with the previous bear markets that corrected in “time”: rising interest rates.
If we are going into a period of rising rates, which seems like a good assumption, the likelihood of a bear market in time seems to be a higher likelihood than a bear market in price.
Don’t let that scare you, though…there are ways to make money in a choppy sideways market.
It requires two components:
- Tactical exposure in the markets. You don’t want to buy-and-hold in a “time” bear market. The volatility will chew you up and spit you out. You must have the ability to move to cash to limit volatility when downturns happen, but be able to increase exposure to areas performing well. This is the basis of our investment philosophy at IronBridge.
- Increase exposure to yield-generating assets as interest rates rise. As yields go up, you can earn more on a variety of assets to compliment your tactical market exposure.
We are preparing for this exact scenario, and have already begun having discussions with a number of our clients about what this means in your particular situation.
Bottom Line
In summary, there are always lessons to learn from any market environment.
But it does appear that we are in a bear market that may not reverse as quickly as those that have occurred since 2008.
Thus, us battered old investment men at IronBridge will echo Hemingway’s quote and be careful and cautious until the situation tells us not to be.
Invest wisely!

