• Skip to main content
  • Skip to footer

IronBridge Private Wealth

Forward with Confidence

  • Home
  • Difference
  • Process
  • Services
  • Insights
    • IronBridge Insights
    • Strategic Wealth Blog
    • Strategic Growth Video Podcast
    • YouTube Channel
  • Team
  • Clients
  • Form CRS
  • Contact Us

Special Report

Thoughts on Recent Market Volatility

August 5, 2024

After an extended period of calm in financial markets, volatility has exploded higher the past two days. What caused it and should you be worried?

Hoping for the best, prepared for the worst, and unsurprised by anything in between.

Maya Angelou

Webinar

We are holding a webinar on Tuesday, August 6th to answer your questions and discuss current market volatility.

Look for information in a separate email.

What is Happening?

A few data points have spooked the market recently:

  • Japanese Central Bank raised interest rates, causing a “carry trade” to unwind. (This is the main culprit).
  • Yield Curve briefly un-inverts.
  • A jobs number was relatively weak last week.
  • Geopolitical concerns around Iran and Israel.

Should We be Worried?

Not yet.

Market volatility is always unnerving, but at this point the data suggests that this is a temporary move lower that should not result in the start of a major bear market.

However, we do expect large moves both up and down over the coming week(s).

We will update you as necessary.

What Should We Look For?

Most importantly, we should see selling pressure reduce in the next 48 hours:

  • If the selling is temporary, we should see a big snap-back rally this week.
  • If the selling is NOT temporary, we should still expect a big rally, but it will quickly be reversed over the next week or two.

Are we Selling?

Not yet.

We have “volatility overrides” as part of our investment process. This means that if certain panic conditions are present, we do not sell positions that meet this criteria.

Today, our process identified the current move as a panic move.

The last time the market gave us panic signals was at the COVID low in March of 2020.

Are we Buying?

We added exposure to small caps on Friday, and will likely continue to add on this weakness.

We did not buy or sell any positions today, but do expect to allocate to risk as the selloff fades.

That said, we will not hesitate to raise cash if needed.

Market Review

Let’s go over a few charts today:

  • VIX Index (Volatility)
  • Credit Spreads
  • Japanese Yen Carry Trade

We will discuss more tomorrow in our webinar.

Volatility Index

The VIX index is giving us the best view of the spike in volatility.

The move we have seen since last week is quite amazing. Here’s the chart:

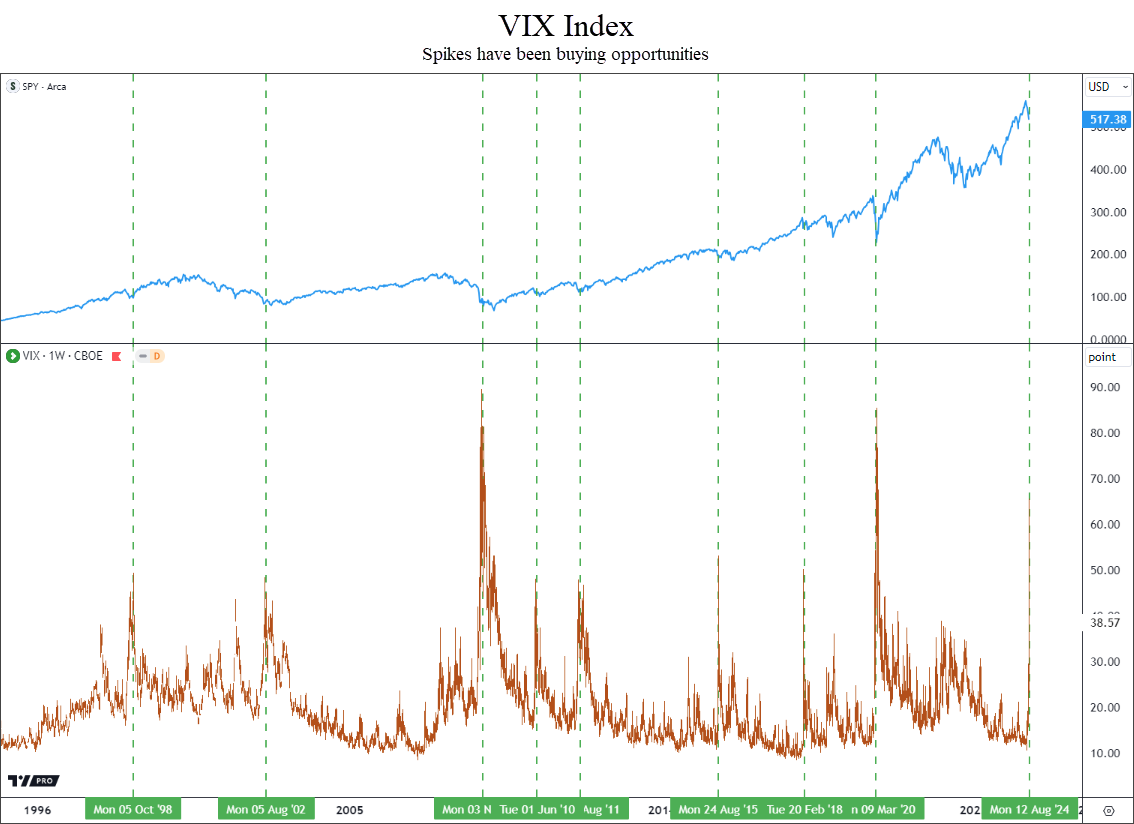
The blue line on top is the S&P 500 index (SPY), and the VIX index is in orange in the bottom pane of the chart.

This has been quite a spike higher, with the VIX approaching 70 today. It closed at 38 which is a good start.

Volatility doesn’t spike higher like this very often.

When it does, it has been an extremely good indicator that the selloff is either over or almost over.

This type of move typically does not mark a top in markets.

Quite the opposite in fact…this type of move usually signals that a low in price has either occurred or is close.

Credit Spreads

This is a warning sign that requires the most attention.

Anytime we see big moves lower in stocks, credit spreads widen a little as investors sell high-yield bonds and buy US Treasuries.

That is what we are seeing now, as shown in the next chart.

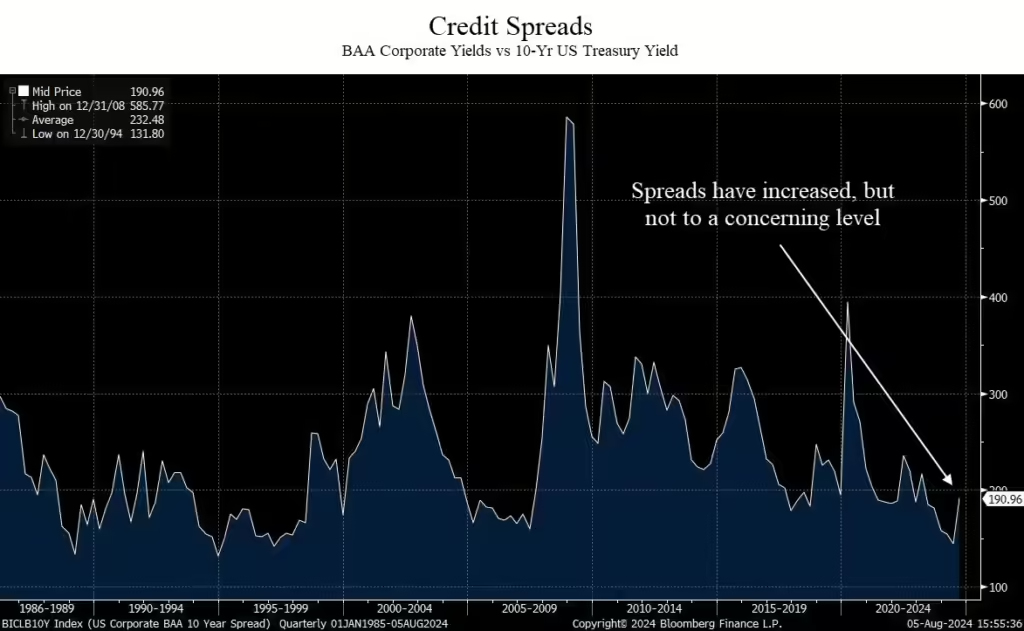
When this line goes up, it signals stress in the bond market.

Specifically, this shows the difference in yield between junk bonds and the 10-year US Treasury yield.

At 190 basis points, this means that junk bonds rated BAA only pay 1.90% above the 10-year treasury yield.

During the 2008 financial crisis, spreads jumped nearly 600 basis points, or 6%.

Normal spreads are 2-3%.

At readings of 1.9%, we are still below historical ranges.

For now, this indicator is not flashing warning signs, but the recent increase requires monitoring.

Japanese Yen Carry Trade

We saved this for last because it is the most complex.

We’ll try to simplify it.

A typical “carry trade” goes like this:

  1. Borrow money at low interest rates;
  2. Invest that money in assets that have higher return potential;
  3. Pay off the loan and keep the return minus the cost of the debt.

It’s essentially a fancy way to arbitrage, or make a spread between the cost of capital and the return you may get on the borrowed funds.

With the Yen carry trade, there are more factors at work.

One of the biggest factors is the currency conversion.

When money is borrowed in Yen, it is typically then converted to another currency, like the US Dollar.

That money is then invested in stocks or bonds.

The total return on the borrowed money is the return on the invested capital, plus or minus any return due to the currency moves.

When the Yen appreciates versus the US Dollar, it takes more dollars to pay off the initial loan in Yen. That means returns are diminished.

It then becomes stuck in a feedback loop.

The more assets that are converted back into Yen, the stronger the Yen becomes.

A stronger Yen puts more pressure on the carry trade, resulting in more selling.

More selling reduces return on the borrowed funds, resulting in a scramble to get out at any cost, as the return on the borrowed funds is eliminated by the strong Yen.

So let’s look at what the Yen has done.

Let’s review two charts:

  • Short-Term chart going back to last year;
  • Long-Term chart going back to the early 1990’s.

Let’s start with the short-term chart.

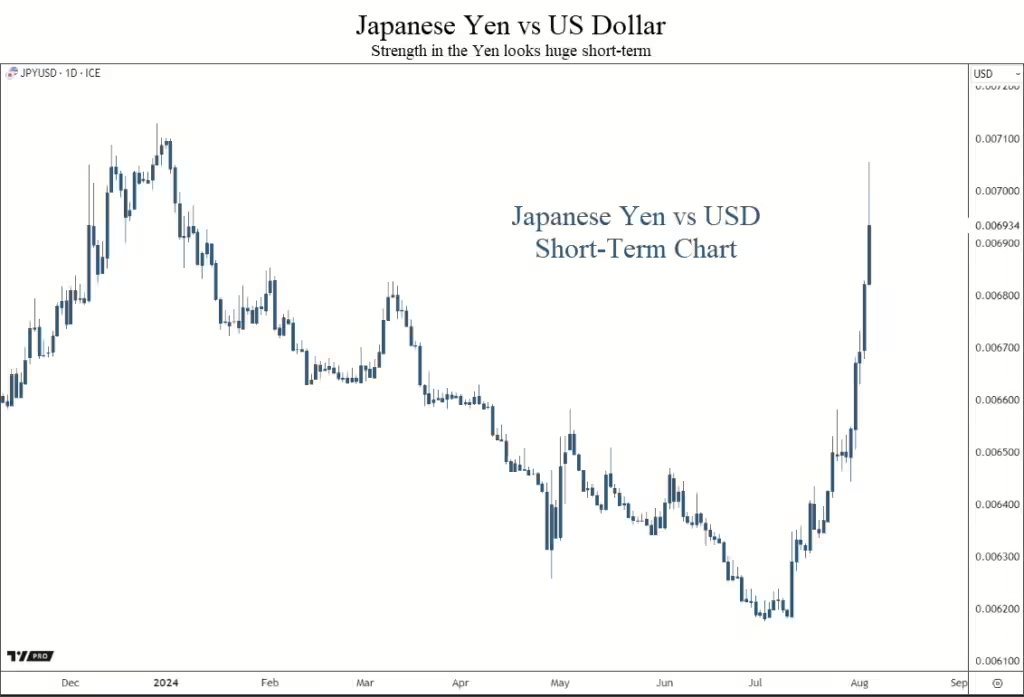
The move higher in the Yen appears to be a very large move.

When this line moves higher, the Yen is stronger. This hurts the carry trade.

When it moves lower, the Yen is weaker, helping to support the carry trade.

This move higher has resulted in a fast deleveraging of this carry trade.

Selling has been indiscriminate as investors try to reduce the damage from the strong Yen.

But like credit spreads, it’s helpful to take a broader view, so let’s look at the long-term chart.

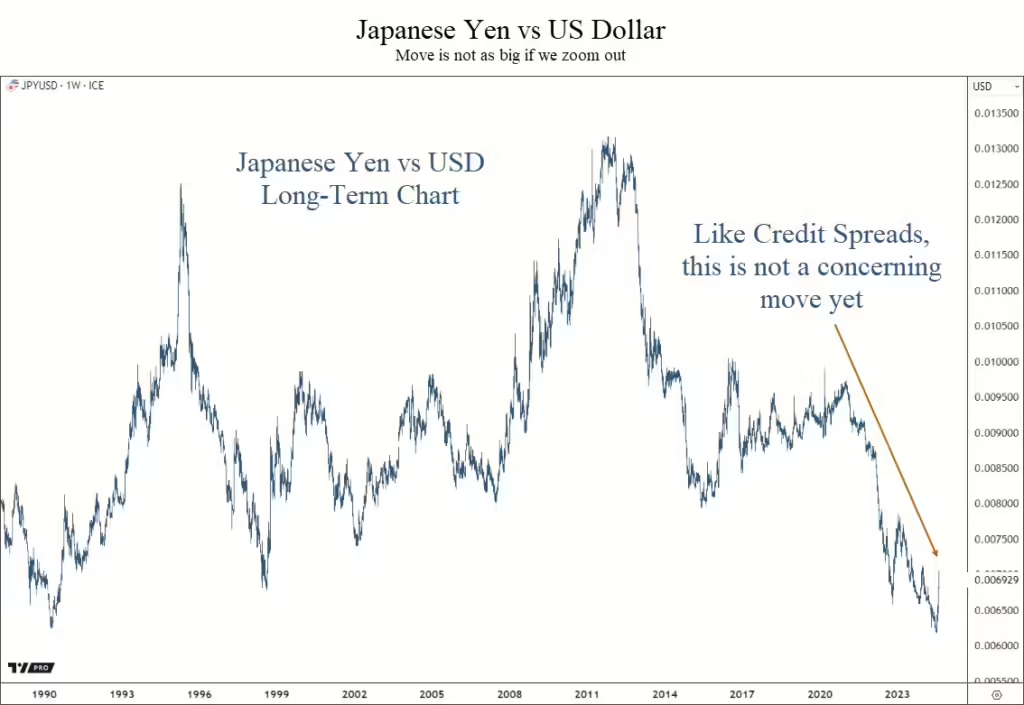
Just like credit spreads, the short-term move looks bad.

But by zooming out, we can see that the move hasn’t been all that unusual.

It may signal a massive trend change in favor of the Yen, but it is too early to say that with any conviction.

Bottom Line

The declines over the past two days have not been pretty. But at this point there is not enough evidence to get too defensive.

We will have plenty of information in the coming days, and will keep you posted on our analysis.

We will discuss this more in-depth in our webinar tomorrow, so keep an eye out for that email.

Invest wisely!


Filed Under: Market Commentary, Special Report Tagged With: bonds, carry trade, currency, japan, japanese yen, markets, s&P 500, us dollar, vix, volatility, yen, yield, yield curve

The Bear Market is Accelerating

September 13, 2022

Stocks had the worst day since the depths of COVID after inflation data came in higher than expected.

We’ll discuss the following in this report:

  • Market Overview
  • What is the Reason for the Decline?
  • Portfolio Updates

Let’s get to it.

Market Overview

Major stock indexes had huge losses today:

  • S&P 500 Index: Down 4.3%
  • Dow Jones: Down 3.9%
  • Nasdaq: Down 5.2%

Wow.

These are the biggest daily losses in over two years.

Bonds fell, international markets fell, commodities fell…everything was down.

This has not been a healthy market this year, and it looks to be worsening.

What is the Reason for the Decline?

The financial media is blaming inflation.

This morning, the Consumer Price Index (CPI) came in at 8.3% year-over-year, versus expectations of an 8% increase.

But do we really think the market would be up today if inflation was 7.9%? Is that 0.4% difference the real issue here?

We don’t think so.

Instead, we suggest that there is one main thing happening now: LIQUIDITY is being removed from the financial system by the Federal Reserve.

The strong rally in equity markets over the summer was based on the thought that the Fed would slow down the pace of interest rate increases.

This was wrong and illogical thinking.

The Fed has been very clear about this over the past three months.

They are actively trying to remove speculation from markets, in the attempt to reduce demand and drive down prices.

They WANT prices in the economy to fall. They WANT markets to fall. And they won’t stop until inflation is back down to 2%.

After today, there is a 100% chance that the Fed increases rates by 0.75% next week, with a 34% chance they raise a full one percent. They are not slowing down the pace of rate increases, they are increasing it.

The Fed also increased “Quantitative Tightening” this month. They are scheduled to remove almost $100 billion in liquidity from the financial markets in September alone.

The message in the 10 years after the 2008 financial crisis was “Don’t fight the Fed.” They were printing money like it was a monopoly game, with the goal of increasing asset prices to increase demand.

Now, we have the opposite environment, and the Fed is REMOVING assets from the financial system.

The natural result is decreased demand for risk assets.

But the message is still the same…don’t fight the Fed.

Portfolio Update

This year continues to be volatile, and we expect that to continue.

  1. As we shared in our video last Friday, the market is very volatile (obviously), and the outlook is uncertain. Two of our three highest probability scenarios include major declines in financial markets from here. The link to our video is below.
  2. We were already very defensively positioned in client portfolios with greatly reduced equity exposure and high cash and cash equivalent exposure. We increased cash exposure today as well.
  3. We see multiple scenarios where hedging positions will be included in client portfolios in the very near future. We also expect equity exposure to continue to be reduced from already low levels.

We discuss the following topics (followed by when they appear in the video):

  • Why the real estate market may be the best indicator to watch
  • S&P 500 Overview (4:46)
  • Similarities between now and 2008 (6:30)
  • Our top three potential market scenarios (8:15)
  • Yield Curve (12:06)
  • Commodities (13:05)

Bottom Line

This is not a time to be thinking about increasing allocations to stock. This is a time to be defensive.

This market environments could easily reverse higher, but the likelihood is that there is far more downside ahead.

We hope we are wrong. If we are, we will adjust accordingly.

In the meantime, the worst possible action is to do nothing, keeping large exposure to stocks and HOPE things get better.

Relying on hope in bear markets is the best way to make an investment mistake that could jeopardize your financial plan and your financial future.

As always, please do not hesitate to reach out with any questions.

Invest wisely.


Filed Under: Special Report Tagged With: federal reserve, inflation, interest rates, markets, volatility

Are the Dog Days of Summer Over?

July 19, 2021

A calm summer for the markets was interrupted today with a large selloff. Is this just a blip, or is it the start of a bigger decline?

What happened:

  • Dow Jones Industrial Index closed down 725 points, or 2.09%
  • S&P 500 was down 68 points or 1.59%
  • The media blamed COVID fears, but it looks more technical in nature
  • VIX Index rose nearly 40% at one point during the day
  • Bonds had their best day of the year, with long-term US Treasury prices up over 2%

Near-Term Market Assessment:

  • Numerous warning signs have been happening over the past three months:
    • Lumber prices have fallen 68% from their highs.
    • 10-Year Treasury Yields have dropped from 1.76% in March to 1.19% today.
    • Fewer stocks have been participating in the slow drift higher since mid-February. Today, more than 50% of the stocks in the S&P 500 are below their 50-day moving average (more on this below). That number has been steadily rising since April.
  • It is too early to tell if this selloff will continue. Bull markets tend to have short, sharp declines like this.
  • The S&P 500 Index is only 3% off its all-time highs. So the fear seems somewhat unwarranted at this point.

Portfolio Implications:

  • We have been systematically raising our stop-losses over the past few months.
  • We sold two positions today, one stock ETF and a high-yield bond ETF. Both moved to cash equivalent ETFs.
  • We may get further sell signals this week. If we do raise cash this week, it may not remain in cash very long if the market decides to resume its move higher.
  • We do not know when a short-term decline will turn into a long-term decline. That’s why we have rules and don’t try to guess. This kind of environment has the potential for a “whipsaw”, where we move from invested to cash and back to being invested. This is definitely not the favorite part of our process, but it is a natural consequence of having disciplined rules and not just winging it.

Market Discussion

Markets were down over 2% today. The primary (and easy) explanation is COVID. Every state in the US is showing a rise in cases. Los Angeles reinstated mask requirements this past weekend (even for those fully vaccinated). Other parts of California and possibly New York City may follow suit with mask requirements.

Naturally, any volatility in the markets is blamed on the most recent “thing”. It’s natural to assume that the rise in cases we are seeing now would result in a market environment like we saw in early 2020. We’re human and that’s what we do…extrapolate past events and assume they will happen again.

But the reality is that there were plenty of factors to explain the move lower today.

And they are mainly technical in nature.

First, market breadth has been very narrow the past few months.

This simply means that fewer and fewer stocks have been in uptrends, despite markets drifting higher. In fact, many stocks have been in downtrends since April.

The chart below shows the percentage of the S&P 500 Index that has been above its 50-day moving average (50dMA).

S&P 500 Index components above 50 day moving average following the market decline of July 19, 2020.

The 50dMA is simply the average price of a stock over the last 50 trading days. A stock above that level is generally considering to be in a rising trend (or a bull market). A stock that falls below that level is considered to be in a declining market.

What the chart above shows us is that while the market has been drifting higher, over 50% of the stocks in the index were in bear markets in June. This is referred to as “breadth”.

This indicator is similar to a game of jenga. When there are many blocks supporting the tower at the start of the game, the tower is strong and sturdy.

But as the game goes on, there are fewer blocks supporting the ever increasing height of the jenga tower.

This is happening in the stock market. When there are a lot of stocks supporting the index, it is more sturdy. In April, over 90% of the stocks in the S&P 500 Index were above their respective 50dMA. But as more and more stocks begin to reverse trend and fall, the index get wobbly.

This is very similar to mid-2018. We wrote about breadth in our “Soldiers are AWOL” report. After a weakening breadth environment in mid-2018, the market corrected by 20% in Q4 of that year.

The big tech stocks have been doing the heavy lifting in the past three months. The same exact thing happened in 2018.

The next reason is simply that the market is overdue for a correction.

So while COVID is to blame, the fact remains that we are due for a pause following the massive rally from the COVID lows last year. The market has had very little pauses, and is well overdue for a correction.

We shared the next chart in our last email newsletter, but it’s worth sharing again.

This shows the market rallies from previous major bear market bottoms. Three environments are shown here (1982, 2009 and 2021).

This chart suggests we are due for a natural pause given the strength of the move from March 2020’s lows.

So while the news is blaming COVID, the reason for today’s selloff seems to be much more technical in nature than simply worry about the delta strand.

The next few days will provide tremendous insight into what may happen over the coming weeks and months.

We had two sell signals today, selling one stock ETF and a high-yield bond ETF.

There is a chance we get many more sell signals this week.

However, no one knows if this is just a blip or if it is the start of something bigger.

Given the positive trends in the economy, continued massive support from the Fed, and the very technical nature of the market selloff today, we should assume that the bull market is still in tact, but due for a pause.

Risk management is a priority for us and our clients. Therefore, we will not wait to see what happens. We will act on our signals, and adjust course as necessary.

That could mean increased cash, but it could also mean that cash on the sidelines today gets put back to work very shortly.

Either way, the dogs days of summer could indeed be over for the stock market, even if it simply means a temporary pause in the bull market.

Please do not hesitate to reach out with any questions or concerns you have.

Invest wisely!

Filed Under: Special Report, Strategic Wealth Blog Tagged With: dow jones, market selloff, S&P Index, stocks, volatility

Gridlock is Good?

November 4, 2020

Markets across the globe surged today, despite election uncertainty. Just like in 2016, predictions about what would happen in the 2020 Presidential election were flat out wrong, as were market predictions for a market crash. It appears that gridlock, the Fed, and the potential for stimulus talks to resume are driving asset prices more than the uncertainty surrounding the election outcome.


“Gridlock is great. My motto is, ‘Don’t just do something. Stand there.'”

-William Safire, American author and New York Times political contributor


Given the fluid nature of the election results, we will be providing updates and context on portfolio positioning and analysis on how markets are responding.

We’ll keep these updates relatively brief, and we will likely be sending multiple reports over the coming days and weeks. As of this report, there has been no declared winner of the presidential election. However, it is becoming more likely that Biden could be the next President of the United States.

There are three main areas to discuss from yesterday’s election:

  1. Key Takeaways
  2. Market Analysis
  3. Portfolio Positioning

Let’s dive in.

Key Takeaways

Many people predicted that a contested election would throw the markets into turmoil, with numerous “experts” predicting a market crash if this happened.

There was no clear winner on Tuesday or Wednesday. Multiple states are still too close to call. Trump is threatening lawsuits and recounts. Neither side is budging. Results may not be known this week.

This is the exact scenario “experts” predicted would crash the markets.

Instead, markets were up substantially today.

Why?

Here is our initial reaction to the election results thus far:

  1. Gridlock is good. There was no blue wave as many people predicted. The market is interpreting this to mean that massive tax increases on individuals or businesses will likely not happen. Some tax changes should be expected, but they may not be as punitive as many initially feared.
  2. Predictions are Useless. In 2020, as they did in 2016, the “expert” pollsters had it massively wrong. So did the “expert” investment firms predicting market turmoil. Don’t use predictions as a basis for making political or investment decisions.
  3. Price is King. Prices are ultimately all that matter to your account values. Our job is to grow your portfolio during times of opportunity and reduce volatility during times of stress. Prices are telling us it is a favorable time to be holding risk assets.
  4. It’s Still all about the Fed. We’ve been saying this for months, the primary driver of market prices is liquidity from the Fed. The election uncertainty and delayed outcome did not change that.
  5. Expect Stimulus Talks to Resume. With the election behind us (sort of), the market will likely focus on continued COVID-related stimulus packages, in addition to a multiple-trillion-dollar stimulus package in 2021 from whomever ultimately wins the presidency.

Bottom line, markets are reacting favorably to a balanced government, stimulus and continued Fed liquidity.

One interesting stat…this could be the first time in history that there is a Democratic president, a Democratic House, but a Republican Senate. The primary message from the US electorate: work together.

Market Analysis

Stocks surged today. That may change tomorrow, but the initial reaction to the election was very strong.  The leaders were large caps, technology, biotech and healthcare, and most were up over 4% today.  It is not just stocks that are strong…market strength is widespread across asset classes.  Stocks, bonds and commodities are all higher in response to the election.

Let’s take a quick look at a shorter-term chart of the S&P 500. The first chart below shows stock prices since October 19th.

After a nearly 10% selloff during the second half of October, the S&P has surged almost 8% from recent lows. It is up over 2% today alone.

So much for that contested-election market crash.

Bigger picture, it appears that the market is continuing to consolidate after the massive surge off of the March lows.

The next chart is the daily chart of the S&P 500 this year. Since the September highs, stocks have been moving in a sideways and choppy manner. Today’s action looks like a continuation of that sideways move.

The market is clearly defining what it views as important price levels.

On the upside, if prices can exceed the two blue lines near the top of the chart (roughly 3500 and 3600), then prices could explode to the upside and enter what is called a “melt-up” phase. This could result in dramatically higher prices in a fairly short period of time.

On the downside, stocks have found support in the 3200 area (the blue shaded area in the chart above) multiple times over the past few months. If prices fell below this very important 3200 level, then probabilities rise dramatically that we will see further declines in prices. For now, that probability appears to be the lower likelihood outcome.

Until we see a decisive break out of this range in one direction or another, we should expect markets to be choppy, especially if there are any surprises from the vote counting process.

But the initial strong response by the markets is encouraging. We should expect continued Fed support of the markets, and discussion from the winning side about a multiple trillion dollar stimulus package following inauguration. We should also expect the COVID-related stimulus discussions to restart in Congress now that the election is done.

This is an excellent example of just how little impact these types of events usually have. This is not unusual. The data consistently tells us to pay more attention to what’s really happening under the surface of the market instead of the media-induced frenzy surrounding big events like elections.

Portfolio Positioning

As we have stated before in both this newsletter and during discussions with our clients individually, we do not make allocation and investment decisions based on events. Rather, we simply follow our predetermined process.

What actions have we taken for clients?

  • We have had increased cash exposure for clients since early September.
  • Last week, we had more sell signals get triggered, and entered election day with 25-30% cash, depending on our individual client’s pre-determined risk levels.
  • Today, we had a buy signal in our S&P 500 trend model. This moved 10-15% of portfolios from cash into the S&P 500 Index ETF this afternoon just before the market close.
  • Our signals are showing multiple areas of strength following the recent surge, and anticipate that we will likely get more buy signals in the coming days.

Overall, we have been pleased that our proprietary system has had us with higher than normal cash levels over the past couple of months, and it was reassuring to have extra cash in portfolios going into election day.

For now, our system is telling us that the probabilities favor higher markets over the coming months, but that could change quickly.

During times of volatility, there is the potential for what we call “whipsaws”. This occurs when a buy signal is followed by a sell signal in a fairly quick period of time. In any investment system that analyzes and follows trends, this is a potential risk. We have processes in place to help reduce the negative effects of these whipsaws, but they still happen nonetheless.

We hope this doesn’t happen, but if our signals tell us to be more defensive, we will adjust accordingly.

So expect to have increased activity in your accounts if markets continue to be volatile. The goal is to be positioned correctly for the market we have, not the market we hope to have.

For now, election day is over. The Fed remains supportive. We continue to have a balanced government. These issues are proving to be more important to markets than the actual results of the election or the potential contested nature of it.

All sides of the political spectrum can view yesterday’s results favorably. Democrats appear likely to win the presidency, but Republicans held many seats in the House and will likely have the majority in the Senate.

Maybe this is exactly what we all need. This has been a difficult year for many people, and let’s hope that we can move forward together.

Invest wisely.

Filed Under: Special Report Tagged With: biden, elections, gridlock, markets, presidential election, trump

Objectives during Volatility

March 16, 2020

“When we have hope, we discover powers within ourselves we may have never known- the power to make sacrifices, to endure, to heal, and to love. Once we choose hope, everything is possible.”

-Christopher Reeve


We continue to closely monitor the unprecedented environment surrounding the Coronavirus (COVID-19). While our primary concern is for the safety and well-being of our families, our team, our clients and our community, our primary focus is to help ensure the financial well-being of our clients.

Over the past few days, it seems like the anxiety has radically increased. We can feel it, and our guess is that you can too.

It can be unsettling. Shelves at grocery stores are bare. Normal plans are being cancelled. It now seems like a violation of social protocol to go out to dinner.

It’s not that it CAN be unsettling…it IS unsettling.

Today, instead of focusing on market data, let’s take a step back. What are the overall objectives that we are trying to achieve during this time?

In today’s chaotic environment, we are focused on four primary goals:

  1. Portfolio Values: Keep portfolio declines at levels so that the time it takes to recover any losses can be counted in weeks or months, not years.
  2. Financial Plans: Get through this period of time without needing to modify your personal financial plans in the wake of this panic.
  3. Distributions: If you rely on your portfolio for current income, make sure you have sufficient cash to support your distribution needs.
  4. Communication: We strive to keep clients up-to-date through individual phone and email communication, as well as sending bulk emails like this one to reach a large number of people quickly. We have implemented a policy of no in-person meetings over the coming weeks, and have invested in technology that will allow for webinar and video conferencing with our clients as warranted.

We discuss each of these goals below.

Portfolio Values

It was another bloodbath in the markets today. Stocks were down 12%, which was the second worst day in history for the Dow Jones and the third worst for the S&P 500. The only days worse were in 1987 for the Dow, when prices fell a staggering 22% in one day. For the S&P, October 1987 and one day in 1929 were worse.

The current market environment is obviously extremely tricky and incredibly complex. We have been adjusting clients’ net exposure to risk based on a combination of our quantitative processes and deep experience in financial markets.

Over the past few days, two existential threats have emerged:

  1. The likelihood of a recession now appears imminent.
  2. Financial markets could be closed for a period of time.

While social distancing on an individual and family level is indeed occurring as we speak, it is beginning to look like mass quarantines may very well take effect. San Francisco has implemented a “shelter-in-place” order, requiring all residents to remain at home with only a few exceptions. We fully expect other cities to follow suit.

The success of the economy is based on the movement of goods and capital, as well as the performance of various services across the country.

With such large parts of the population staying home, it appears improbable that we will avoid the existential risk of a recession at this point. Market prices have already begun to price in a deep recession, with the market having the fastest decline from all-time-highs in the history of the modern stock market, as shown in the chart below.

This is truly an unprecedented environment. The chart above does not include today’s 12% decline.

We still continue to believe that the current panic environment is not one that you should bulk sell into. With the VIX now over 80, we should expect daily moves to continue to be very volatile, both up and down.

While we don’t want to panic sell, we also believe that we should take steps to manage the risks of these relatively new existential threats.

On one hand, we must strive to keep portfolios so that there is a short recovery time. To that end, we have moderately increased cash and reduced equity exposure and are continuing to “thin the herd” by removing the weakest equities from portfolios. We also added hedge positions over the past two weeks that go up when markets go down to help offset short-term volatility in portfolios.

On the other hand, as we have said many times during the past couple of weeks, current conditions are so extreme that we must maintain an appropriate equity exposure so that we do not miss the inevitable (very strong) bounce that will occur. Even if that means additional near-term declines. We need to be cautiously opportunistic, and continue to adjust exposure into areas showing strength. And we need to be prepared to be very opportunistic, as this selloff ultimately will provide an excellent investment opportunity.

While we never like portfolio declines, client portfolios are currently at levels where recovery times are still acceptable. We want to make sure we keep it that way. Hence, the additional steps we have taken to manage risk.

The other existential risk is the possibility that financial markets shut down completely. This potential should not be ignored. We hope that doesn’t happen, and are uncertain whether that would be good or bad for markets over the near term. This appears to be a lower likelihood scenario, but we cannot ignore the potential for this to occur.

We discuss this in the “Distributions” section below, but from a portfolio standpoint we simply want to own a smart combination of cash, equity and hedges, so that if markets do close we are not concerned about positions if it happens. If it were to close, the logical time that it would be closed would be for a week or two, and would not likely extend weeks or months into the future. And again, we think this is a lower probability scenario.

Our best guess is that if markets were to shut down, it would likely happen this week.

While market closures are rare, they are not unprecedented. According to thestreet.com, the markets have been closed the following times:

  • 1865: Following the assassination of President Lincoln, the New York Stock Exchange was closed for a week.
  • September 20, 1873: The market closed for 10 days after the banking firm Jay Cooke & Company went under as a result of failed demand for railroad bonds.
  • July 31, 1914: The NYSE is halted for 4 months at the start of World War I. Foreign nations had large investments in US stocks, and the market was halted to prevent these nations from using funds for war build-up efforts.
  • 9/11 Attacks: Following the events of September 11, 2001, the all major US markets were closed for 10 days.
  • October 2012: Markets were closed for 2 days due to Hurricane Sandy.

There were other times where markets shut down to honor US Presidents who had passed away and various other reasons, but these were the major ones. Once the markets re-opened, they were generally positive over the coming months.

The Fed has also taken unprecedented steps by cutting interest rates to zero over the weekend and announcing $1.5 Trillion of funds that will flood the market. This should eventually have a very positive effect on markets, but it is uncertain when that positive influence will start.

For now, we will continue to adjust exposures both up and down, look for opportunities to both manage risk and be opportunistic, and will work to keep portfolios in positions to weather this storm and emerge stronger as the crisis subsides.

Financial Plans

Fortunately, portfolio fluctuations like what we have seen this year are already factored into financial plans. We do not make straight-line assumptions for returns. Rather, our financial planning software assumes that market volatility will happen over time, and incorporates both good and bad market conditions.

In addition, one of our key financial planning philosophies is to be conservative in our assumptions. We do not use aggressive return assumptions. We plan for longevity. We assume spending may be slightly higher that what may actually happen.

By combining all of these factors, we can have our confidence that our clients will achieve their goals. Even in the midst of the current chaos, we can rest knowing that we are not outside of any tolerances that our financial plans have projected.

Distributions

As we mentioned above, some clients rely on their portfolio for income. In preparation of potential market closures, we further raised cash today that clients can use if needed, without having to sell any positions.

Again, we do not think this is the likely outcome, but we need to prepare for it nonetheless.

For clients taking regular distributions, we have raised cash equal to at least 3 months of these distributions. Portfolios have more overall cash than that, but these funds are held in bank deposits within accounts so that they can be transferred to other banks as needed without the need to sell anything.

Communication

We find reports like these to be very useful, as we can communicate with large numbers of clients, friends and colleagues all at once.

That does not replace the importance of one-on-one communication. If we have not spoken with you, we will soon. If we have spoken with you via phone or email, expect to hear from us again soon.

If you have questions, please do not ever hesitate to reach out to us directly.

IronBridge Policies

Everyone must do their part during this chaotic time to help slow the spread of this virus. As our little part, we are eliminating in-person meetings for the time being. As mentioned above we are now using web-conferencing technology to help keep our client meetings as personal as possible.

From day one, IronBridge was set up to work remotely. So today’s environment will not affect our ability to serve clients. We use a third-party technology firm that leverages military-grade encryption technology so that our clients’ information is protected, regardless of where we perform our duties. Our laptops allow us to be fully functional from anywhere with an internet connection, so we will be able to handle portfolios and financial requests.

Conclusion

This is a scary time. The level of uncertainty is higher than any other time in recent history, including 2008 and the events of 9/11. I think we all would agree that you can feel the anxiety, and it is real.

But we will get through it. And we will emerge from these times stronger than we entered.

We must remember that we are in this together. If we do, we can rediscover the sense of community that only tragedy seems to bring out. Maybe, just maybe, this sense of community can be more permanent than has been the case in our recent past.

Stay safe friends.


 Our clients have unique and meaningful goals.

We help clients achieve those goals through forward-thinking portfolios, principled advice, a deep understanding of financial markets, and an innovative fee structure.

Contact us for a Consultation.

Neither the information provided nor any opinion expressed constitutes a solicitation for the purchase or sale of any security. The investments and investment strategies identified herein may not be suitable for all investors. The appropriateness of a particular investment will depend upon an investor’s individual circumstances and objectives. *The information contained herein has been obtained from sources that are believed to be reliable. However, IronBridge does not independently verify the accuracy of this information and makes no representations as to its accuracy or completeness.  Disclaimer This presentation is for informational purposes only. All opinions and estimates constitute our judgment as of the date of this communication and are subject to change without notice. > Neither the information provided nor any opinion expressed constitutes a solicitation for the purchase or sale of any security. The investments and investment strategies identified herein may not be suitable for all investors. The appropriateness of a particular investment will depend upon an investor’s individual circumstances and objectives. *The information contained herein has been obtained from sources that are believed to be reliable. However, IronBridge does not independently verify the accuracy of this information and makes no representations as to its accuracy or completeness.

Filed Under: Special Report

Crisis = Danger + Opportunity

March 10, 2020

In the Chinese language, the word “crisis” is composed of two symbols. One represents “danger” and the other “opportunity”.

Markets today are in a crisis. On Monday, the S&P 500 fell 225 points, or 7.6%. The Dow Jones dropped 2,013 points, or 7.8%. Crude oil fell over 30% at one point over the weekend, and interest rates are at the lowest level in recorded human history.

This has indeed been an historic move lower, at least with regards to the speed at which it has occurred.

As the Chinese word symbolizes, there is both danger and opportunity in the current crisis.

At IronBridge, we follow many indicators to gauge the underlying health of the markets. Over the past week, nearly every one of them have been at levels that typically accompany major market lows. During times of panic, like the period we find ourselves in today, it does not pay to sell. It pays to have prudence and patience, while mapping out changes that need to occur when the markets give us the inevitable bounce.

A major component of our investment process is to back-test specific rules that govern our process. One situation we have back-tested involves periods where markets experience quick, heightened risk.  What our findings show is that reducing risk during these periods of intense selling pressure actually does more harm than good, at least when specific conditions exist. This risk reduction would make you feel good at the time, but it has dramatically negative affects on long-term portfolio returns.

The reason is that when these periods occur, it typically happens during bull markets. Declines happen quickly and powerfully, and eventually the trend higher resumes. In longer-term bear markets, selling is more gradual and persistent, instead of fast and furious.

The trade-off is that you may have to experience slightly higher volatility in the short-run. So over a 2-3 week period, we may see bigger swings in portfolio values because we don’t have quite the level of cash that we might otherwise have during more frequent, but more orderly selloffs.

Let’s walk through a few quick charts showing just how intense this selling pressure has been, then discuss what we are doing in client portfolios.

First, the decline from peak-to-trough over the past three weeks now stands at 20%. In the 4th quarter of 2018, it took the market 3 MONTHS to decline 20%, and now it has happened in less than 3 WEEKS.

Such a rapid decline has caused many indicators to show dramatically oversold conditions, as shown in the bottom half of the chart above. We are seeing readings that are more extreme now than in the depths of the financial crisis in 2008.

These are not conditions to sell into. Yes, it is uncomfortable, and no question it is also scary. But it is not prudent to do wholesale adjustments to strategy in this environment.

One of the indicators that has a high priority in our investment process is called the Relative Strength Index, or RSI. It is a measure of momentum, and specifically analyzes of the strength of up days versus the weakness of down days over a preset period of time.

This has a very reliable, statistically significant information it can give to us. When it reaches extreme levels like we have seen over the past week, it has been an excellent indicator of a low point in the markets.

The chart below shows the S&P 500 Index with RSI in the bottom pane. Since 2011, these condition have reliably signaled a low point in the markets. We have tested this data much further back than 2011, and it confirms what the chart below tells us: don’t sell in these conditions.

Two times, in 2016 and 2018, we had 10%+ rallies, after the first signal, but the markets ultimately made new lows over the next few months. That may very well happen again now. But we should expect that the market will provide some much needed relief in the very near future.

Another indicator showing how much pessimism exists in markets today is the put/call ratio. This ratio measures the relative amount of put options purchased (traders thinking markets will decline) versus the amount of call options bought (thinking markets will rise).

This is a measures of fear. When this indicator is high, fear is also high. When it is low, market participants are complacent.

The next chart shows the S&P 500 versus this Put/Call ratio.

Currently, this ratio is higher than at any time during the financial crisis. The only time it was higher was during the “Flash Crash” in 2010.  This signals an extremely high level of panic and widespread fear.

One last indicator to discuss is the straight-forward “Fear and Greed Index” compiled by CNN.

In January, no one feared the market. The indicator was at one of the highest readings of all time, as shown in the first image below.


Fear & Greed Index on January 3, 2020


Fear & Greed Index on March 9, 2020

But as the second image shows, we are now in the exact opposite scenario of extreme fear just a short few weeks after the first reading was taken. Uncertainty dominates the landscape, and is showing itself in many indicators.

Bottom line, with so much fear in the markets, it is not prudent to sell.

Portfolio Strategy

For clients, we took steps to reduce risk prior to the selloff beginning, which we discussed in our report from last week. That was the time to take steps to manage risk. Since then, it has been prudent to be patient and to keep exposure relatively consistent.

Today, we did two things.

First, we continue to reposition equity exposure away from weak holdings into stocks showing greater strength. The majority of stocks we have been purchasing are associated with people staying at home. Streaming TV services, home delivery companies, and communication technology companies that allow people to more effectively work from home.

This theme in positioning is a direct result of the market favoring exposure to companies that may be positioned well for a continued effects of the coronavirus.

The other move we made today was to allocate a small portion of portfolios from cash into a pure equity hedge. This investment goes up when the market goes down, and is designed to be a very short-term hold to offset the risk of markets experiencing further declines and trading halts.

The next few weeks will determine if cash in portfolios will be put back to work, or whether further risk reductions will be warranted.

Overall, we expect the market to experience a strong rally that should begin soon. We do not expect the danger to be over, but we do see opportunities.

Invest Wisely!


 Our clients have unique and meaningful goals.

We help clients achieve those goals through forward-thinking portfolios, principled advice, a deep understanding of financial markets, and an innovative fee structure.

Contact us for a Consultation.

Neither the information provided nor any opinion expressed constitutes a solicitation for the purchase or sale of any security. The investments and investment strategies identified herein may not be suitable for all investors. The appropriateness of a particular investment will depend upon an investor’s individual circumstances and objectives. *The information contained herein has been obtained from sources that are believed to be reliable. However, IronBridge does not independently verify the accuracy of this information and makes no representations as to its accuracy or completeness.  Disclaimer This presentation is for informational purposes only. All opinions and estimates constitute our judgment as of the date of this communication and are subject to change without notice. > Neither the information provided nor any opinion expressed constitutes a solicitation for the purchase or sale of any security. The investments and investment strategies identified herein may not be suitable for all investors. The appropriateness of a particular investment will depend upon an investor’s individual circumstances and objectives. *The information contained herein has been obtained from sources that are believed to be reliable. However, IronBridge does not independently verify the accuracy of this information and makes no representations as to its accuracy or completeness.

Filed Under: Special Report

Trade Tariffs Sink Markets…Again

May 13, 2019

Major stock indexes fell over 2% on Monday, May 13th.

While the majority of our indicators are still showing signs of strength, various measures of market health are signalling the potential for a change of trend from the strong upward moves so far this year.

Last week, our proprietary signals moved most client portfolios into a roughly 30% cash position. We could not have anticipated the trade events that have transpired since, but our system took steps to help protect portfolios in advance, which is exactly the goal of any good system.


Market Update

Volatility is Back, but for How Long?

Following increased tensions in the China trade tariff talks over the past week, major US stock indices fell hard on Monday, with the Dow Jones down over 700 points at its low.

The political game being played between Trump and China is impossible to predict or assign odds to. It would be like assigning odds to a game of chicken. Who will blink first? Neither Trump nor Xi of China know those odds, so how possibly could we?

One thing is for certain…do not make any investment moves based upon this trade war/beef/tantrum/conflict/negotiation, or whatever other description you’d like to assign.

Instead of looking at the news to make investment decisions, we analyze a wide variety of objective indicators designed to understand the health of the market. We have developed a set of rules that govern our portfolio management activities, and execute the plan with diligence and consistency.

Based on our analysis, we see two scenarios as most likely to occur:

  1. The market has a 5-10% pullback, followed by new all-time highs this summer/fall.
  2. The market has a much larger pullback that will ultimately fall below the December 2018 lows. This would result in a decline exceeding 20% before ultimately moving to new highs.

Both of these scenarios would likely lead to the same ultimate conclusion…new all-time highs. However, the path with which they might get there would be extremely different.

SCENARIO 1: 5-10% Pullback

If the first scenario is happening, the pullback should not be more than 5-10% from the highs reached a few weeks ago. Currently, the market is 5% below its highs.

These are normal, garden-variety-type pullbacks that typically occur 1-2 times per year. Some risk management is required for these declines, but the end result is that only nominal, temporary damage is done to portfolios.

However, as is the case when investing, it is unknown if the pullback will stop at 5%, 10%, 20% or worse. The fog of war is thick, and the future is unknown. Which is why we focus on objective risk management tools that can limit overall portfolio declines.

We prefer to let the data do the talking, and a majority of data can be found in price charts.

One reason we like to use charts in our analysis, is that you can easily visualize some key inputs that move stock prices.

There are many important indicators to consider, but most have an indirect impact on market prices. There is no magical valuation level that moves prices; there is no specific level of economic activity that cause stock prices to get to a certain area. No level of unemployment, product sales, inflation, debt level, or any other economic indicator actually causes prices to move. They have important INDIRECT effects on stock prices, but none actually change the price by themselves.

Ultimately, moves up and down in the markets are driven by supply and demand. Period.

It doesn’t matter if people buy or sell stocks because they are panicked, because they are hopeful, because they love Trump or because they despise him. It is the actual act of buying and selling that drives prices, not the reasons for these actions.

Most market analysis focuses on indirect causation. This results in the analysis to ultimately be about human behavior. A prediction about the market based on an economic indicator is simply a prediction of how people will INTERPRET and ACT on this economic data, not on the data itself. Market analysts practicing this type of interpretation don’t realize that they would be more accurate in their predictions with a psychology degree than an economics degree.

Back to supply and demand. This is what actually moves prices. Higher supply (more sellers) pushes down prices, while higher demand (more buyers) pushes prices higher. This gets us to our first chart.

In the chart below, we look at a critical area of support on the S&P 500 index. This chart shows the market performance from the December lows. It also shows a unique way to show index volume, called “Price-by-Volume”.

Typical charts show the volume of shares that was traded during a particular time-frame…daily volume on a daily chart, weekly volume on a weekly chart, etc.  This chart instead shows the amount of shares that were traded at a given price level. Bigger bars on the chart shows higher volume, and vice-versa.  This can tell us when other market participants likely bought shares in a rising trend or sold them in a falling trend. In other words, it can provide a glimpse into supply and demand levels.

Since the market has been moving consistently higher since December, this area shows us that a large portion of the trading that has occurred has happened in the price range that we are in now.

These areas of increased volume-by-price can provide a very reliable indicator of future behavior of the market. If the “Support Area” in the chart above proves to hold, we can expect that the likely outcome is that the market will move to new all-time highs in relatively short order.

However, if market prices break below the support area, we would expect to see increased selling pressure as supply in the market overwhelms demand.  If this occurs, the odds dramatically increase that scenario two will develop.

SCENARIO 2: Retest of December Lows (20%+ decline)

This is the scenario we hope doesn’t happen. The market recovers from the awful 4th quarter last year, only to “Rinse and Repeat”.

Last week we would assign this probability as a much lower likelihood than Scenario 1.

These odds appear to be increasing slightly. Through last week, the aggressive areas of the market were continually scoring very high on in our system. We discussed this in our last “Insights” report which you can view HERE.

Sectors such as technology, consumer discretionary and industrials were leading the way, while more defensive areas like utilities, healthcare and consumer staples. Since the market started to move lower, that is changing.

One of the easy ways to visualize this rotation is using the chart below.

This type of chart is called a “Relative Rotation Graph”, or RRG. We use a more advanced type of this chart in our day-to-day process, but this one is a good visual of moves under the surface of the market.

The symbols listed in the chart are those of various sector ETFs. The tickers that are moving up and to the right are showing strength when measured against the S&P 500 Index. XLP is the Consumer Staples fund, XLU is utilities, XLRE is real estate, and XLV is healthcare. These have shown relative strength recently.

Conversely, XLK (Technology), XLY (Consumer Discretionary), and XLF (Finanicals) are all showing weakening movements. While XLI (Industrials) is trying to strengthen once again.

This tells us that we could be witnessing the early signs of a trend change. When markets get volatile, market participants move into these defensive areas. That has been the case recently, at least to some degree.

Other indicators we follow are still showing signs of strength. Also, the indirect causation factors (ie, economic indicators) are also showing good signs of strength that could support buying.

What do we do Next?

As of today, the upward trend is still in tact. We continue to believe we are late cycle, and large moves like this are to be expected.

Yes, there were announced that the US would implement increased tariffs on Chinese goods, but the market has been declining for almost two weeks prior to that announcement. So other factors must have been at play.

We can choose to attempt to predict how these various other factors might cause people to buy or sell or hold. Or we can accept that the market price is the market price, and position portfolios accordingly.

Fortunately, our diligence in risk management paid off last week as IronBridge clients had roughly 30% of their portfolio move to cash. Knowing your exit can pay off when markets get volatile. Developing and executing a repeatable process is key.

In the meantime, we will continue to monitor the markets and make necessary adjustments. We hope the market finds its footing and starts to move higher, and prove that Scenario 1 is in the cards.

But hope is not an investment strategy.

We a have strict buy and sell discipline we will continue to adhere to, so you can rest assured we will take prudent and appropriate actions as stewards of your hard-earned wealth. Cash on the sideline will be put back to work as investments meet our buy criteria, and other investments sold if they meet our sell criteria.

In the meantime, we expect to see elevated volatility in the markets, with large price moves up and down until the market finds it footing. But the market is showing that risk has indeed increased, and we should pay attention to this warning.

Please reach out with any questions or if you’d like to schedule a time to discuss the potential market outcomes or your portfolio specifically.

Invest wisely.


 Our clients have unique and meaningful goals.

We help clients achieve those goals through forward-thinking portfolios, principled advice, a deep understanding of financial markets, and an innovative fee structure.

Contact us for a Consultation.

Neither the information provided nor any opinion expressed constitutes a solicitation for the purchase or sale of any security. The investments and investment strategies identified herein may not be suitable for all investors. The appropriateness of a particular investment will depend upon an investor’s individual circumstances and objectives. *The information contained herein has been obtained from sources that are believed to be reliable. However, IronBridge does not independently verify the accuracy of this information and makes no representations as to its accuracy or completeness.  Disclaimer This presentation is for informational purposes only. All opinions and estimates constitute our judgment as of the date of this communication and are subject to change without notice. > Neither the information provided nor any opinion expressed constitutes a solicitation for the purchase or sale of any security. The investments and investment strategies identified herein may not be suitable for all investors. The appropriateness of a particular investment will depend upon an investor’s individual circumstances and objectives. *The information contained herein has been obtained from sources that are believed to be reliable. However, IronBridge does not independently verify the accuracy of this information and makes no representations as to its accuracy or completeness.

Filed Under: Special Report

It’s Baaaaaack….

October 10, 2018

The past few months have seen a consistent reduction of risks in the US stock market. That has changed over the past week, and volatility is back with a vengeance today. The Dow Jones fell 823 points, the 3rd largest point decline in history. The two largest declines occurred in February.  


Risks have once again increased, and the character of the market may have changed today. It is not a foregone conclusion that the market will see a period of volatility like what happened in February, but the likelihood of that is much higher today than last week.

The important “tell” will be how the market behaves once it has an inevitable bounce from these oversold levels.

Fortunately, for IronBridge clients, our proprietary models shifted portfolios into a more defensive mode last week, and as a result risk was reduced by nearly a third of what it was a couple weeks ago.

We cannot stress enough that the most important part of an investor’s toolkit is having an unbiased, repeatable process that can adapt to changing conditions.


Stock Markets

Stock markets across the globe had a heavy dose of selling today. Some of today’s moves:

  • S&P 500: Down 94 points, or 3.29%
  • Dow Jones: Down 832 points, or 3.15%
  • Nasdaq: Down 316 points, or 4.08%
  • Russell 2000: Down 46 points, or 2.86%
  • Semiconductor Stocks: Down 4.46%

What happened?

The news outlets will blame higher interest rates, but we do not think that is the culprit. In fact, interest rates were little changed today. The fact is, interest rates have been steadily moving higher since August. And all of a sudden it matters today? Not last week, or two weeks ago? Today, when interest rates were little changed?

Instead, we believe the culprit for the selloff was weakness under the surface of the market.

There are three important stats that help us understand this weakness:

  • Five stocks (or 1% out of 500) were responsible for an amazing 60% of the return for the S&P 500 Index this year.
  • 48% of S&P 500 stocks are in a bear market, as measured by being below their 200-day moving average.
  • 60% of all NYSE stocks are in a bear market. NYSE stocks represent more than 2000 companies, or all of the stocks traded on the New York Stock Exchange.

So we have a situation were 1% of the index was responsible for a majority of the rise, while half of the index is showing tremendous weakness.

The simple fact is the foundation of the stock market appears weak. We are not suggesting the economy is weak, or that stocks cannot move higher from here. But there is no question in our mind that the underlying base of the stock market is simply weak. And when selling occurs, prices can decline in a hurry.

What happens next?

A few things typically happen following a sharp decline like we saw today:

  1. Markets tends to have some sort of “follow-through”, meaning slightly lower prices are likely in the coming days.
  2. The follow-through declines occur more slowly. In other words, prices are marginally lower, but do not occur as quickly with such violence.
  3. Divergences occur. Selling pressure abates, and some degree of order returns.
  4. A bounce happens, and prices recover at least some of the decline.
  5. Prices move into a “Resistance Zone”, where the real battle between bulls and bears takes place.
  6. The trend appears. Either the previous uptrend reasserts itself, or we see a trend change into a weaker market.

We hope that the subsequent bounce that is likely to occur happens with the same velocity as the move lower. Unfortunately, it usually doesn’t happen that way. Instead, we tend to see the market drift higher to levels where many investors entered the market. Its at this level where the trend can better be analyzed (noted on the chart below in the “Potential Resistance Zone”.)

However, in some cases, the decline accelerates. This happened in early February of this year. From a statistical standpoint, this is a much more rare occurrence, but the potential damage from such a “crash” is much higher.

In the chart below, we point out a few key areas.

First, the market had been rising in a very well-defined trend channel since last spring, noted by the two blue parallel lines. Yesterday, the market tested the lower-end of the trend channel. This is very typical.

This morning, the trendline was broken, and sellers came out with a vengeance.

The important part now is to see if and when a bounce occurs, and most importantly how the market reacts following a bounce.


Fixed Income

The bond market had been showing signs of stress for most of the past two years. This stress has accelerated in the past 6 weeks, but higher rates are no surprise. Fixed income actually appears to moving into a more favorable position in our investment signals, and we would not be surprised to add longer dated bonds back into client portfolios in the coming weeks.


Bottom Line

We are taking a prudent and disciplined approach to this period of volatility. We hope the market continues to move higher, and hope we get signals to increase client exposure to risk. But as we’ve said before, hope is not an investment strategy.

We continue to monitor our market signals closely, and are prepared to both increase or decrease risk as warranted.

Invest wisely.

Disclaimer This presentation is for informational purposes only. All opinions and estimates constitute our judgment as of the date of this communication and are subject to change without notice. > Neither the information provided nor any opinion expressed constitutes a solicitation for the purchase or sale of any security. The investments and investment strategies identified herein may not be suitable for all investors. The appropriateness of a particular investment will depend upon an investor’s individual circumstances and objectives. *The information contained herein has been obtained from sources that are believed to be reliable. However, IronBridge does not independently verify the accuracy of this information and makes no representations as to its accuracy or completeness.

Filed Under: Special Report

  • Go to page 1
  • Go to page 2
  • Go to Next Page »

Footer

LET'S CONNECT

  • Email
  • Facebook
  • Instagram
  • LinkedIn
  • Twitter

AUSTIN LOCATION

6420 Bee Caves Rd, Suite 201

Austin, Texas 78746

DISCLOSURES

Form ADV  |  Privacy Policy  |  Website Disclosures

  • Home
  • Difference
  • Process
  • Services
  • Insights
  • Team
  • Clients
  • Form CRS
  • Contact Us

Copyright © 2017-Present by IronBridge Private Wealth, LLC. All rights reserved.