Negotiations on the debt limit are heating up in Washington.
What implications may it have?
In our view, negotiations are mostly political posturing by both sides trying to gauge the likelihood that the “other side” will ultimately be blamed from bad things that may or may not happen as a result of not raising the debt ceiling.
Unfortunately, this political grandstanding is all too common.
Regarding the debt ceiling, agreements have always been reached.
We have thought for many months that the risk of an actual default on U.S. Treasuries is very unlikely. Neither side benefits from this, and both sides are likely to be blamed.
However, politicians are gonna politic.
It appears that our fearless leaders want to sufficiently scare us in order to get their faces on the front page of every newspaper around the globe while we wait for them to announce an agreement.
But we digress.
In order to better understand the situation, let’s look at the history of the debt ceiling first, then look at the potential impact on financial markets.
Debt Ceiling Overview
The debt ceiling was first implemented in 1917 with the passage of the Second Liberty Bond Act.
This was done to fund the war effort during World War I.
The goal was to provide a limit to the amount of debt the U.S. government can issue via treasury bonds while keeping Congress fiscally constrained.
For many years, this worked.
But over the past few decades, the debt ceiling has done absolutely nothing to restrain spending.
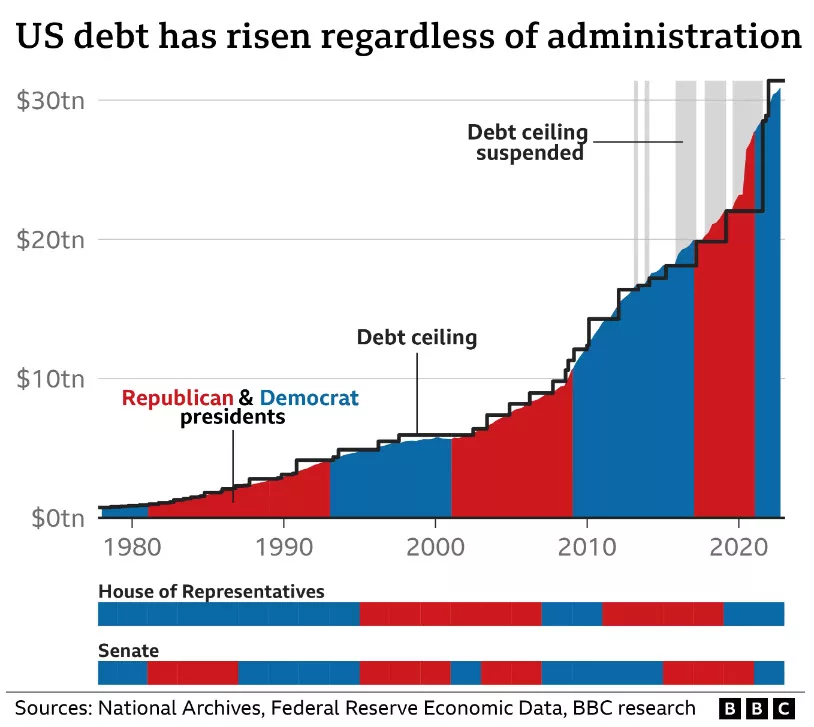
The chart below from the BBC shows the debt ceiling (black line) versus total outstanding federal debt. Republican presidents are shaded red while Democrats are blue.

It’s not hard to see that when debt reaches the debt ceiling, Congress simply raises it.
This is not a Democrat versus Republican thing. No one has fiscal restraint in Washington.
And despite “negotiating” spending limits nearly every time the debt limit is raised, there has been exactly zero reduction in spending during any administration, regardless of which party is in power.
We’ll discuss 2011 more below, but part of the deal to raise the debt limit then was that Congress projected over $2 trillion in savings over the next ten years.
What happened?
Debt increased by nearly $20 trillion.
Any talking points from a deal in 2023 is likely to be just that…talking points.
Previous deals to reduce spending failed. Why would this time be any different?
What are the potential market implications if a deal does or doesn’t get done?
Potential Market Implications
When looking at potential market implications with any type of event, it is most important to look at the actual data.
Since 1980, there have been 74 debt limit increases.
Only one of them truly resulted in major market volatility: 2011.
The vast majority of the time, the debt limit does not have any meaningful impact.
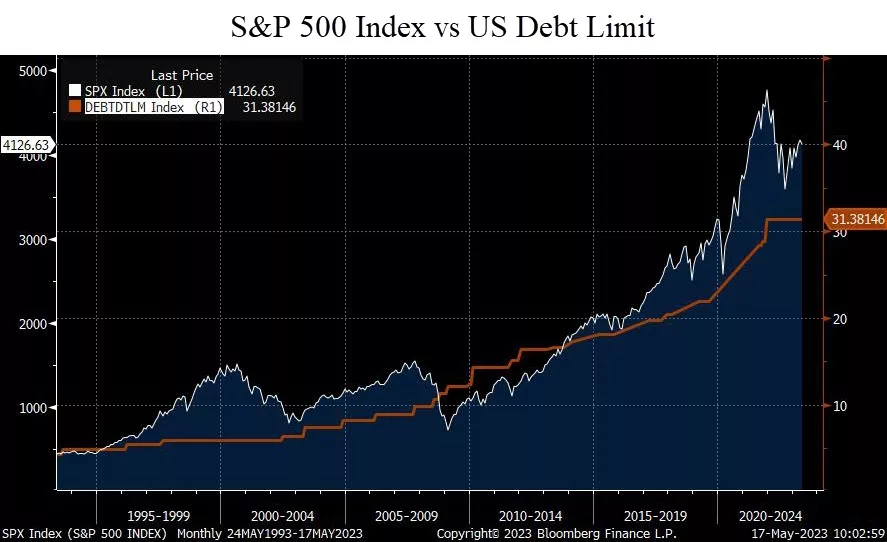
The next chart looks at the S&P 500 versus the statutory debt limit.

The orange line is the debt limit and the white line is the S&P 500.
It’s pretty easy to see that periods of volatility did not necessarily correlate to debt increases:
- During the tech bubble, the debt limit remained flat. This was also the last time Washington was fiscally conservative.
- The debt limit was increased in 2008, but that obviously was not the cause of the financial crisis.
In fact, you could argue that the markets and the debt limit are positively correlated. This means that when the debt limit goes up, so does the market.
As we mentioned earlier, the only real exception was in 2011.
What happened to asset prices then?
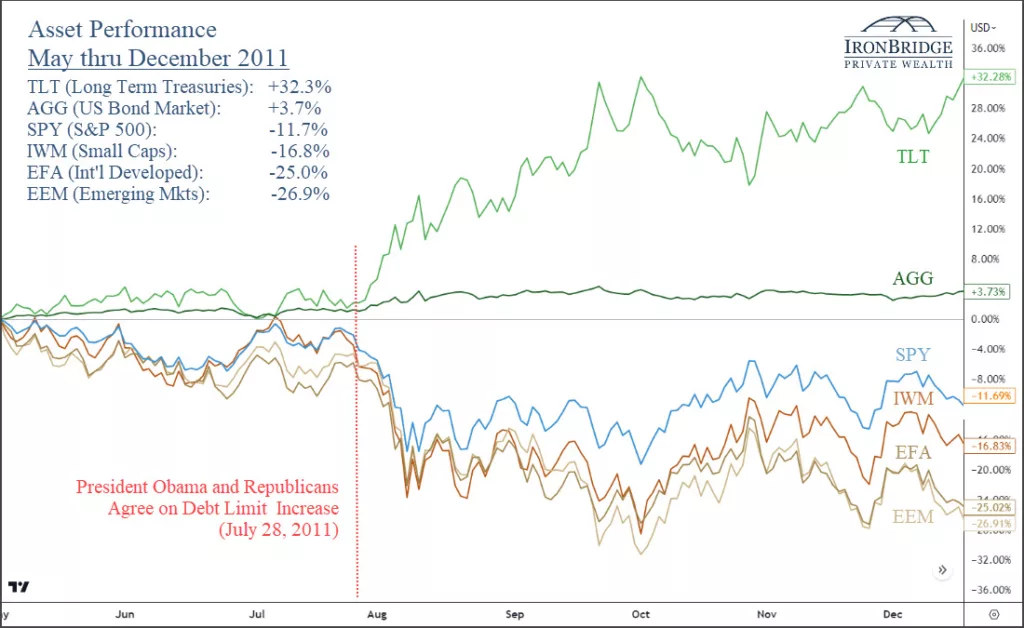
The next chart shows performance of various assets during and after the debt crisis in 2011.

This chart shows asset performance from May through December of 2011, and includes long-term treasury bonds, the broad bond market, large-cap stocks, and small-cap stocks, developed international stocks, and emerging market stocks.
The vertical red dashed line is the date when President Obama and Congressional Republicans finally agreed on an increase. At the same time, U.S. debt was downgraded from AAA to AA for the first time in history.
A few interesting observations from this chart:
- Volatility didn’t start until AFTER an agreement was reached.
- Ironically, the best performer by far was long-term U.S. treasury bonds.
- International stocks performed the worst, with developed and emerging markets both down over 25% through year-end.
- The S&P 500 index was down 12% in the months following the debt increase.
The other thing to note about 2011 is that the Fed ended QE2 in July of 2011. So there was a natural headwind from reduced Fed liquidity at the time of this volatility.
There are similarities between then and now:
- Republicans won a mid-term election the year before.
- The Fed is in tightening mode.
- Political divisiveness is high.
Maybe we see a replay of the 2011 situation.
We hear many pundits saying that treasury bond prices will plummet if a deal isn’t reached. Others are saying that markets will crash.
But probabilities suggest otherwise.
Like most political events, this one is likely to have a very short-term effect on markets.
Bottom Line
By all indications, a deal to raise the debt ceiling is close.
But even if it extends out another few weeks, the likelihood that the U.S. defaults on its debt payments and a global catastrophe follows is extremely low.
Any reaction by financial markets, whether positive or negative, is likely to be temporary.
After that initial reaction, markets will go back to looking at data as if nothing happened.
Right now, data is extremely mixed.
Economic indicators are weakening, but overall, the stock market has remained very calm.
As we’ve said for months, risks from an economic standpoint remain very high. This week alone, JPMorgan and Goldman Sachs both announced that a recession this year is highly likely. We agree.
Without question, volatility will increase if negative economic events occur.
But don’t expect the debt ceiling to be culprit.
Invest wisely!