The Federal Reserve met today and increased interest rates by 0.75%, as expected.
Stock markets were volatile all day, and ended up down almost 2%. So maybe it wasn’t so expected after all.
As we have consistently said in communications over the past few months, risks are very high right now.
Today didn’t do anything to change that in either our signals or our minds.
We’ll keep it short and to the point today, and let charts do most of the talking, but let’s do a brief portfolio update first.
Portfolio Update
Client portfolios are VERY conservative.
We have continued to reduce equity exposure in all portfolios, and we have added equity hedges to portfolios as well.
If markets continue to fall, your portfolio should remain very stable. We cannot eliminate risk, so there will always be fluctuations. But we have minimized those to properly handle the current environment.
We firmly believe this to be the proper course of action at this point.
As always, markets can change. If we get signals to increase risk, we will not hesitate to do so.
Yield Curve
The Yield Curve remains inverted. This means that short-term rates are higher than longer term rates. The yield curve is more inverted than it has been in almost 50 years.
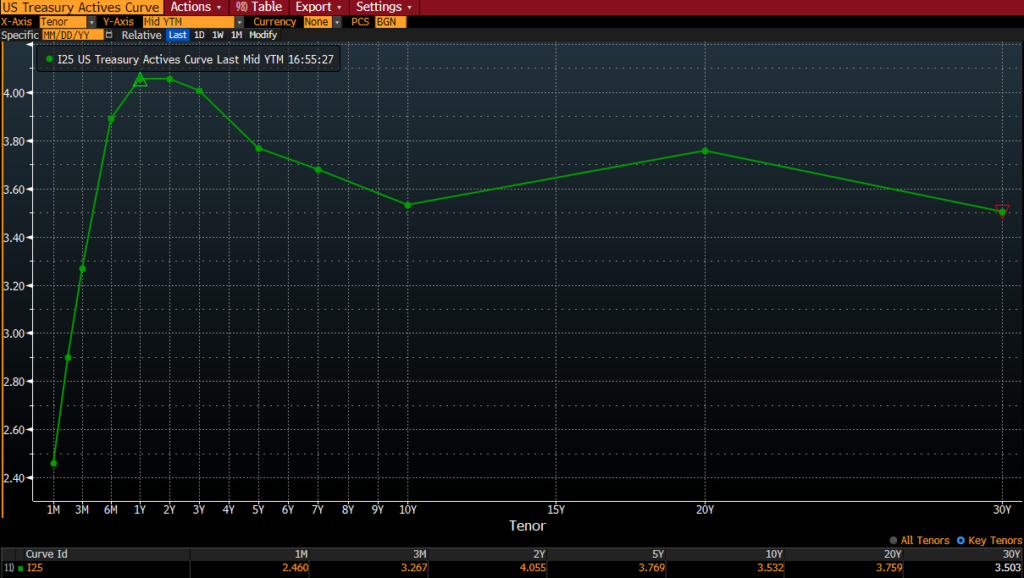
Why does the yield curve get inverted in the first place?
There are two main reasons:
- Short-term rates are mostly set by the Fed. They have been steadily increasing rates all year.
- Longer-term rates are set by the market. When there are concerns about economic weakness, money flows into longer-term treasury bonds.
Longer-term yields have been relatively stable the past few months, while short-term rates have risen dramatically.
Inverted Yield Curves Lead to Recessions
As we have mentioned numerous times this year, an inverted yield curve has been an excellent indicator of recessions.
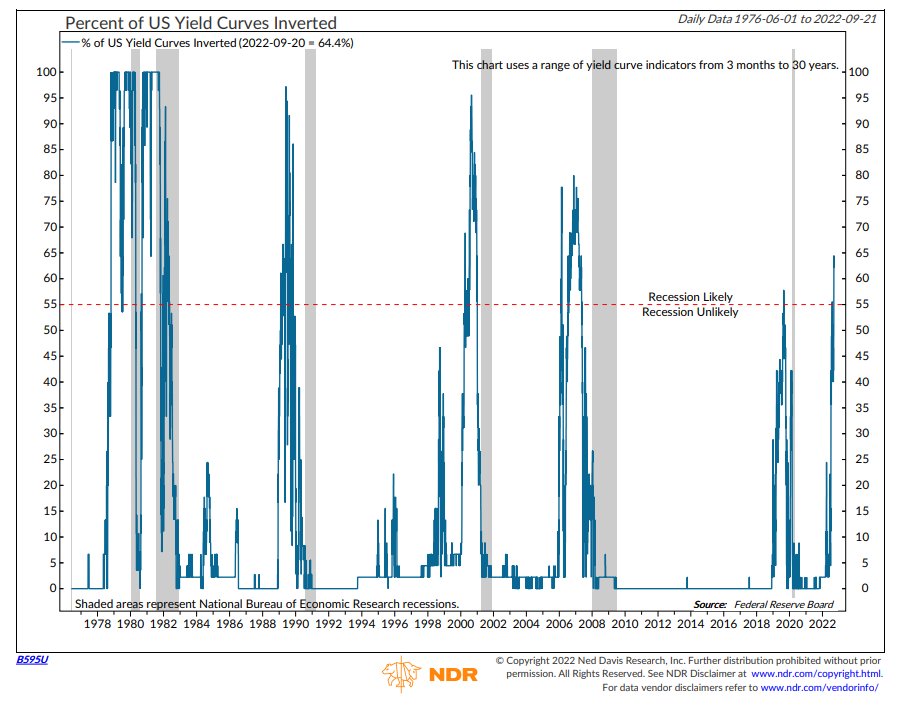
The next chart shows the percentage of the yield curve that is inverted (blue line), with recessionary periods in gray.
The percentage of the yield curve that is inverted simply looks at various maturities and counts whether the short-term rate is higher than the long-term rate. (3-months vs 2-years, 3-months vs 5-years, etc.)
When more than 55% of the yield curve becomes inverted, it has ALWAYS preceded a recession. We are now at 65% of the yield curve that is inverted.
The Fed’s Dot Plot
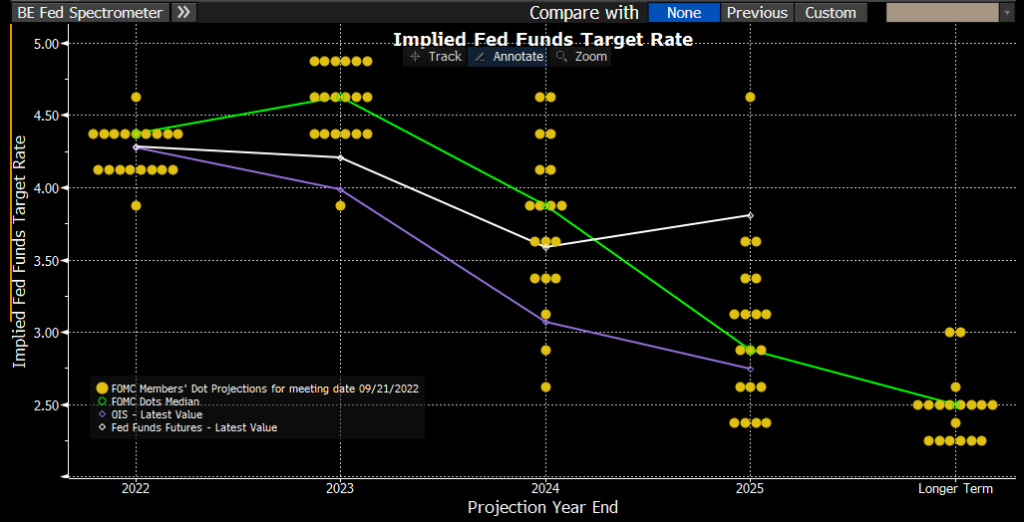
This is a bit of a complex chart, but it shows how each member of the Federal Reserve Committee sees future interest rates.
This shows that the majority of Fed members believe they will hike rates to somewhere between 4.5% and 5.0%. The target rate is currently 3.00-3.25%. (They use a 0.25% range when setting the Fed Funds rate).
So we can assume that there is likely another 1.50-2.00% of interest rate increases to come. This would likely be another 0.75% at the next meeting in October, followed by slightly decreasing hikes (0.50% then 0.25% at the following two meetings).
Things can change, but this is a good gauge of their thoughts.
It is also interesting to note that almost every Fed member is then projecting rates to fall in 2024 and beyond.
When has the Fed Stopped Hiking Historically?
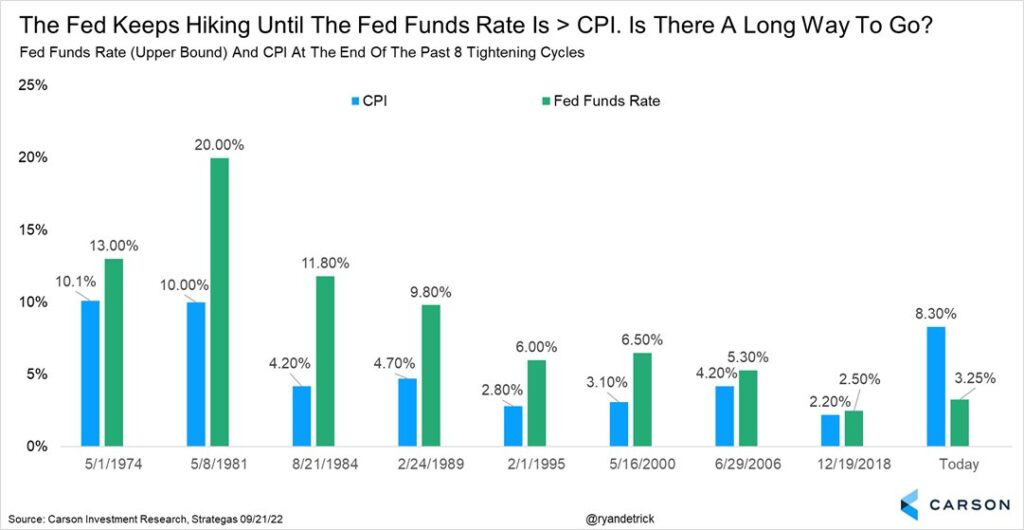
Historically, the Fed stops raising rates when the Fed Funds rate gets above the inflation rate. There may be some time to go before that happens.
Bottom Line
Today’s developments do not surprise us.
The Fed has been crystal clear about wanting to slow the economy, slow wage growth, and remove speculation from markets (meaning lower stock and home prices).
They re-emphasized that today in no uncertain terms.
The Fed wants prices to fall. Don’t fight them, you won’t win.
The downside scenarios are large enough that it still makes sense to reduce risk if you haven’t done so already.
As always, please do not hesitate to reach out with questions or to review your individual circumstance.
Invest wisely!