Successful investing over time comes down to one thing: markets work in cycles.
In this issue we take a deeper dive into a topic we discuss relatively frequently, but one that is not addressed as much as it should be in the investment world…the idea of cycles. Once we get comfortable with one key claim, that the markets are cyclical rather than linear, we can then get comfortable with having an investment strategy that adjust to cycles. Not only that, but we argue that recognizing that markets work in cycles is THE most important factor when developing and executing an investment plan.
Specifically, we discuss the following topics below:
- Stocks & Cycles
- Missing the 10 Best Days vs 10 Worst Days
- Stocks & Gold
- Stocks & Inflation
- Stocks & GDP
Market Update
We’ll dig more into recent market developments in our next issue of IronBridge Insights, but wanted to pass along a very brief summary of the markets.
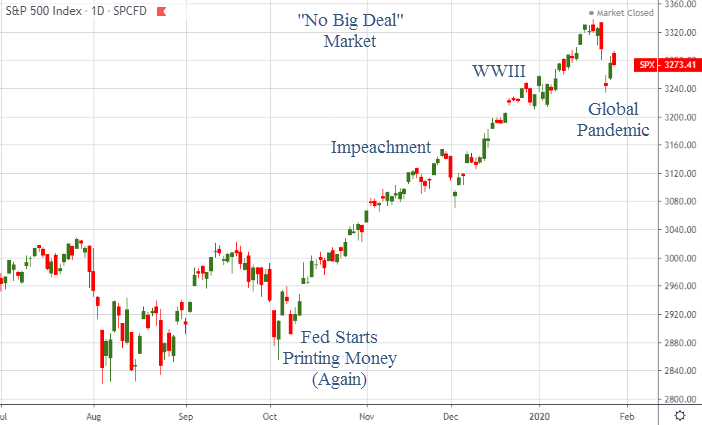
Bottom line, the stock market continues to ignore any sort of bad news. Since last October, markets have been incredibly strong with very little volatility. The primary catalyst is most likely the fact that the Fed started printing money again late last September. And the market has gone straight up since then.
Despite threats of World War 3, impeachment proceedings, and the recent threat of a pandemic virus sweeping the globe, markets have been resilient. Earnings have been positive for the most part, and there have been no major surprises economically. Essentially the market has been saying “No Big Deal” to every potential downside catalyst.
The move higher will not go on uninterrupted, and we expect volatility to rise and markets to become choppier than they have been.
However, our clients continue to participate in this move higher, and we are holding very little cash exposure, as has been the case for the past 4-5 months. Our signals continue to show strength, and only as recently as last week have we seen any remote type of weakness show up in our signals.
Bigger picture, the move higher does not appear over. While we do expect increased choppiness, and are prepared for a deeper move lower, signs of strength far out-weigh any signs of weakness. At least for now.
“The whole history of life is a record of cycles.”
-Ellsworth Huntington (1876-1947), Professor of Geography, Yale University
Are Markets Cyclical?
At the beginning of every year we like to take a step back in an attempt to see the proverbial forest through the trees. In this issue we focus on the macro with a goal of identifying where we are within an investment cycle.
One of the most important building blocks on an investment strategy is having an idea where you are within a cycle. It should be a huge input on how you invest.
Unfortunately, for most people (and investment firms) this concept is never even considered. And if even when it is discussed, there is no real action taken as a result.
Why is the investment cycle important?
Most individuals have 20-30 years to invest once they have accumulated their wealth. Some longer, some shorter. Over the course of most people’s lives, they spend the first 20 years learning, the second 20 years earning, the third 20 growing, and the final 20 spending.
The problem is that most investment strategies are based on theories that work only if you have an incredibly long time frame to invest…like 100 years or more. With ultra-long-time-frames, the downside of ignoring investment cycles aren’t as punitive. It isn’t as efficient as adapting to cycles, but it isn’t as punishing either.
The most common basis for investment strategies today is called “Modern Portfolio Theory” (learn more about it HERE.) The creator of this theory, Harry Markowitz, won a Nobel prize for it.
Nearly every large investment firms, and most smaller ones as well, base their entire investment philosophy on this theory.
Unfortunately, it doesn’t work unless you have ultra-long-time-frames. Even Mr. Markowitz himself said that this shouldn’t be used for individual investors. He suggested that its use should be limited to institutions like university endowments and life insurance companies that have 100-year-plus investment horizons.
Today’s growth of passive investing and indexing is an extension of Modern Portfolio Theory, and is also incredibly flawed.
Its theory is based on the falsehood that stocks (and bonds) always do well over the long run. While it can work for many years in a row, history shows us that there are very long periods where markets do not consistently go up.
If investment decisions are made based on poor data/inputs (in this case, that markets always move higher), then any good results that may come of them are pure coincidence or based on luck rather than being skill based.
Let’s say you’re on the golf course, and use your 9 iron to hit a shot from 130 yards away. But instead of a crisp, well-executed shot, you instead duff it and hit the ball just 90 yards…but it bounces off the cart path and rolls up next to the hole.
The outcome was good. But was that skill or just luck?
We would say it was lucky because you were trying to hit a 130-yard shot.
We think index investing is no different. Those practicing it believe in one key concept, that the market “over the long run” will always go up. In our opinion investors are making a grave mistake if they think this passive investing strategy is their saving grace. At best, they will be lucky and catch the markets at the right time. At worst, they will be exactly wrong at exactly the wrong time and suffer badly.
At IronBridge we make our investment decision based around one concept that we hold as truth, that the markets are indeed cyclical.
If this is not true, then the way we invest could be flawed, and if so then the passive investors who are grounding their theories in the opposite, that the market is linear, will be the ones who prevail.
So, in order to figure out the better direction to take, active or passive, let’s first prove the cyclicality of markets. If we can all agree that the markets are cyclical, then we can move on to investment strategies that take this into account.
If we cannot agree on the cyclicality then we must go back to the drawing board and admit that passive investing may be as good a strategy as any.
Stocks & Cycles
First, let’s start at the highest level. What is a cycle? Cycle is defined as a series of events that are regularly repeated in the same order. Cycles that are generally agreed upon are the lunar cycle, the solar cycle, the life cycle, and the business cycle.
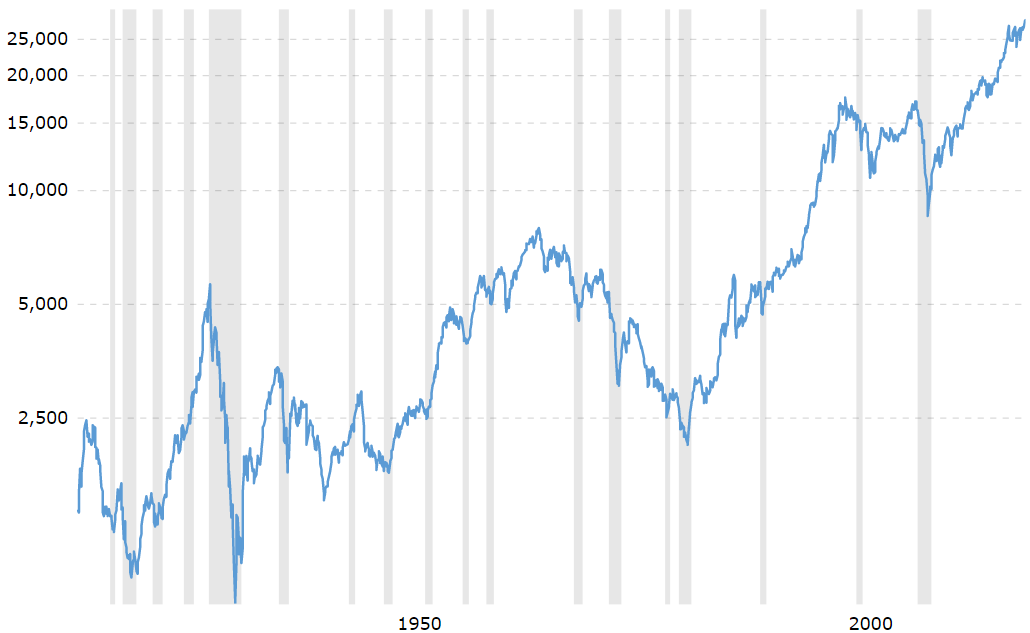
The chart of the Dow Jones index below shows this cyclicality in markets.
The Dow Jones Industrial Average (100 Years)
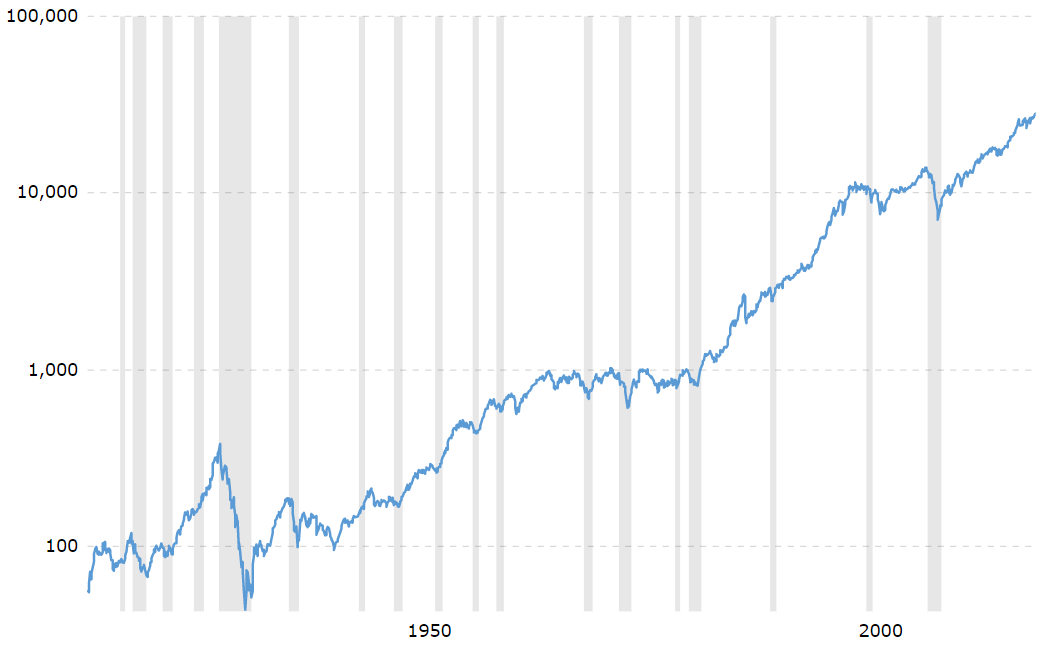
Generally, there are large periods of time when price is moving up and to the right (a time to be fully invested), but those periods have been interrupted, sometimes for long periods themselves, by sideways or down movements (a period not to be fully invested).
Overall the equity markets seem to have periods of 20-30 years of generally upward moving stock prices followed by typically shorter, 15-25 years, of falling stock prices.
There have been 4 major stock market up-trends and 3 major stock market drawdowns over the last 100 years. The first major drawdown started in 1929 and took until 1954 (25 years) for prices to make new all time highs again. The last 100 years shows a roughly generation cyclicality to the markets.
But how long is “long term” to you? Is 25 years long term to you? Could you imagine investing your entire net worth during the roaring twenties only to have to wait for 20+ years just to get back to breakeven? That’s almost a lifetime! On the other hand what if you just waited a few years and instead invested in 1932? In this example the cycles of the market affected outcomes vastly differently.
The second long period of negative cycle occurred from 1966 to 1982 (16 years). On the chart it may not look like much, but there were three 50%+ drawdowns during this period. Avoiding even a portion of this period would have provided significant outperformance.
There’s a case to be made that we just finished a 3rd period of negative cycle from 2000 to 2015, with two similar 50%+ drawdowns. Generally, though, there have been long periods of good times for investing, but there also have been long periods of bad times for investing, and where you started your investing “career” matters greatly to your results.
Missing the 10 Best vs 10 Worst Days
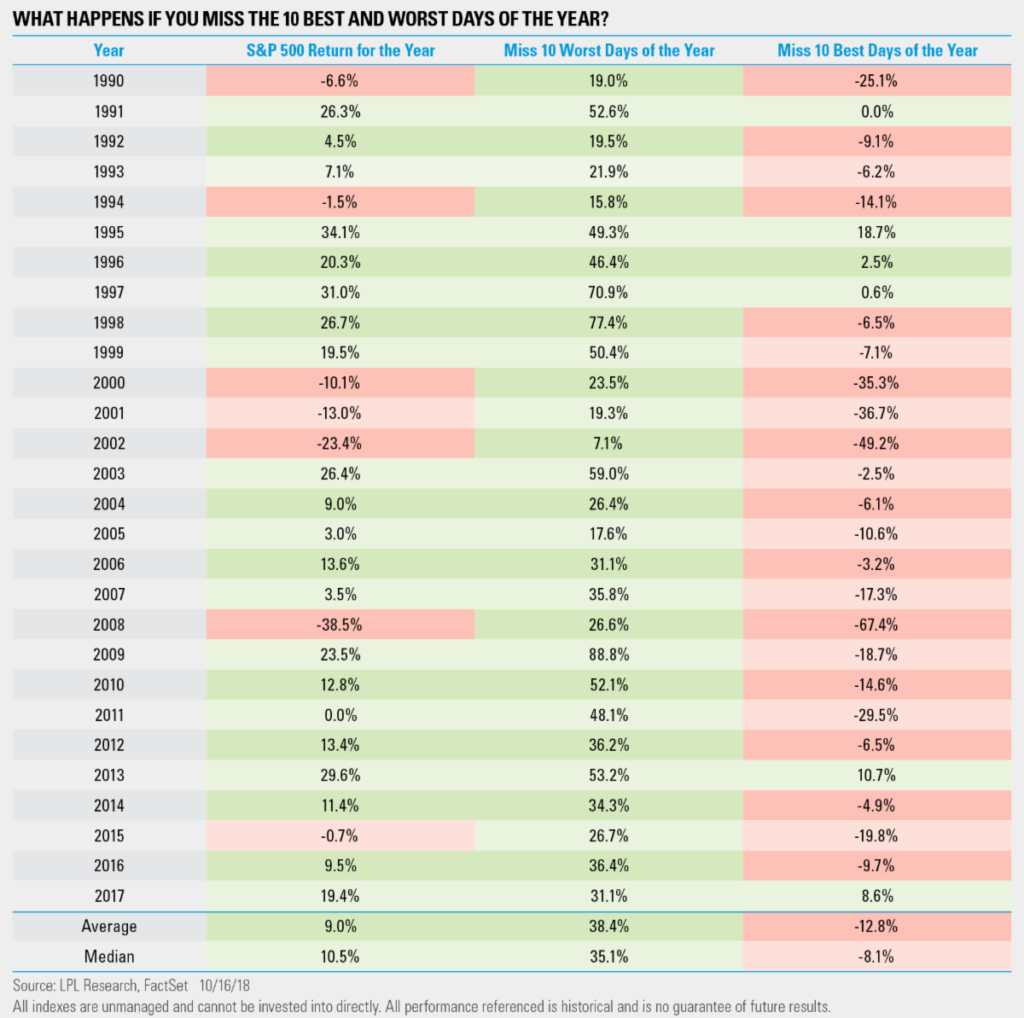
One narrative purported by the investment industry is that if you miss the 10 best days in the market your investment results would be greatly negatively impacted. This is indeed true.
But they are (purposely) leaving out an equally important second half to the equation.
If you miss the 10 worst days in the market you substantially outperform. In fact, the amount of outperformance by missing the 10 worst days is much better than the outperformance of getting the 10 best days.
The table below (from LPL) shows if you avoided the 10 worst days each year from 1990 to 2017, your average return of the S&P 500 would be an extremely impressive 38.4%, outperforming by and hold’s 9% by 29.4%. Compare that 29.4% difference to the difference between the 9% buy and hold return and the -12.8% average loss if you missed the best days. -12.8% to 9%=21.8% while 9% to 38.4%=29.4%. It’s far better to miss the worst days than it is to miss the best days.
This “10 best days” quote is the biased narrative attempt at convincing you that “over the long run”, the market goes up more than it goes down and that trying to “time” it and be out during those periods of drawdown is a futile attempt.
However, the facts reveal that the 10 worst days each year do much more harm than the 10 best days do good. In addition, “long term” is a biased term with no substance. You need to define your timeline in order to truly appreciate the cyclical implications.
Another reality is if you can avoid drawdowns, you should (we know, easier said than done, right).
But are drawdowns random?
The table above also helps show that generally the biggest drivers of this disparity between the good days and the bad days occurs during periods of volatility.
The average disparity is 51.2% (38.4% average year outperformance +12.8% average year underperformance=51.2%). The periods where this variance is large are generally during those periods of cyclical market drawdowns and increased volatility (Year 1999 = 50.4% + 7.1%=57.5%, Year 2000 = 58.8%, Year 2001 = 56%, Year 2008 = 96%, Year 2009 = 107.5%, you get the picture).
Not only is it better for your portfolio to miss the biggest down days more so than it is to be in the market for the biggest up days, but during those periods the market is in a cyclical drawdown is typically when the largest disparities occur, and, thus, the potential for more outperformance can occur. This makes sense as those who have been in the industry through a full cycle know that volatility is generally more present during drawdowns than it is during meltups. Stock Market crashes happen much quicker than market tops as an example.
So, if we know we want to avoid the down days the most, and the disparity between the up days and the down days is the greatest during market drawdowns, then there is certainly a case to be made to try to avoid those periods where the odds are greater for down days. If we can prove that the market is cyclical then it gives us a base for trying to avoid those periods of drawdown. Again, getting grounded in the fact that the markets are cyclical is an essential step in building an investment strategy “for the long term”.
Stocks & Inflation
Looking only at charts of stocks that only focus on price ignores one of the biggest hurdles to investing success…inflation.
The next chart below shows 100 years of the Dow Jones Industrial Average, the same as the previous Dow chart, just this one is adjusted for inflation (using the CPI).
The Dow Adjusted for Inflation (CPI)
It’s pretty clear that there are times the Dow is moving up and times it is moving down, even more so when we adjust for inflation. This up and down motion makes it cyclical by definition. If the Dow moved only up and to the right, then it would be non-cyclical, but to us it is pretty clear it moves in cycles.
Sometimes it outperforms inflation; other times it does not. If it wasn’t cyclical then it would outperform at all times, and that simply is not the case.
This chart confirms the 3rd period of underperformance discussed above, from 1999 to 2008. It shows the uptrend in stocks versus inflation is also now back in vogue. Is this the start of a new up cycle? Those periods have been as short as 10 years and as long as 19, so we are already in the sweet spot for longevity, but even during these periods of uptrends there were substantial drawdowns over shorter periods.
This introduces the concept of over the “intermediate term” and refers to the fractal nature of the markets. There are cycles within cycles, such as generational cycles, intermediate term cycles, business cycles, and/or the presidential cycle.
Do you want a strategy that performs well over the “intermediate term” or just over the “long term” or both? The reality is most investors want a strategy that performs well over the short, intermediate, and long terms, and in order to even attempt at providing this, one must agree that cycles indeed exist and stocks do not just go up and to the right!
The Dow is adjusted for inflation in order to help take out of the equation another variable, the value of the U.S. Dollar. The U.S. Dollar has been devalued by the issuance of money throughout its history, resulting in inflation (and its own cycle). Therefore to get a cleaner look at an asset it can often be beneficial to change the denominator.
Stocks & Gold
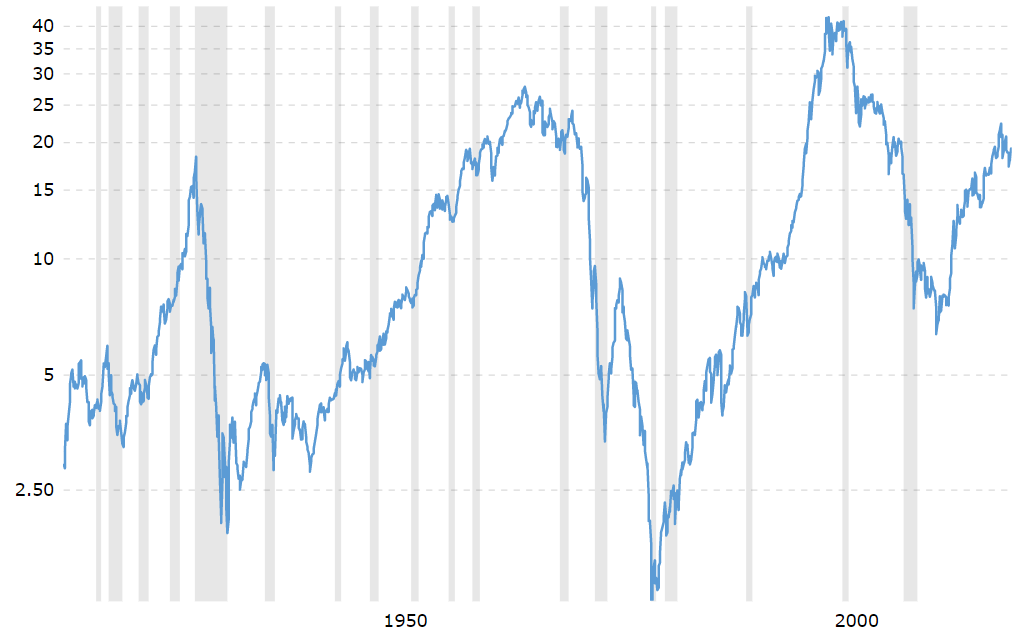
One way to do this is to use CPI, another is to use the price of Gold. By taking the Dow and dividing by the Price of Gold, the U.S. Dollar is completely taken out of the equation. And, if gold is assumed a proxy for inflation, then inflation is also taken out of the equation.
That chart is shown below and also reveals an even more long term cyclical nature of the equity market. The drawdowns here are absolutely massive as are the periods of equity outperformance. Could you imagine the performance of a portfolio that moved into equities during the uptrends and moved into gold (or a safe-haven such as cash), during times of cyclical drawdowns?
The Dow Priced in Gold
The most interesting thing to us about this chart is the Dow’s price today compared to Gold, at around 18x, is the exact same as it was at the peak of 1929. In other words if you owned an ounce of gold in 1929 it would be worth exactly the same as if you bought the Dow at that time and held them both for 90 years. Extraordinary!…or you could have not bought the Dow in 1929 at 18x the price of gold and waited until 1932, when it was just 2x the price of an ounce of gold. The point being, the cycle affected a static portfolio’s results massively.
We use this chart more to prove the cyclicality that does indeed exist in the markets, but it sure is interesting to look at the Dow priced in other assets than the U.S. Dollar. This chart shows even further the cyclical nature of the markets and how when you make an investment decision, where you are in the cycle is absolutely crucial to your potential return. For better or worse, the cyclical nature of the market demands you pick the correct time to invest “for the long term”.
Stocks & GDP
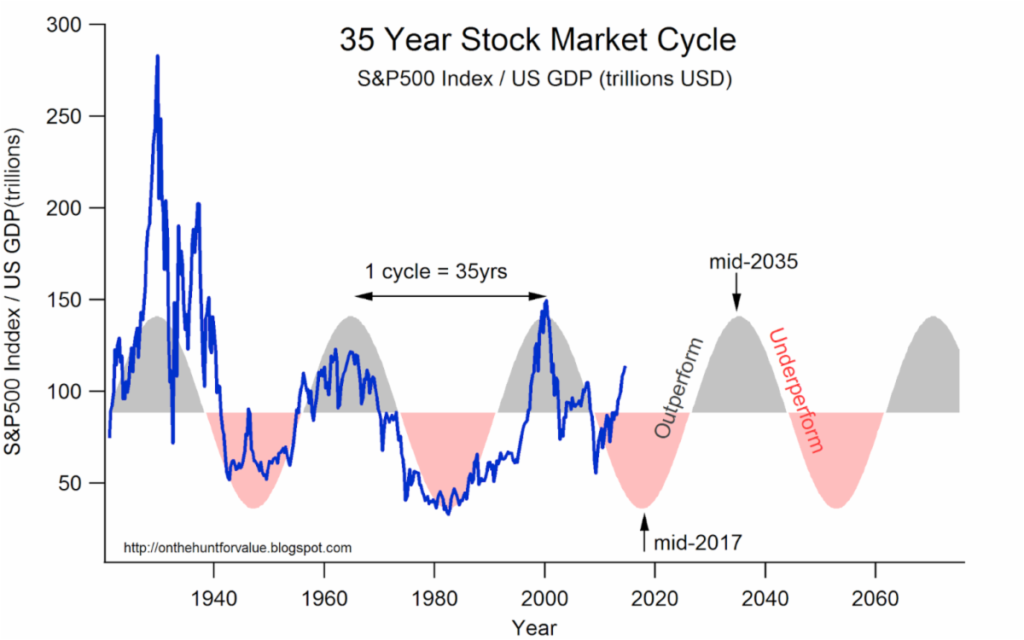
Finally, the stock market moves quicker than U.S. GDP and historically has gone through incredible over and under valuation periods. Currently the S&P’s total market value is around 125% of U.S. GDP, which is expected to be around $21.2 Trillion. The S&P 500 is valued at around $25.6 Trillion today. Small businesses, government, and other non-publicly traded companies are also reflected in the GDP indicator which is one reason why Warren Buffett likes to use it as his gauge of where the markets are within an investment cycle. The “Buffett Indicator” also shows the cyclical nature of the markets historically. Historically, a reading over 90% (the S&P 500 is valued at 90% or more of GDP) in this indicator suggests overvaluation. Extremes have historically been hit near current levels as the 1960s saw a peak around 125% while the year 2000 ran to 150%. The 1940s, 1950s, and 1980s saw troughs around 50% S&P 500 value to GDP.
From a generational perspective, are we to expect the next 30 years to be robust, modest, or negative? Who knows, but what we do know after looking at these charts (and thousands of other charts of history) is that the markets indeed are cyclical, and they are cyclical at multiple different time frames. Within generational cycles there are smaller, multi-year cycles, and within those cycles there are even smaller cycles. This market to GDP chart shows a roughly 15 year peak to trough cycle (7 extremes in 100 years).
Agreeing there are cycles in the market is a necessary first step in building an appropriate investment strategy. Hopefully you agree with us that cycles indeed exist. If not, you may find a passive investment strategy appropriate (but please know our door is open when it’s time to look at something different).
The S&P 500 as a % of US GDP
Do you know what your advisor thinks about cycles and how they will respond to the changing of them? We know what we think about them and have built strategies to properly navigate them as they arise.
Invest Wisely!
Our clients have unique and meaningful goals.
We help clients achieve those goals through forward-thinking portfolios, principled advice, a deep understanding of financial markets, and an innovative fee structure.
Contact us for a Consultation.
Neither the information provided nor any opinion expressed constitutes a solicitation for the purchase or sale of any security. The investments and investment strategies identified herein may not be suitable for all investors. The appropriateness of a particular investment will depend upon an investor’s individual circumstances and objectives. *The information contained herein has been obtained from sources that are believed to be reliable. However, IronBridge does not independently verify the accuracy of this information and makes no representations as to its accuracy or completeness. Disclaimer This presentation is for informational purposes only. All opinions and estimates constitute our judgment as of the date of this communication and are subject to change without notice. > Neither the information provided nor any opinion expressed constitutes a solicitation for the purchase or sale of any security. The investments and investment strategies identified herein may not be suitable for all investors. The appropriateness of a particular investment will depend upon an investor’s individual circumstances and objectives. *The information contained herein has been obtained from sources that are believed to be reliable. However, IronBridge does not independently verify the accuracy of this information and makes no representations as to its accuracy or completeness.
