Men’s courses will foreshadow certain ends, to which, if persevered in, they must lead,” said Scrooge. “But if the courses be departed from, the ends will change.”
charles dickens, “A christmas carol”
In Charles Dickens’ famous book, A Christmas Carol, Ebenezer Scrooge begins the story as a mean-spirited and angry old man.
But he undergoes a transformative experience that changes him into someone who cares for others and embraces the spirit of giving.
The quote above by Mr. Scrooge is not the easiest quote to read.
If we paraphrase it, it may read something like this:
“If you go down a dangerous path, bad things will probably happen. But if things change, they might not be so bad after all.”
Currently, equity markets are trying to show more of a giving spirit like that of the transformed Scrooge.
But there are still MAJOR macro-economic signals with a grumpy, “old-Scrooge” like demeanor.
But will they will turn into positives in the coming months?
Grumpy Scrooge
First, let’s look at the more concerning indicators.
Specifically, there are three data points worth watching that are showing elevated risks for 2023:
- The Inverted Yield Curve
- Leading Economic Indicators
- Money Supply (M2)
These indicators tend to be excellent predicters of recessions when they turn negative.
And right now they are VERY negative.
Inverted Yield Curve
The yield curve is simply what a specific investment instrument yields at different maturities.
To understand the current yield curve environment, think of it like this:
Let’s say you want to invest in a Certificate of Deposit at a bank. You speak to a banker, and ask for the rates on a 2-year CD and a 10-year CD.
Logically, you expect the 10-year CD to be at a higher interest rate. You are, after all, committing funds to the bank for a decade.
But the banker tells you that the 2-year rate is paying 4.6%, while the 10-year rate is only 3.8%. This is an “inverted” yield curve.
When the yield curve on US Treasuries inverts, it has been the single best predictor of a recession in the past 100 years.
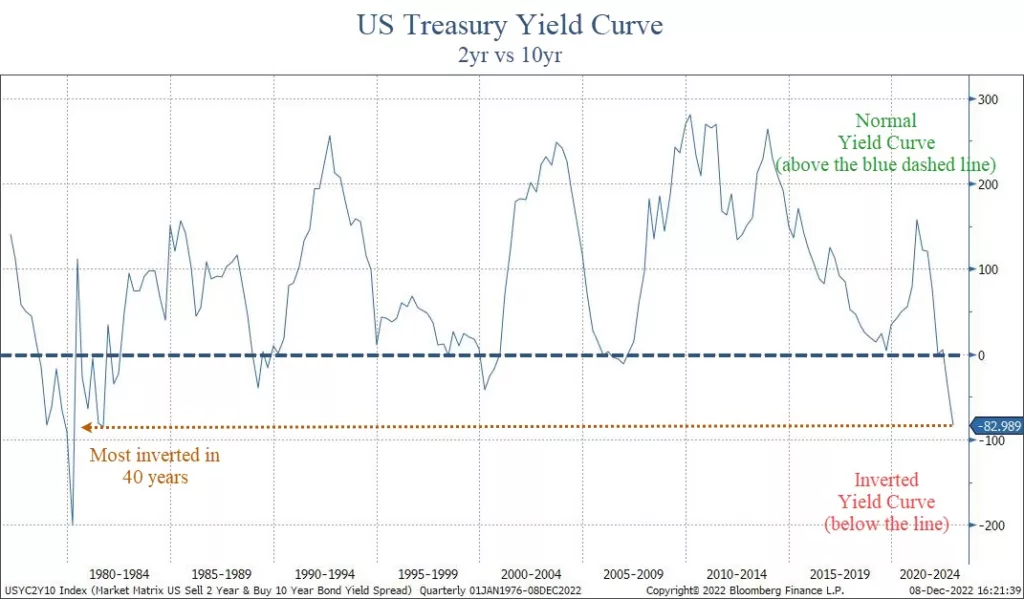
Right now, the yield curve is more inverted than anytime in the past 40 years.
The chart below shows the difference between a 2-year US Treasury bond and a 10-year one.
When the line is above zero, the curve is “normal”. Below zero and it is “inverted”.
The past three times the yield curve was inverted was in 2008, 2000 and 1987. It became inverted before the markets had extreme stress, and each time led to a recession and tremendous market volatility.
This chart above only goes back to the 1970’s, but it’s the same well before that as well.
The depth of this inversion is worrisome too.
At roughly 0.83%, this is a very steep inversion, and one that is signaling not just a recession, but a deep one.
Leading Economic Indicators
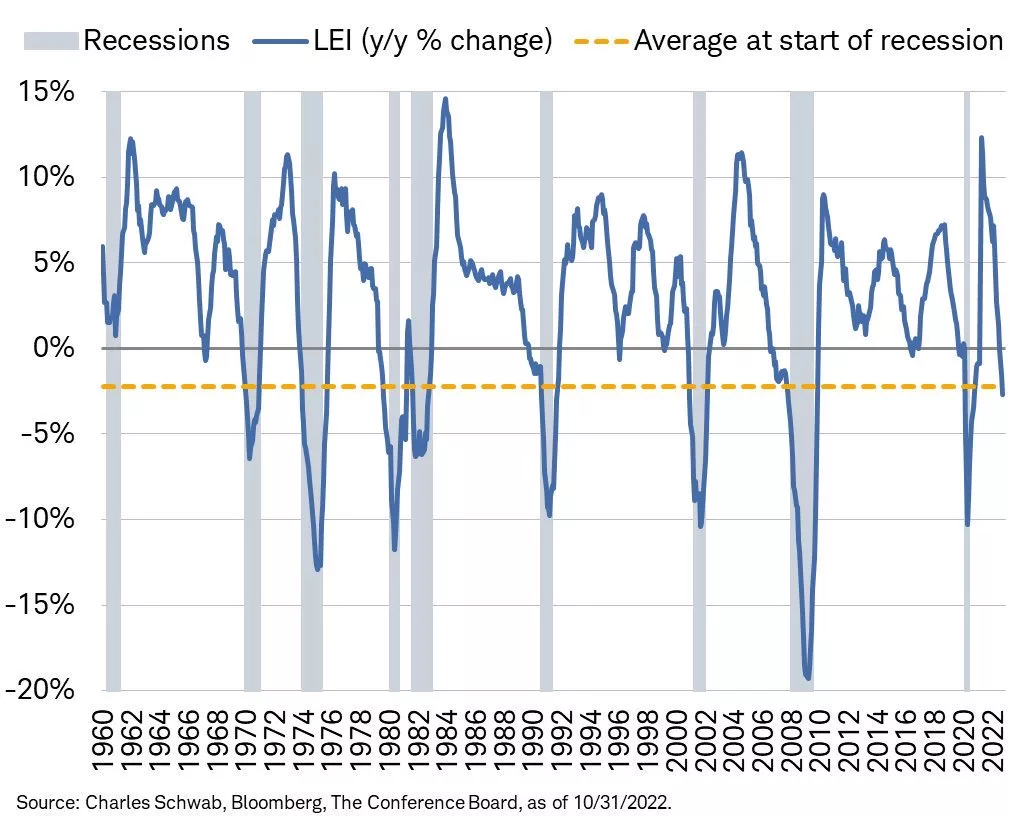
Another key data point to monitor is the Leading Economic Indicator Index (LEI). We discussed this in our Thanksgiving report (read it HERE).
The LEI is another excellent recession predicter.
It’s so good, in fact, that EVERY time in the past 70 years we’ve seen the LEI at these levels a recession has followed.
The chart below, courtesy of Charles Schwab and Bloomberg, shows that the negative LEI is below the average level where recessions begin.

LEI is telling us that a recession is imminent (unless this time is different, which is a dangerous assumption in financial markets). But LEI is not a good timing tool…it does not tell us when a recession might begin.
It only tells us that one is close.
And the rate of change does in fact suggest that a recession is likely to be worse than “mild”.
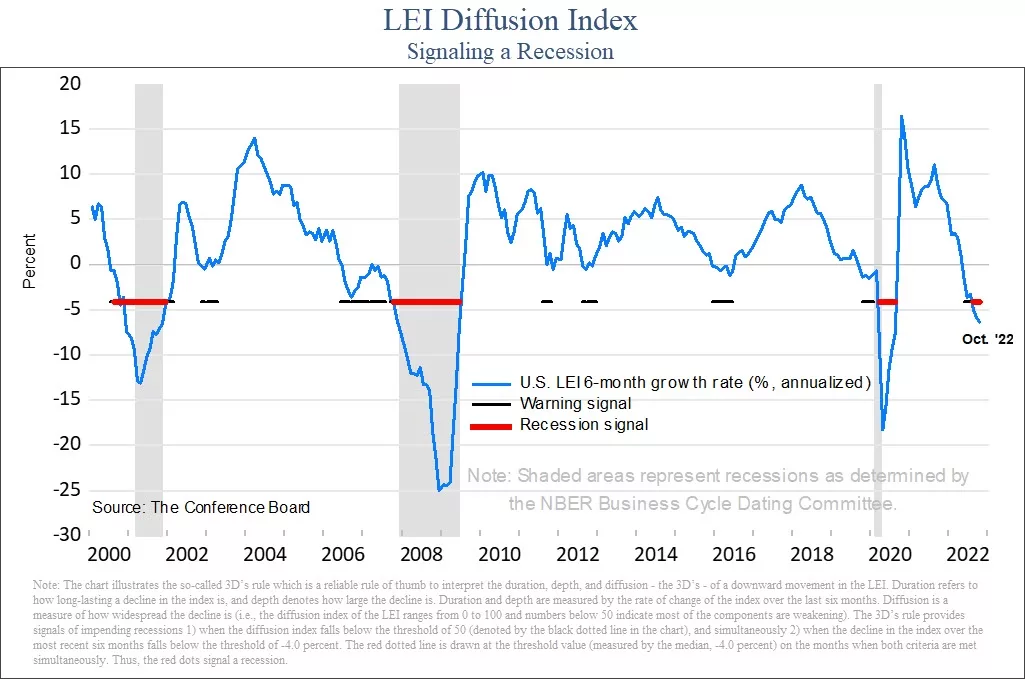
Another way to look at LEI is to look at the diffusion of the data.
Diffusion measures how widespread any strength or weakness is within the data. In the next chart, the diffusion index ranges from -50 to 50. A reading below zero tells us that the majority of the data is weakening.
When the diffusion index is below zero, it is indicating that a majority of the underlying data is weakening. A reading above zero tells us the opposite, that most data is improving.
When the diffusion goes below zero, it is a warning sign that economic trouble could be happening. But a recession has not followed every time diffusion has turned negative.
Only when the index gets to minus-4 has it signaled that a recession is imminent. The index is currently at minus-6. This is another excellent predicter of a recession, and it tells us that one is very likely to occur in 2023.
Money Supply (M2)
Another important, but little discussed aspect of financial market performance is the money supply.
There are various ways to measure the overall supply of money in a society. One of the broadest definitions is called “M2”. It measures the total amount of liquid funds in cash or near cash within a region.
This number includes cash, checking deposits and non-cash assets that can easily be converted into cash, like savings accounts and money markets.
If you’d like to learn more about M2, Investopedia has a nice article about it HERE.
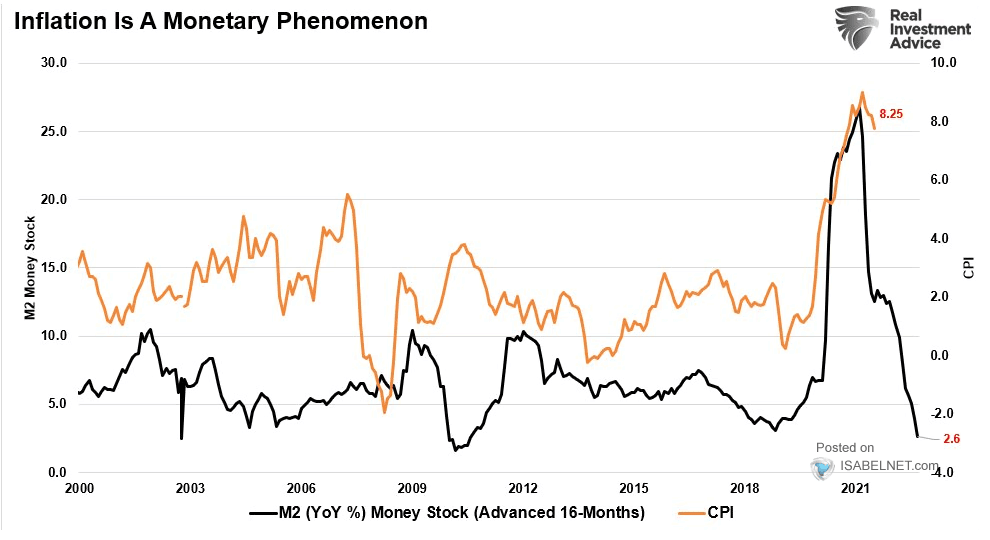
M2 has a very high correlation to inflation. More accurately, changes in M2 have a very high correlation to inflation.
The next chart shows this phenomenon, courtesy of our friends at Real Investment Advice in Houston.

The black line is the year-over-year change in M2 (moved forward 16 months), while the orange line is CPI.
M2 is telling us that inflation is likely to head much lower in the coming 12 months.
On the surface, this would appear to be a good thing. After all, isn’t inflation one of the problems that markets face right now?
Maybe it is a good thing.
But the real problem is the extent of the decline.
After a massive increase in M2 during COVID, the rate of change has collapsed.
The problem arises in how big this decline has been.
It is not signaling that inflation should moderate. It suggest that inflation may turn into outright deflation.
The only way this happens is if we enter a moderate-to-deep recession. When major data points align like these three do right now, we must pay attention.
The New, More Giving Scrooge
While there are plenty of reasons to believe that 2023 is going to be a bad year again for stocks, not everything is bad.
Let’s look at some good data points right now:
- The consumer remains strong. Shoppers spent a record $5.29 billion this Thanksgiving, an all-time record high. Yes, inflation had some to do with this, but at this point inflation is not having a meaningful impact on the consumer, at least; not yet.
- Unemployment is low. The unemployment rate remains below 4%, primarily due to the services sector being strong.
- Inflation is slowing some. CPI for October came in at 7.7%, below estimates of 7.9%. November’s CPI data will be published tomorrow. As we can see from the M2, we should expect inflation to slow in the coming months.
- The Fed may be close to pausing. The market is anticipating a 0.50% increase at their meeting next week, with an additional 0.25% at their February meeting. Currently, markets expect that to be the end of interest rate increases for now. Historically, when the Fed Funds rate gets above the 2-year treasury yield, the Fed pauses interest rate increases. This will likely happen this week, so they very well could be done raising rates for a while.
Unemployment is a big data point here. Once the unemployment rate starts to rise, it has a direct impact on spending.
And consumer spending is roughly 70% of the US economy.
The main problem with looking at unemployment and other actual economic data is that they are backward-looking.
Once unemployment increases, we are already likely in a recession (even if it is not officially announced yet).
Which makes the forward-looking data points that much more important to consider.
Bottom Line
Despite the recent calm in markets, this is not a time for complacency.
Over the past 50 years, every time markets were volatile and NOT in a recession, NONE of the three indicators listed above were negative.
Now, all of them are negative. And all of them were negative prior to recessions.
This tells us that the likelihood of a recession next year is extremely high. In fact, the data suggests that it should be more of a question about the extent of the decline, not whether one occurs.
Fortunately, it is not a foregone conclusion that a recession will be deep and painful. There is still plenty of time for things to change into something more positive.
Hopefully, this angry Scrooge-like data will transform to be something less angry and more joyous towards everyone.
But as we always say, hope is not an investment strategy.
For now, we must deal with the realities of the environment at hand. And the current environment has major risks that should not be ignored.
Invest wisely!

