After reducing rates from 2.5% in 2019 to zero at the onset of the pandemic, the Federal Reserve has hiked rates by 0.25%. What does this mean and what should we be watching?
This was about as surprising as dropping a bowling ball on your foot and realizing it hurts.
While there are still MANY risks in the current market environment, this at least removes one uncertainty for now.
The Fed DID raise rates. They DID raise only a quarter-point. And they DID say they were going to raise more this year. (In fact, they hinted that they would likely have a rate increase at each remaining meeting this year).
What does this mean for the markets?
Frankly, not much.
- Inflation won’t change with a single quarter-point rate increase.
- Monetary policy isn’t going to change the global dynamics of the Ukraine war.
- Global supply chains won’t change due to this.
Granted, the mainstream media will make it sound like this is the most important development in the history of mankind, and will bring on “experts” to discuss it ad nauseum. The markets have initially moved higher on this news, which is a good start.
But given the cross-currents around the globe affecting the markets, this interest rate increase is fairly minor in the list of things influencing prices.
As we’ve said many times, markets are extremely complex. Global politics are also extremely complex.
Combine the two and you have an enormous matrix of potential outcomes.
When that happens, it’s best to simplify.
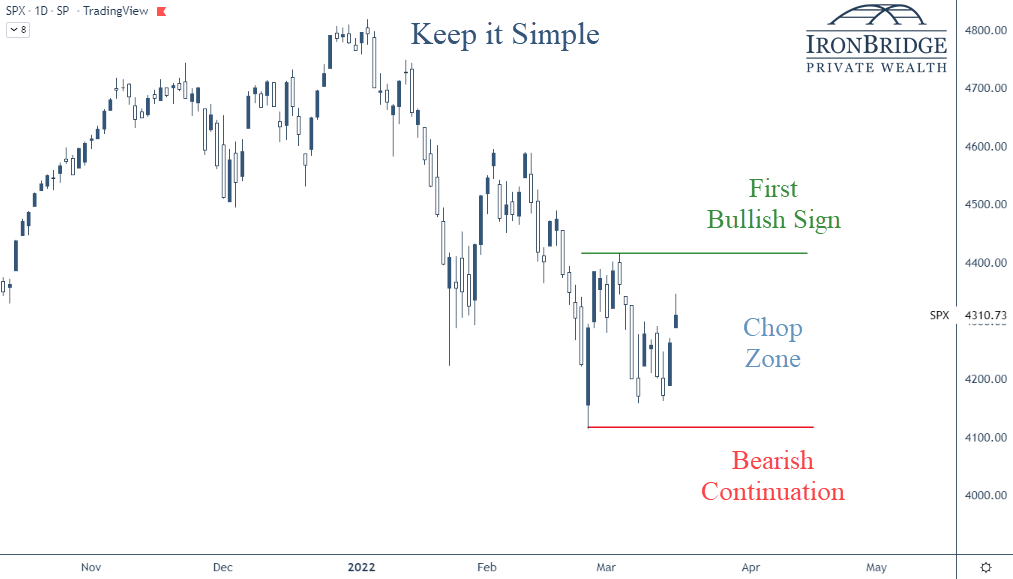
Here is a chart of the S&P 500 Index with the most simplistic view we can think of.

In this chart we show three basic scenarios:
- First Bullish Sign: If the market wants to move above the green line (the recent high from early March), then we would have the first sign that a trend change from down to up may be happening.
- Chop Zone: In between the green and red lines, there is very little reason to assume the market will ultimately move higher or lower.
- Bearish Continuation: If the market falls below the red line, then it is telling us that the volatility is not over and lower prices will follow.
So while we’re in this chop zone, we should consider the daily moves in the market to be noise.
Granted, when markets move 2% and 3% in a day, those are big moves. But until we see a move above or below the levels on this chart, it’s hard to become overly bullish or bearish.
Why do we mark these particular levels? Why might they be important?
Simple: We find it to be an easy way to determine the trend.
In downtrends, each time the market rallies, it stops at a lower level than where it stopped previously. For example, the all-time high was in early January. When it tried to rally in late January and early February, it stopped at a lower price than it was at the start of the year. The same thing happened in early March.
Each time it tried to rally, it made a “lower high”.
Having “lower highs” is the ultimate characteristic of a downtrend. And the market has definitely been in one since the first of the year.
The market can’t sustain a move higher if it doesn’t stop going down. (Thank you in advance for the Nobel Prize in Economics for that statement.)
On the flip side, if the trend of the market continues to move lower, it will make a new low in price below the red line.
That’s another characteristic of downtrends…lower lows.
We use more complex tools than this in our investment process. But this is one ways for you to think about the current market environment.
What are we Watching?
We’ll talk about this more in the coming weeks, but there are some major developments that we are watching right now.
I. Ukraine
This obviously remains the biggest wildcard and by far the biggest risk for markets.
So far, the market’s low (the red line in the chart earlier) occurred the morning of the invasion.
If we get a cease-fire, expect markets to respond favorably.
However, we need to be on guard for continued volatility and potentially lower prices if tensions escalate.
II. De-Globalization of the Economy
This is something we have been thinking about a LOT lately. We will discuss it in a future report as well.
One of the concerning outcomes of the sanctions imposed against Russia is that we have seen a shift to protectionism across the globe.
The globalization of the world economy that began post-World War II was designed to reduce the likelihood of another global war. The idea was that if countries were economic partners, they would have vested interests in maintaining peace.
So far, it has worked.
But since the sanctions were announced, multiple countries have decided to reduce trade. This has the potential to further reduce global supply of everything from oil to grains to semi-conductors.
Maybe these countries are simply responding to inflation and taking a temporarily cautious stance. If reduced trade is a temporary action, then things may go back to normal if inflation falls over the next few months.
However, if we are at the start of a longer-term cycle of de-globalization, there are many negative outcomes that could occur.
These include stubbornly high inflation, shortages of various goods, increased social unrest across the globe and a higher likelihood of more wars.
III. Stagflation
This is another topic we’ll discuss in a later report, but stagflation is becoming a real possibility now.
Stagflation occurs when inflation is high but the economy is in a recession.
It seems strange to think that it could occur in today’s world, but the possibility of stagflation is real.
IV. Market Recovery
We’re obviously watching risks, but not everything is bad right now.
Corporate earnings, for example, were at a record high last quarter.
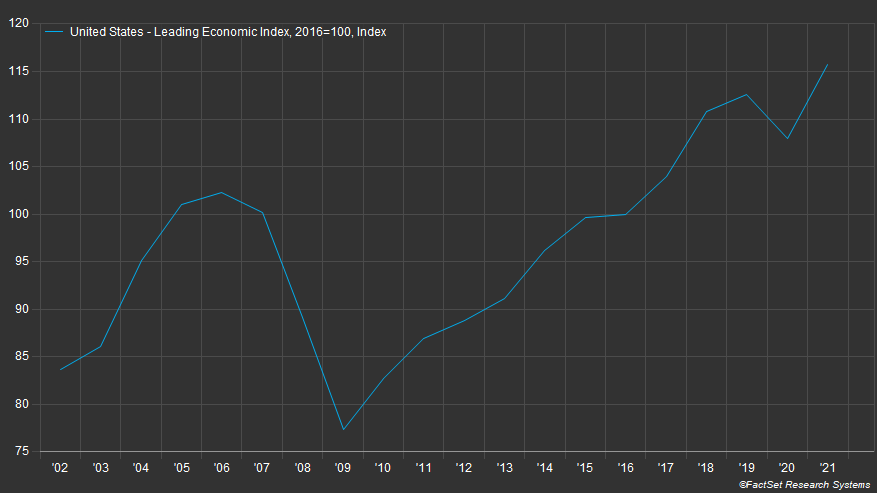
The Leading Economic Index (LEI), as shown in the next chart, is also at record highs.

This chart goes back 20 years.
One thing to not is that leading up to the financial crisis of 2008, leading indicators were showing signs of weakness. In fact, this indicator peaked in mid-2006, more than two years before things really unraveled economically in 2008.
Note: The leading economic index is made up of ten components, including hours worked, various manufacturing data, building permits, stock prices, yields and expectation for business conditions.
Further supporting the potential for optimism is that both corporate and personal balance sheets are strong, employment is good, and the housing market is on fire.
It will be important to see data that includes the Ukraine war, and what affect (if any) it has had on this data in the coming weeks and months. We will especially be watching the earnings reports closely that begin in early April.
So while there are many reasons to be pessimistic, there are reasons the market could recover and move higher for the remainder of the year.
Bottom line
Ultimately, the market price is what’s important.
Let’s keep watching these levels on the market to see if it can sustain a move higher, and we’ll adjust your portfolio accordingly.
Invest wisely!