• Skip to main content
  • Skip to footer

IronBridge Private Wealth

Forward with Confidence

  • Home
  • Difference
  • Process
  • Services
  • Insights
    • IronBridge Insights
    • Strategic Wealth Blog
    • Strategic Growth Video Podcast
    • YouTube Channel
  • Team
  • Clients
  • Form CRS
  • Contact Us

Thanksgiving Appetizer Report

November 22, 2022

Fall theme charcuterie board for holiday entertaining

Just wanted to provide a quick update as everyone prepares for the holiday week. We’ll send out a more detailed report next week.

Big Picture

  • Markets have remained calm after the massive gain two weeks ago following a milder than expected inflation number.
  • Earnings for the most part have been better than feared.
  • Markets are entering a seasonally strong period. From the Tuesday before Thanksgiving thru January 2nd, markets are up on average 79% of the time, averaging a 2.7% gain.  This is what is commonly known as the “Santa Rally”.
  • Despite these positives, many
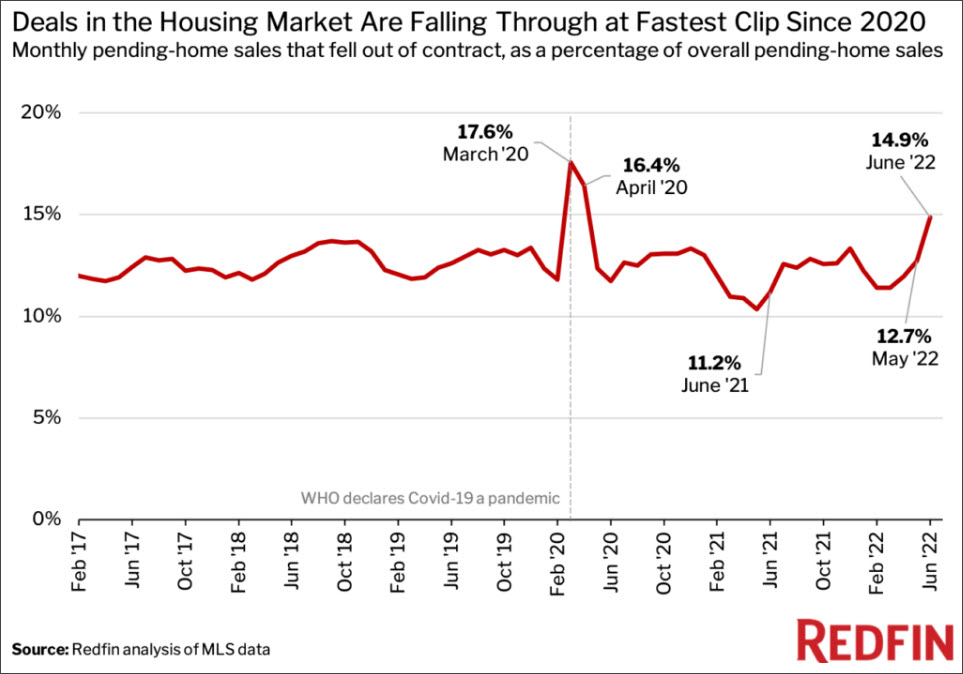
    warning signs still exist: leading economic indicators are weak, overall
    financial conditions are deteriorating, and the housing market is under
    stress. These conditions have not shown up in economic numbers (yet).

Economy

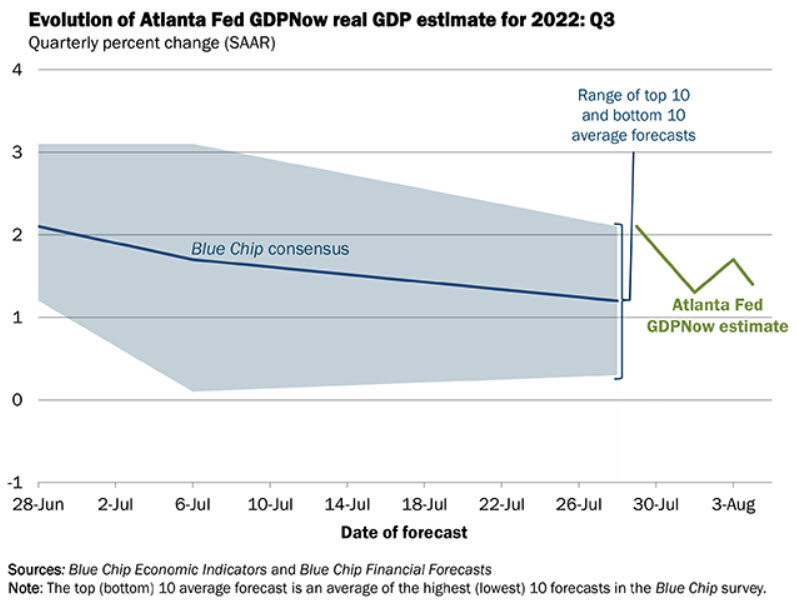
  • The good news: Economic activity remains resilient. GDP was up 2.6% in the 3rd quarter. 4th quarter GDP, according to GDPNow, is tracking up 4.2%. View it HERE.
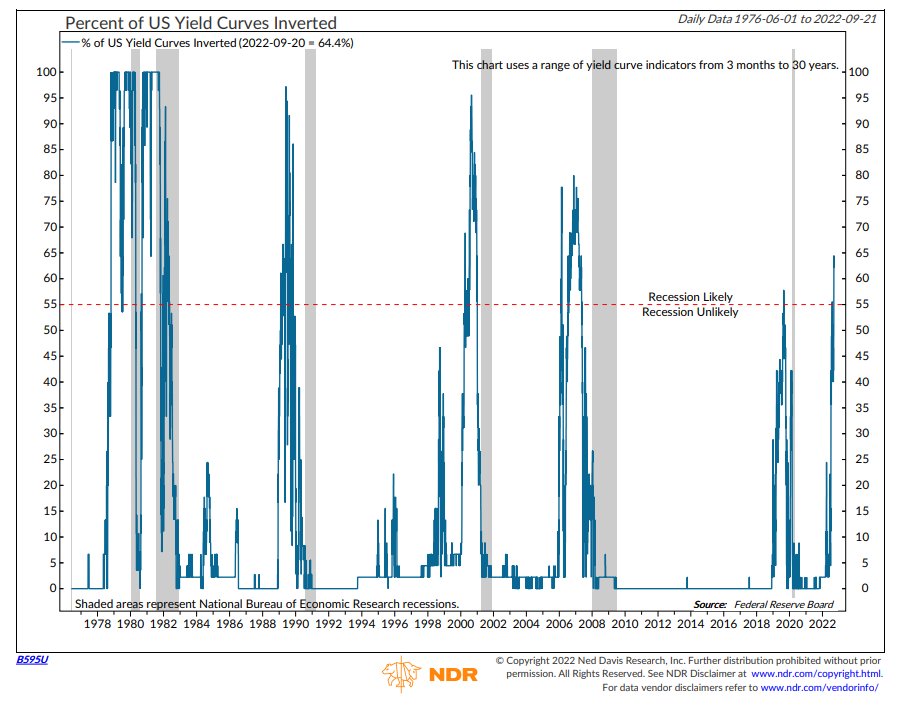
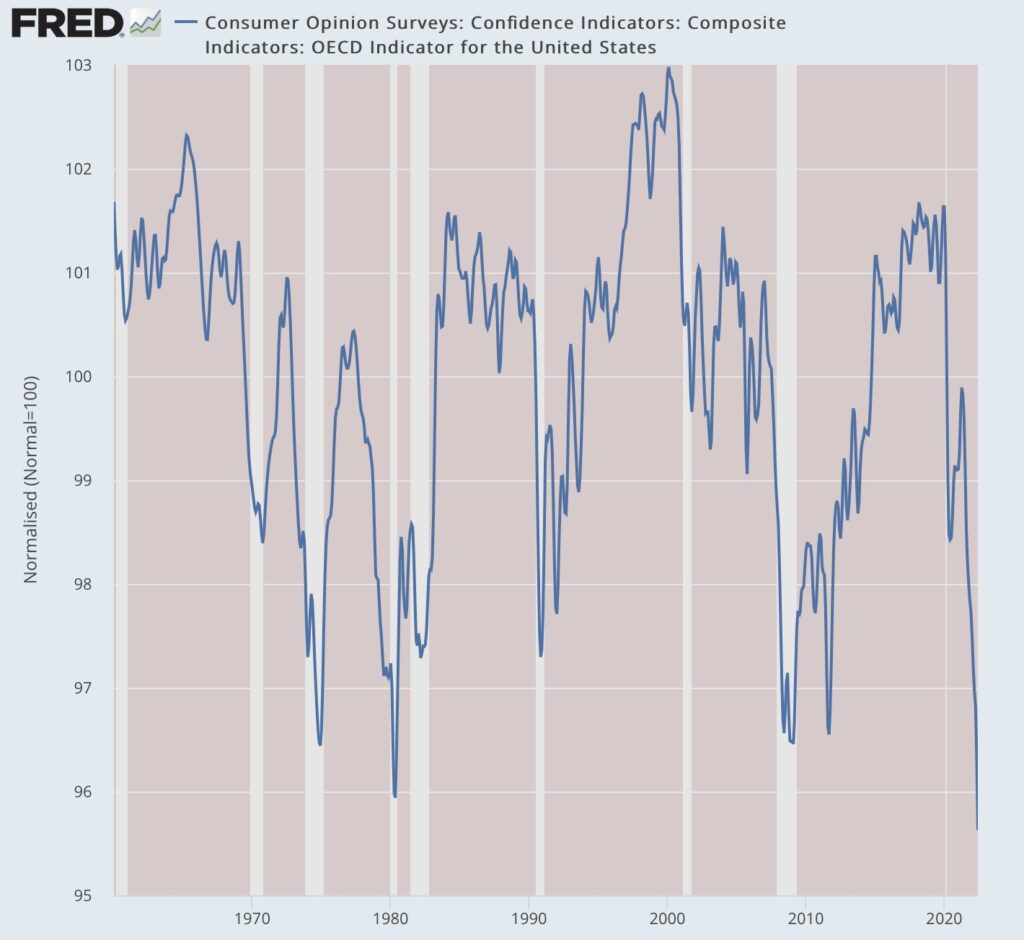
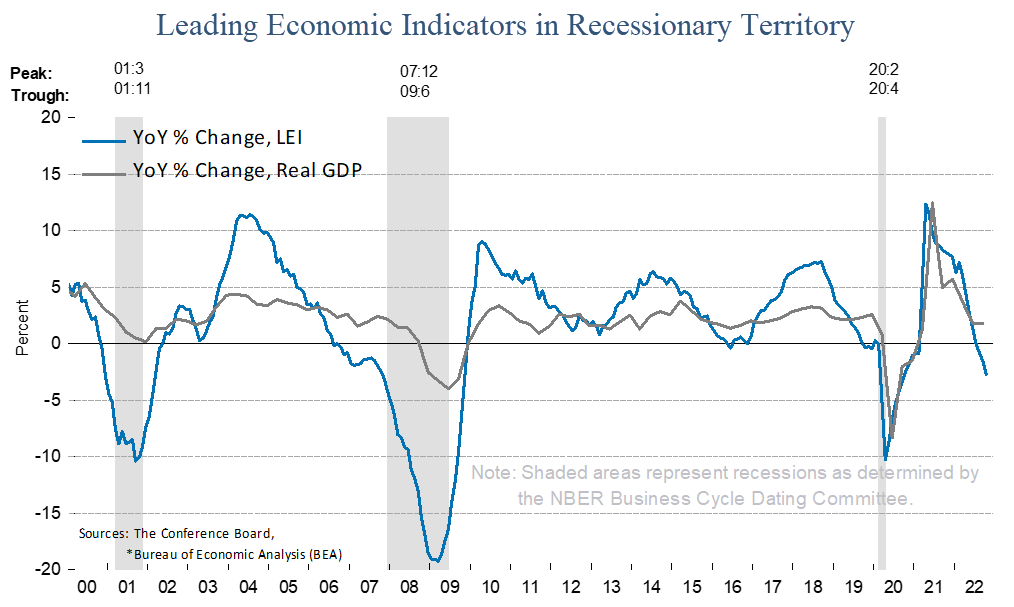
  • The bad news: Leading economic activity is at recessionary levels as shown in the first chart below.
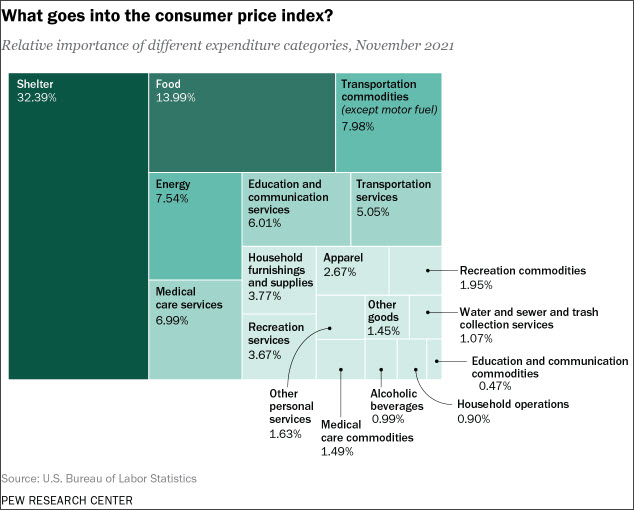
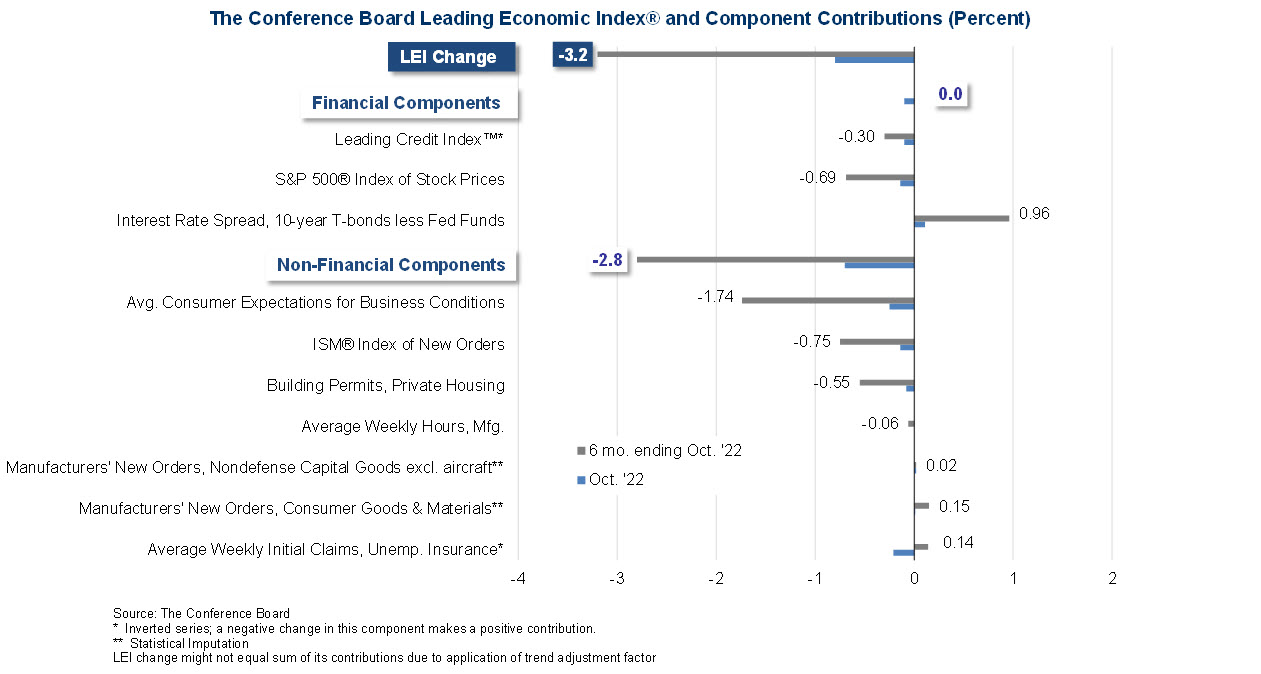
  • If you’re curious as to what makes up the Leading Economic Index, the second chart below shows the ten components with contribution from each.


Equity Markets

  • On November 10th, the S&P was up nearly 6%, and the Nasdaq was up 7.4%. This accounts for more than half of the return in the past two months.
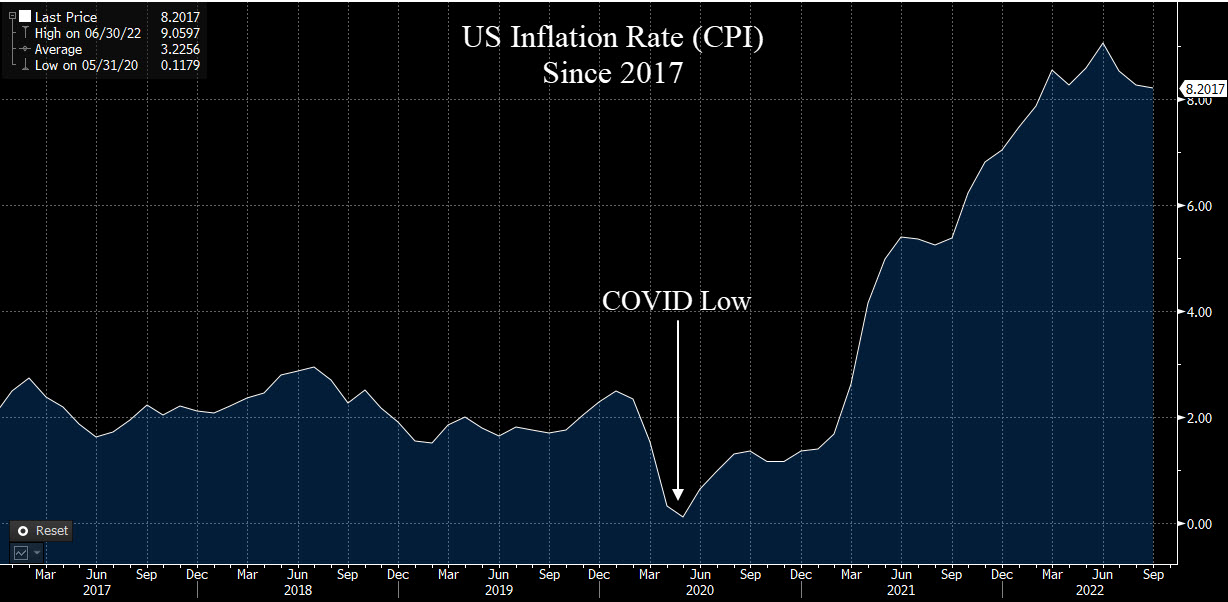
  • The big jump in markets on was due to inflation coming in at 7.7% instead of 7.9%.
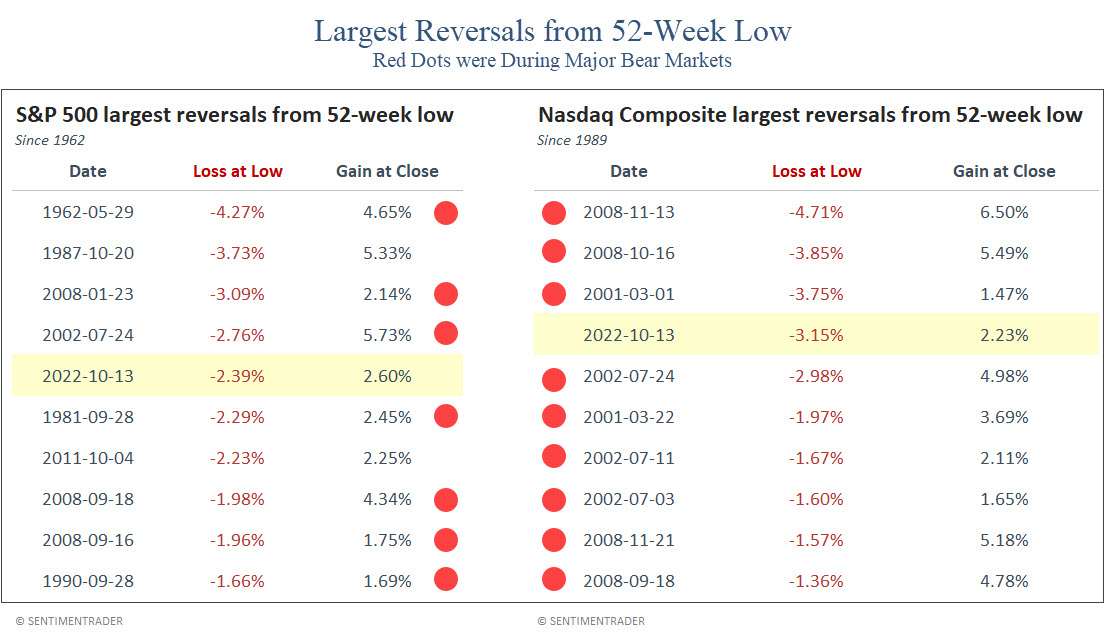
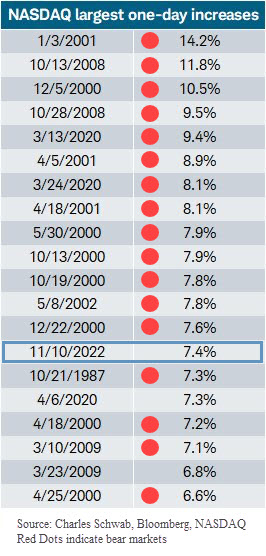
  • Big daily increases like this do not occur in good markets. The chart below shows the 20 largest increases in Nasdaq history.
  • 17 of the previous 19 largest daily increases occurred during major bear markets and did not mark the bottom.
  • The other 2 happened one week after the ultimate bear markets lows in 2009 and 2020 under very different conditions than we have now (VIX then was above 80, while VIX currently is at 22.)
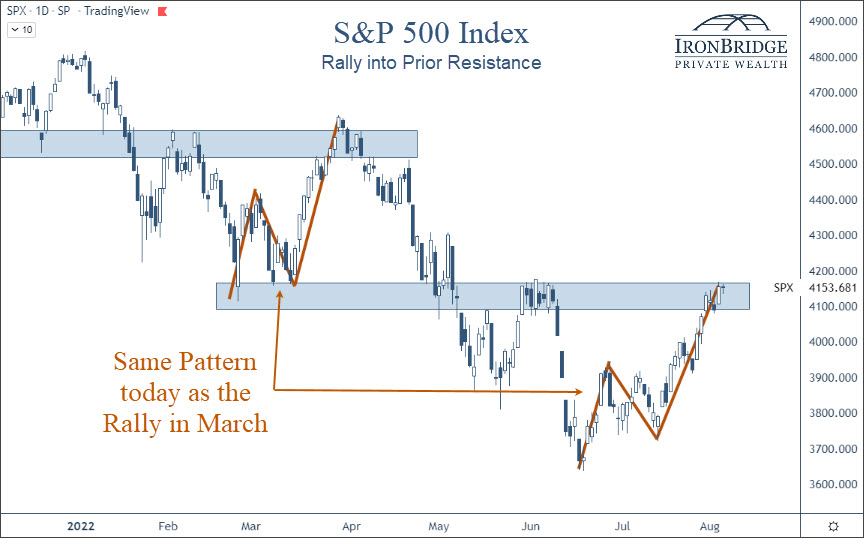
  • Near-term, markets could continue to drift higher. Looking past the next few weeks, things appear to be very weak. Caution is advised.
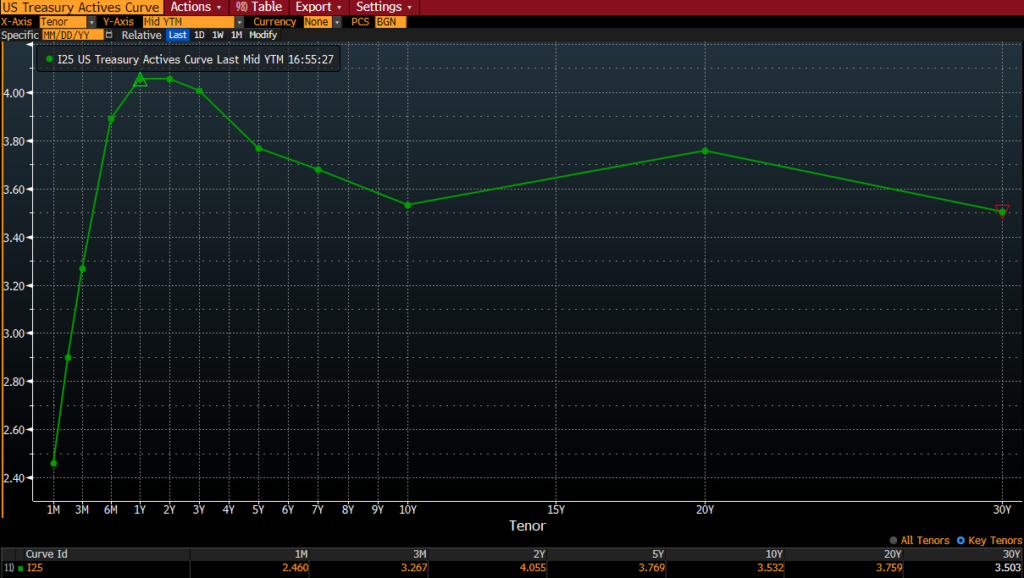
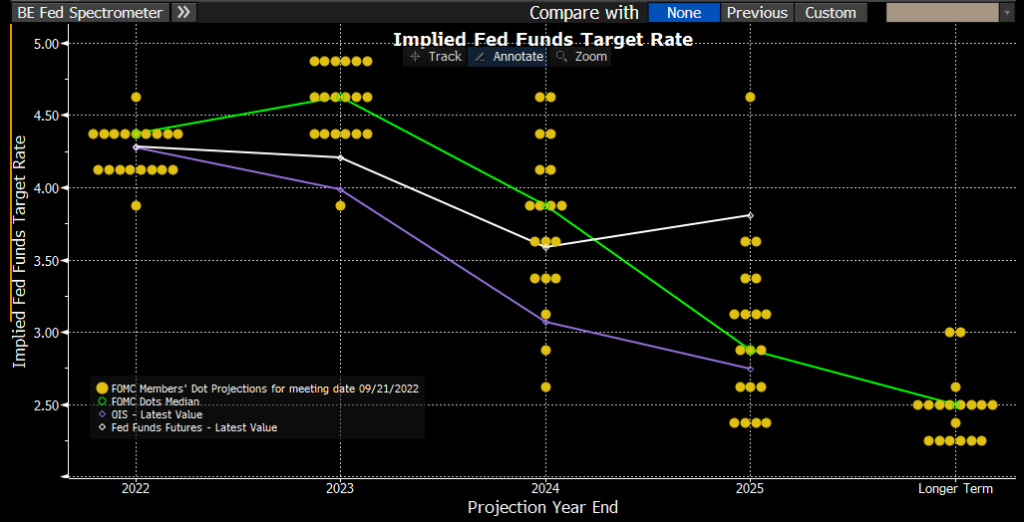
Interest Rates

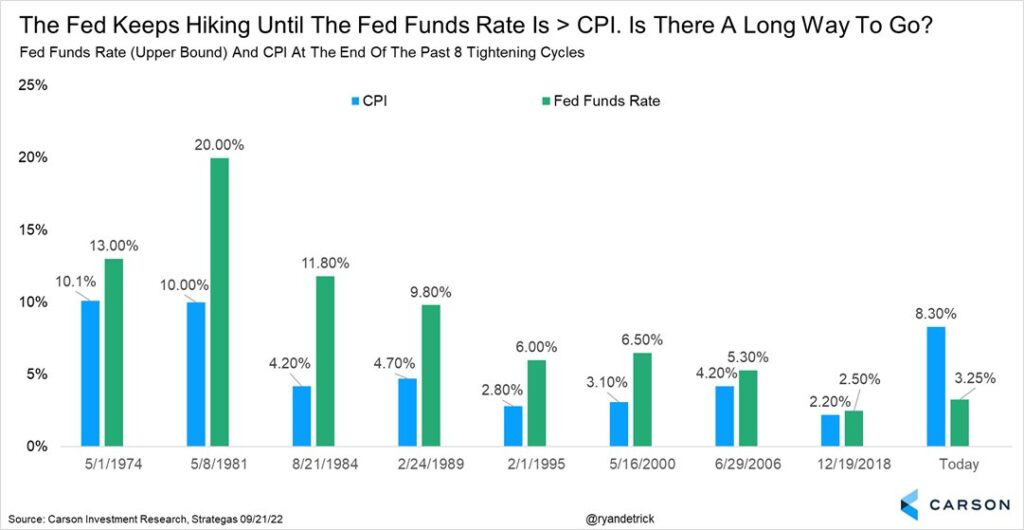
  • The Fed is likely to increase rates by 0.50% in December, then another 0.25% in February. The market anticipates that the Fed will stop raising rates after that.
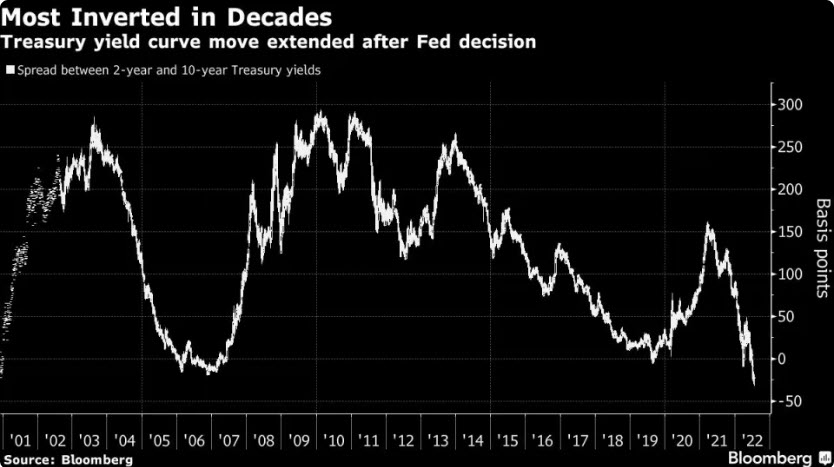
  • Longer term rates appear to be calming down, and may be starting to price in recessionary risks.

Bottom Line

While the relative calmness has been a welcome respite from the volatility this year, we do not believe this is a time for complacency.

We would love to believe that the bear market is over. At our core, we are optimists.

But more importantly, we are realists.

Equity exposure has steadily increased in client portfolios this quarter. If market and economic conditions continue to improve, we will continue to do so.

But we view any new equity exposure as potentially having a very short shelf-life.

We will not hesitate to reduce equity exposure, increase cash levels, and do more hedging to protect portfolio values if and when these actions are warranted.

We hope you and your loved ones have a wonderful Thanksgiving holiday.

Invest wisely!


Filed Under: IronBridge Insights Tagged With: earnings, federal reserve, inflation, interest rates, markets

Are We There Yet?

October 14, 2022

Looking into the back of the car at two children passengers passing the trip away teasing and crying.

We’ve all been there. (At least those of us with kids have been.)

The start of a long road trip. Everyone is excited to get going. Then you get 8 minutes into an 11-hour drive, and you hear the famous words emanate from the backseat…”Are we there yet?”

We’ve all been through bear markets too. (Although it’s been 15 years this month since the last real one began.)

Yesterday, markets had one of the largest reversal days in history.

Which begs the question…”are we there yet?”. Is this bear market over?

SPOLIER ALERT…the answer is pretty clear…no, we’re not there yet.

What about that Giant Reversal Day Yesterday?

Inflation data for September was announced yesterday morning. The CPI came in higher than expected, at 8.2% year-over-year. Markets expected a reading of 8.1%.

Last month, the same thing happened. And markets fell over 3% on the day.

Initially, it looked like we were going to see repeat of the damage. Markets fell hard in the morning, and were down over 2%.

But by the end of the day, all major US stock indices were HIGHER by more than 2%.

On the surface, this would seem like a good thing.

Markets heard bad news but rallied on it.

This isn’t the first time the market has had a big reversal like this.

Our first chart shows the ten largest reversals when the the S&P 500 and the Nasdaq were each at respective 52-week lows, courtesy of SentimenTrader.

Largest 10 reversals from 52-week lows for the S&P 500 Index and the Nasdaq Composite Index. All events happened during major bear markets.

The red dots are times that this happened while the markets were in major bear markets.

What does this chart tell us about big reversals like we saw yesterday?

  • 16 out of 18 previous events (excluding yesterday) occurred during deep recessions.
  • 7 occurrences happened during the 2008 Financial Crisis
  • 6 occurrences happened during the 2001-2002 Tech Bust
  • All previous occurrences in the Nasdaq happened in 2001/02 or 2008. Both times the index lost over 60%.
  • None of these events occurred at the lows.

During 2008, these events actually happened before things really started to unwind.

For the S&P 500, reversals happened once in January and twice in September of 2008. After the occurrence in September of 2008, the S&P 500 fell another 46%.

Reversals on the Nasdaq happened throughout the fall of 2008.  After the first one occurred in September of 2008, the Nasdaq fell another 42%.

These events are not indications of hope. They are signs that things are broken.

Caution is still warranted.

High Inflation is not because of Supply Issues

Inflation is proving to be harder than the Fed expected to get under control.

By looking at the past 5 years, we can definitely see the spike in inflation in the US, as shown below courtesy of Bloomberg.

US inflation rate has been skyrocketing since the COVID lockdowns.

The low on this chart was during the COVID lockdown. It has skyrocketed since.

One major factor after COVID is that there were problems in the global supply chain.

The Baltic Dry Index is a measure of the cost of shipping containers across the globe. When it goes up, it means that there are supply chain issues and great demand for ships.

This index is shown in the next chart.

The spike in this chart in 2021 was when there were massive bottlenecks at ports across the globe. At one point there were hundreds of ships waiting to get into the port at Long Beach, California.

But this index has moved back to pre-COVID levels.

This suggests is that inflation is NOT due to supply constraints. At least not on a global level.

For the most part, things are moving quite normally across trading channels.

So why is inflation high?

Components of Inflation

To understand the inflation numbers, we must understand the various data points that go into the CPI number.

Here’s a helpful graph from the Pew Research Center that shows the various components of inflation.

Components of the US inflation rate index the Consumer Price Index or CPI. Shelter, food, transportation, education and medical services are the major components.

Shelter, food, education, transportation and medical care account for 74% of the CPI numbers.

None of these are showing signs of weakening yet.

It’s tough for the CPI number to get to their stated goal of 2% if the largest inputs continue to go up.

This is why the Fed is so focused on the housing market.

At 32%, it is more than double the next largest component.

Energy prices are a decent-sized component at 7.54%, but they would have to fall by 90% to get the CPI where the Fed wants.

So they are attacking home values.

What would make home prices fall?

People get laid off. They can’t afford their monthly payment. There are fewer buyers because interest rates are too high.

The Fed essentially has a goal of crushing lower and middle class Americans.

In our previous report, “A Recession or Not a Recession”, we discussed the belief that the housing market will be the key to whether we see a major recession or just a mild one. Here’s a link to that report:

A Recession or Not a Recession, That is the Question

We stand by this thought.

The housing market has been showing some minor indications of weakness, but nothing like what the Fed wants to see.

Bottom Line

We have been pretty clear for the past few months that it appears we are in a major bear market.

We don’t see any reason to abandon that point of view.

That said, we should expect some fierce bear market rallies. And ones that last longer than one or two days.

But as of right now, there is very little reason to expect that we are near a major bear market low.

As always, please do not hesitate to reach out with any questions.

Invest wisely!


Filed Under: IronBridge Insights Tagged With: Baltic Dry Index, CPI, federal reserve, inflation, markets, volatility

Don’t Fight the Fed

September 21, 2022

The Federal Reserve met today and increased interest rates by 0.75%, as expected.

Stock markets were volatile all day, and ended up down almost 2%. So maybe it wasn’t so expected after all.

As we have consistently said in communications over the past few months, risks are very high right now.

Today didn’t do anything to change that in either our signals or our minds.

We’ll keep it short and to the point today, and let charts do most of the talking, but let’s do a brief portfolio update first.


Portfolio Update

Client portfolios are VERY conservative.

We have continued to reduce equity exposure in all portfolios, and we have added equity hedges to portfolios as well.

If markets continue to fall, your portfolio should remain very stable. We cannot eliminate risk, so there will always be fluctuations. But we have minimized those to properly handle the current environment.

We firmly believe this to be the proper course of action at this point.

As always, markets can change. If we get signals to increase risk, we will not hesitate to do so.


Yield Curve

The Yield Curve remains inverted. This means that short-term rates are higher than longer term rates. The yield curve is more inverted than it has been in almost 50 years.

US Treasury Yield Curve is inverted

Why does the yield curve get inverted in the first place?

There are two main reasons:

  • Short-term rates are mostly set by the Fed. They have been steadily increasing rates all year.
  • Longer-term rates are set by the market. When there are concerns about economic weakness, money flows into longer-term treasury bonds.

Longer-term yields have been relatively stable the past few months, while short-term rates have risen dramatically.


Inverted Yield Curves Lead to Recessions

As we have mentioned numerous times this year, an inverted yield curve has been an excellent indicator of recessions.

The next chart shows the percentage of the yield curve that is inverted (blue line), with recessionary periods in gray.

The percentage of the yield curve that is inverted simply looks at various maturities and counts whether the short-term rate is higher than the long-term rate. (3-months vs 2-years, 3-months vs 5-years, etc.)

When more than 55% of the yield curve becomes inverted, it has ALWAYS preceded a recession. We are now at 65% of the yield curve that is inverted.


The Fed’s Dot Plot

This is a bit of a complex chart, but it shows how each member of the Federal Reserve Committee sees future interest rates.

This shows that the majority of Fed members believe they will hike rates to somewhere between 4.5% and 5.0%. The target rate is currently 3.00-3.25%. (They use a 0.25% range when setting the Fed Funds rate).

So we can assume that there is likely another 1.50-2.00% of interest rate increases to come. This would likely be another 0.75% at the next meeting in October, followed by slightly decreasing hikes (0.50% then 0.25% at the following two meetings).

Things can change, but this is a good gauge of their thoughts.

It is also interesting to note that almost every Fed member is then projecting rates to fall in 2024 and beyond.


When has the Fed Stopped Hiking Historically?

Historically, the Fed stops raising rates when the Fed Funds rate gets above the inflation rate. There may be some time to go before that happens.


Bottom Line

Today’s developments do not surprise us.

The Fed has been crystal clear about wanting to slow the economy, slow wage growth, and remove speculation from markets (meaning lower stock and home prices).

They re-emphasized that today in no uncertain terms.

The Fed wants prices to fall. Don’t fight them, you won’t win.

The downside scenarios are large enough that it still makes sense to reduce risk if you haven’t done so already.

As always, please do not hesitate to reach out with questions or to review your individual circumstance.

Invest wisely!


Filed Under: IronBridge Insights Tagged With: fed funds rate, federal reserve, interest rates, inverted yield curve, markets, volatility, yield curve

The Bear Market is Accelerating

September 13, 2022

Stocks had the worst day since the depths of COVID after inflation data came in higher than expected.

We’ll discuss the following in this report:

  • Market Overview
  • What is the Reason for the Decline?
  • Portfolio Updates

Let’s get to it.

Market Overview

Major stock indexes had huge losses today:

  • S&P 500 Index: Down 4.3%
  • Dow Jones: Down 3.9%
  • Nasdaq: Down 5.2%

Wow.

These are the biggest daily losses in over two years.

Bonds fell, international markets fell, commodities fell…everything was down.

This has not been a healthy market this year, and it looks to be worsening.

What is the Reason for the Decline?

The financial media is blaming inflation.

This morning, the Consumer Price Index (CPI) came in at 8.3% year-over-year, versus expectations of an 8% increase.

But do we really think the market would be up today if inflation was 7.9%? Is that 0.4% difference the real issue here?

We don’t think so.

Instead, we suggest that there is one main thing happening now: LIQUIDITY is being removed from the financial system by the Federal Reserve.

The strong rally in equity markets over the summer was based on the thought that the Fed would slow down the pace of interest rate increases.

This was wrong and illogical thinking.

The Fed has been very clear about this over the past three months.

They are actively trying to remove speculation from markets, in the attempt to reduce demand and drive down prices.

They WANT prices in the economy to fall. They WANT markets to fall. And they won’t stop until inflation is back down to 2%.

After today, there is a 100% chance that the Fed increases rates by 0.75% next week, with a 34% chance they raise a full one percent. They are not slowing down the pace of rate increases, they are increasing it.

The Fed also increased “Quantitative Tightening” this month. They are scheduled to remove almost $100 billion in liquidity from the financial markets in September alone.

The message in the 10 years after the 2008 financial crisis was “Don’t fight the Fed.” They were printing money like it was a monopoly game, with the goal of increasing asset prices to increase demand.

Now, we have the opposite environment, and the Fed is REMOVING assets from the financial system.

The natural result is decreased demand for risk assets.

But the message is still the same…don’t fight the Fed.

Portfolio Update

This year continues to be volatile, and we expect that to continue.

  1. As we shared in our video last Friday, the market is very volatile (obviously), and the outlook is uncertain. Two of our three highest probability scenarios include major declines in financial markets from here. The link to our video is below.
  2. We were already very defensively positioned in client portfolios with greatly reduced equity exposure and high cash and cash equivalent exposure. We increased cash exposure today as well.
  3. We see multiple scenarios where hedging positions will be included in client portfolios in the very near future. We also expect equity exposure to continue to be reduced from already low levels.

We discuss the following topics (followed by when they appear in the video):

  • Why the real estate market may be the best indicator to watch
  • S&P 500 Overview (4:46)
  • Similarities between now and 2008 (6:30)
  • Our top three potential market scenarios (8:15)
  • Yield Curve (12:06)
  • Commodities (13:05)

Bottom Line

This is not a time to be thinking about increasing allocations to stock. This is a time to be defensive.

This market environments could easily reverse higher, but the likelihood is that there is far more downside ahead.

We hope we are wrong. If we are, we will adjust accordingly.

In the meantime, the worst possible action is to do nothing, keeping large exposure to stocks and HOPE things get better.

Relying on hope in bear markets is the best way to make an investment mistake that could jeopardize your financial plan and your financial future.

As always, please do not hesitate to reach out with any questions.

Invest wisely.


Filed Under: Special Report Tagged With: federal reserve, inflation, interest rates, markets, volatility

Retiring in a Volatile Market: Control What You Can

August 23, 2022

Loving mature wife embracing husband from behind while writing in book. Happy middle aged couple making to do list of purchases and discussing future plans. Cheerful senior man working at home on wooden table with beautiful woman hugging him from behind, copy space.

Retirement during a volatile market is unsettling.

Whether you are on the cusp or have already made the leap, a market downturn’s impact on your savings will be felt now and potentially for years to come. How do you keep your plan on track and your desired lifestyle in place?

If you can’t control income, you’ll need to control expenses. And that means budgeting and taxes. You can deploy tactics and strategies to optimize these factors no matter what stage you are in on your retirement journey.

Set a Realistic Budget – And Stick to It

Lifestyle creep is real.

No matter how carefully you budget, somehow, the numbers on the spreadsheet don’t mean much when confronted with fun, deliciousness, seeing family, a quick weekend trip, or anything else. You get the idea.

A volatile market means that drawing income from investments will likely result in selling into a down market. This not only crystallizes the loss, but you may also have to sell greater amounts to make up for lower prices. This will hamper your recovery, and your assets may not grow as much over time.

Reviewing your budget to ensure you keep your spending at a level that is commensurate with your income is critical.

Plan Proactively to Reduce Taxes

Planning strategically for taxes can help you keep more of your income.

This can compensate for budget shortfalls or help you give long-term capital growth investments the time they need to recover. There are a lot of things you can do to keep yourself in the lowest possible tax bracket.

Maximize Tax-Free Social Security Income

Social security benefits have a tax-free component of at least 15%. Whether you pay taxes on the other 85% depends on your overall income level, but you can increase your tax-free income by maximizing your benefits.

Waiting until age 70 to claim increases your annual benefit by 8% for every year from your full retirement age (FRA). If you are married, it may make sense for the spouse with the highest income level to wait until age 70, while the lower-income spouse claims at early or full retirement.

Deploy an Asset Location Strategy

Asset location refers to the types of accounts where you hold investments. They are tax-deferred such as 401(k)s and IRAs, taxable brokerage accounts, and tax-free Roth accounts.

Using all the accounts together to create a tax strategy that lowers lifetime taxes is the goal. The general principle is to match the asset up to the account’s tax treatment. Stocks receive tax-favorable treatment on qualified dividends and long-term capital gains, so one option is to put them in a taxable account.

If you hold municipal bonds, they also go into a taxable account. Higher yielding corporate bonds would be held in a tax-deferred account, as the lower growth rate compared to equities will help reduce required minimum distributions, which are based on the account value.

Using the Roth IRA account as a flexible source of funds can help keep you in lower tax brackets. In years when taxable income is higher, using funds from the Roth account for living expenses can reduce income taxes and help you avoid the IRMAA Medicare Part B and Part D premium surcharge.

Take Advantage of Lower Asset Values with a Roth Conversion

The drop in value of 401(k) and IRA accounts is painful – but it also means that you can convert those assets to a tax-free Roth account with a lower tax liability.

This can set you up for a more effective asset location strategy and can help you control future income and taxes by eliminating RMDs on the assets that are converted.

The Bottom Line

Retiring in a volatile market adds a layer of complexity to all the choices you need to make.

It means emphasizing controlling your expenses, whether lifestyle or the taxes on the income you draw from retirement accounts.

The critical thing to remember is that you do have options, and you can control several important levers that can help you keep your retirement plans intact.


This work is powered by Advisor I/O under the Terms of Service and may be a derivative of the original. The information contained herein is intended to be used for educational purposes only and is not exhaustive. Diversification and/or any strategy that may be discussed does not guarantee against investment losses but are intended to help manage risk and return. If applicable, historical discussions and/or opinions are not predictive of future events. The content is presented in good faith and has been drawn from sources believed to be reliable. The content is not intended to be legal, tax or financial advice. Please consult a legal, tax or financial professional for information specific to your individual situation.

Filed Under: Strategic Wealth Blog Tagged With: inflation, interest rates, medicare, retirement, retirement planning, social security, tax planning, volatility

Women and Money: An Evolved Approach

August 18, 2022

Inspired mature grey-haired woman fashion designer thinking on new creative ideas at workplace. Smiling beautiful elegant classy middle aged older lady small business owner dreaming in atelier studio.

Women at all age levels are redefining how they think about their financial journey. This includes career paths, planning for flexibility, taking charge of family finances, or being successful on their terms.

There are some generational differences among Gen Z, Millennial, Gen X, and Boomer women—but not as much as you’d think. And two main differences that set them apart from men hold across generations:

  1. Women are better investors than men1
  2. Women are more likely to approach financial planning as a partnership with a trusted advisor2
  3. Women value a financial advisor that listens to them more than men do3

Women tend to outperform men partly because they are more patient investors and trade less. This results in better performance over time and lowers costs.

As to the second result, the easy reach is to point out the men are reluctant to ask for directions when driving too. But it’s a little more complicated than that, and the reasons why women seek financial advice change as they move through their lifecycle.

How they want to partner with a financial advisor is also different. Women want to be sure that the advisor listens to them and understands and respects their priorities.

Gen Z and Younger Millennials

Younger women (Gen Z and younger Millennials) are generally comfortable and confident about money and financial planning.

They’ve grown up with more salary transparency, the proliferation of money-related apps to help with budgeting and investing, and the optimism of youth. They are interested in financial planning that fits their busy lives. They make good salaries, still have debt, are single or newly partnered, and want to get a good foundation in place.

They gravitate to financial planners that offer the planning they need in a way that they can relate to. This includes cash-flow planning, debt reduction strategies, maximizing employee benefits, and above all – helping them improve their financial literacy.

This generation of women understands the value of starting early on the path to financial independence and wants financial planning advice that can help them build a solid foundation.

Older Millennials and Gen X

Portrait of smiling beautiful millennial businesswoman or CEO looking at camera, happy female boss posing making headshot picture for company photoshoot, confident successful woman at work

As women approach the mid-point of their careers, money becomes more complex.

Careers are in full swing, and growing wealth brings to the fore the costs of making a mistake.

These women may not have worked with a financial advisor before. Whether single or partnered, they realize that all the different pieces of their financial lives need to come together in a comprehensive plan.

For them, it’s about creating the option to stop work, scale back work, start a business of their own, or do more meaningful work that may not be as highly paid – while maintaining a current lifestyle and still save for financial goals in the future.

They realize the value of working with a financial advisor that can help them put together all the pieces of their lives:

  • Equity compensation
  • What to do with an annual bonus
  • Tax planning
  • Saving for education
  • Taking the right amount of investment risk
  • Buying a second home or income property
  • Creating opportunity with their wealth

These women want a trusted partner that explains the “why” to them, and guides them to make choices that are right for them.

As things change, they value being able to make changes to a plan to accommodate new goals or different circumstances.

Older Gen and X-Boomers

These women are driving the decision to work with a financial advisor for themselves and their families. Very often, something has sparked the need to partner with a financial advisor to solve an immediate problem.

  • A change of job
  • A spouse’s health issue
  • Aging parents
  • Imminent retirement
  • Death of a spouse
  • Tax issues

Having a trusted partner to help them sort through the issue calmly in a non-judgmental way is paramount. They want someone to help them fix problems, provide solutions, and ensure that no other avoidable situations are on the horizon.

They may realize that a spouse has always done the financial planning and that it may be time for them to understand the specifics of their wealth. They may want to plan for a retirement that allows them the time they have always wanted with their family.

This group has the most anxiety around money and the least excitement.4 They need to develop trust and have an investment plan that helps them achieve their goals – without taking on too much risk.

The Bottom Line

Women are taking control of their and their families’ wealth at all points on the age spectrum.

They value working with a financial advisor, but they are clear in their need to have someone who listens, prioritizes their goals, is a trusted partner, and truly understands how they want to build and maintain wealth.


1.Fidelity 2021 Women and Investing Study.

2, 3, 4. U.S. Bank. Women and Wealth: Exploring the Gender Gap. 2021.

This work is powered by Advisor I/O under the Terms of Service and may be a derivative of the original.

The information contained herein is intended to be used for educational purposes only and is not exhaustive. Diversification and/or any strategy that may be discussed does not guarantee against investment losses but are intended to help manage risk and return. If applicable, historical discussions and/or opinions are not predictive of future events. The content is presented in good faith and has been drawn from sources believed to be reliable. The content is not intended to be legal, tax or financial advice. Please consult a legal, tax or financial professional for information specific to your individual situation.

Filed Under: Strategic Wealth Blog Tagged With: estate planning, financial planning, portfolio management, tax planning, wealth management, women investing

A Recession or Not a Recession, That is the Question

August 5, 2022

“To be or not to be–that is the question: Whether ’tis nobler in the mind to suffer the slings and arrows of outrageous fortune or to take arms against a sea of trouble and by opposing end them.”

hamlet, act 3, scene 1

July was a nice month in the markets.

Which begs the question…have we seen the lows in this bear market?

Should we expect markets to continue to rise and suffer the slings and arrows of outrageous fortune? Or is this yet another fake-out like we’ve seen twice already this year and we go back into a sea of trouble?

The answer? It depends.

In most environments, it “depends” on a complex series of data points could shape the direction of the markets.

However, today’s environment seems more simple on the surface.

It depends primarily on only one variable: whether we are in a recession or not.

The reason is very simple…markets respond differently to pullbacks similar to what we’ve seen this year based solely on if it happens during a recession or not.

Let’s look at some historical context.

S&P 500 Performance: Recession vs No Recession

Markets can decline without the economy being in a recession. Since 2009, we’ve seen this happen a few different times:

  • 2011: US Debt Downgrade
  • 2016: Chinese Yuan Devaluation and Oil Crash
  • 2018: Random 20% decline in the 4th quarter

Each of these times, markets fell roughly 20%.

And each of these times, markets recovered losses within 18-24 months.

But there was no recession during these periods.

Our first chart below, courtesy of Ned Davis Research, shows this dynamic. The chart shows declines of at least 18% and separates it between two categories: whether it occurred during a recession or not.

The black line is the performance of the S&P 500 when there was no recession, while the blue dotted line shows the performance if there was an official recession.

We are currently two months past the recent lows, as indicated by the red dashed line.

Based on what the market has done historically, the results are very clear: if we’re not in a recession, we should expect the next 12 months to be pretty good. If we are in a recession, we should expect more volatility and a retest of the lows.

Which begs the question…are we in a recession or not?

Are We in a Recession?

Normally, determining a recession is pretty straight-forward: it is two consecutive quarters of negative GDP growth.

Both Q1 and Q2 this year were negative.

So by historical definitions, yes, we are in a recession.

But it may not be quite that simple this time.

We don’t like to get political in these reports, because the world focuses way too much on the self-absorbed, sociopathic political class.

But with mid-term elections around the corner, the incumbents are trying to change the definition of a recession.

It’s an overly transparent pre-election tactic. But we will reluctantly admit that in this case, they may have a point.

(To be fair to our politician friends, many economists agree that the first quarter did not resemble a typical economic recession.)

Let’s look at the data.

The first quarter GDP came in at a negative 1.4%, mostly because of two things:

  • Defense spending fell 8.5%
  • A trade imbalance due to a strengthening US dollar resulted in a negative 3.2% from total GDP.

Remove these two factors, and GDP is positive. In fact, if you simply remove the trade imbalance, GDP is positive.

Economic data in the first quarter was fairly positive as well, led by consumer spending, which was up 2.7%.

While the first quarter showed relatively good economic data, the second quarter was recessionary without question.

Second quarter GDP was negative 0.9%. And the negativity was more widespread.

  • Inventory investment decreased 2.0%
  • Housing investments decreased 0.7%
  • Federal and State spending both decreased slightly
  • Business investment decreased 0.1%
  • Consumer spending rose by a more moderate 0.7% (down from 2.7% in Q1)

With the underlying strength in the first quarter, it’s not out of bounds to assume that we’ve only seen one quarter of truly negative GDP growth.

(For the record, we don’t think we should change the traditional definition of a recession, but we should always put GDP data in context, both positive and negative.)

Which makes the current quarter especially important.

If we have negative GDP this quarter, there is no question that we are in a recession. The question then becomes how bad it is and how long it lasts.

Atlanta Fed GDPNow

One way to keep track of current GDP estimates is through the Atlanta Fed’s “GDPNow” tracker. (You can view the site HERE.)

As of Thursday, August 4th, they are projecting a 1.4% GDP for Q3, as shown in the next chart.

Granted, the estimate has steadily declined since the start of the quarter, and we still have almost 2/3 of the quarter left. So anything can happen.

And this data is also based on human estimates, which can be skewed.

But it should at least give us some hope that maybe we don’t see a formal recession this year. And if we do see one, it would likely be fairly mild.

This morning’s jobs report adds to the hope that we may not be in a recession just yet. The economy added 528,000 new jobs this quarter, and as of July has officially recovered the number of jobs lost during COVID.

However, we shouldn’t get too complacent at this point.

While GDPNow is showing positive estimates for current GDP, there are huge warning signs right now that should give us cause for concern.

Inverted Yield Curve

Historically, one of the best recession indicators has been an inverted yield curve. This occurs when the 10-year yield on US Treasuries are LOWER than the 2-year yields.

The next chart, courtesy of Bloomberg, shows this inversion.

When the line goes below zero, the curve is inverted.

Right now, it is more inverted than at any time since Paul Volker started fighting inflation the early 1980’s.

It is more negative than COVID, than the global financial crisis, the tech bubble, and various recessions during the 80’s and 90’s.

We strongly believe that it is imprudent to ignore this data point.

But this data point isn’t a very good timing indicator of when a recession may happen.

In reality, it is when the curve starts to steepen AFTER it has been inverted that is a better indicator that a recession is imminent, and we haven’t seen that happen yet.

Housing Market Concerns

While the inverted yield curve is a bit more theoretical in nature, there are real economic data points that are showing signs of stress.

The housing market plays a huge part in economic activity, accounting for 15-18% of US economic activity on average.

Leading indicators in the housing market are showing reason to be concerned.

One of these is cancellation rates, as shown in the next chart from Redfin.

Cancellations happen when an accepted offer is withdrawn by either party.

In this case, the majority of cancellations are due to buyers backing out.

There are legitimate reasons for this happening:

  • Mortgage rates have increased, making it unaffordable for a buyer to proceed;
  • Property taxes have been reassessed higher, increasing the cost of housing;
  • People anticipating that prices may fall, causing buyers to withdraw offers.

Here’s a link to the article discussing cancellations:

The Deal Is Off: Home Sales Are Getting Canceled at the Highest Rate Since the Start of the Pandemic

Another reason for cancellations is a drop in consumer confidence, which has a big effect on economic conditions in the US.

Consumer Confidence

While the housing market is a large part of the economy, the consumer as a whole is much more important. Approximately 70% of the US economy is driven by the consumer in one way or another (this includes housing).

So when consumer confidence slows, economic activity typically slows along with it.

And the consumer is in the dumps right now, as shown in our next chart.

Right now, the consumer is the least confident they have been at any time in the past 60 years. This includes the Vietnam era, the inflation of the 1970’s, the tech crash, the global financial crisis, and COVID.

That is concerning.

But what does all of this tell us about the near-term direction of the market?

S&P 500 Index

All of the data listed above is not news to the market.

Despite these concerning data points, markets have rallied over the past seven weeks.

But the move higher since June looks almost identical to the one in March, as shown in the chart below.

Specifically, the pattern is a three-leg move higher into previous highs.

There was an initial leg higher, a move lower of roughly the same timeframe, then an extended move higher in both time and price.

The move in March followed the Ukraine invasion.

The move in June really didn’t have any catalyst, other than the overall market being incredibly pessimistic.

In addition to the S&P 500, nearly every major US stock index looks identical.

The next chart shows the S&P 500, the Russell 2000 small cap index, the Nasdaq Composite and the S&P Mid Cap index.

Every one of these indices are at the same resistance level. This means that the market thinks these levels are important.

Regardless of the reason for the move in June, it has been strong. Earnings reports have been more positive than expected, and the market is starting to predict that the Fed will become more accommodative and “pivot” by slowing the rise of interest rates.

If the market is going to do it’s own pivot and head back lower, it must do so very quickly.

If it breaks above this resistance area, then we can begin increasing equity exposure in client portfolios, at least for a period of time.

If it heads lower, then we should expect a fairly quick move to test the lows from June.

Bottom Line

While a big consideration for the market is the current recession debate, markets are extremely complex systems. Relying on only one data point for decision-making would be foolish.

When looking at a variety of data points, it truly is a mixed bag out right now.

Recent market strength and earnings reports have been mostly positive. As such, the market seems to believe the Fed will slow down the pace of interest rate increases. (Frankly, this expectation seems to be unwarranted, especially after today’s employment numbers.)

For now, the move higher over the summer appears to be a typical bear market rally. As such, we have been intentionally slow to add equity exposure.

Why?

Mainly because there is still plenty of upside if the market wants to keep pushing higher. For example, the Nasdaq is down nearly 23% this year, even after a big rally over the summer.

And big stocks like Google, Microsoft, Facebook and Netflix still have massive upside potential at current levels.

If the market can get above the levels noted in the S&P chart above, there starts to be more proof that this rally may be more than just another temporary rally.

But if we do go into a recession, all bets are off. And there are many indications to suggest we are headed in that direction.

Bottom line is that we believe it is prudent to underweight risk right now, given the massive uncertainties in the market and the economy.

Invest wisely!


Filed Under: IronBridge Insights Tagged With: Apple, Facebook, federal reserve, Google, interest rates, investing, markets, Microsoft, recession, risk management, stock market, stocks, volatility, wealth management

Mistakes are Expensive: Financial Planning for Gen X and Gen Y

July 6, 2022

Financial planning has evolved beyond investing assets.

The old model limited comprehensive planning to a wealthy few with high levels of manageable assets. For many people, their first engagement with a financial advisor was when they needed to create a retirement income plan.

The new fee-only model allows financial advisors with experience and knowledge to assist across the landscape of financial life. And a new generation with very different goals is taking advantage of all the elements to create plans that work for them.

  • Retire early, create “work optional,” or work part-time
  • Save for kids’ college
  • Enjoy life now – and save for the future
  • Invest in a second home or rental property

This generation has created high income and realizes they do not have to wait another 20 or 30 years to have the lifestyle they truly want.

They understand that financial planning is all about tools, tactics, and strategies that can be deployed in tandem to help them keep more of what they make and actively grow their wealth.

It’s about understanding the options, making the right choices for a highly individual path forward, and solving problems.

Cash Flow Planning is the Foundation

Budgeting is the buzzword – but not-so-secret – it doesn’t work.

It’s about making choices to keep spending in check, with almost a scarcity mindset. It is about current expenses and works best over a short-term time horizon.

Cash flow planning looks at the short-term and the long-term. It is a tool to help you make decisions that will help you achieve future goals.

The process helps you identify future income and expenses and plan for big-ticket items.

The result becomes part of your financial plan and dictates changes across your financial plan. Understanding and detailing your flows keeps your investments tracking. It ensures you are realistic about return opportunities and gets you thinking big picture, including minimizing taxes and protecting your assets.

Saving for Kids’ Education

If you haven’t started one yet – the sooner you get saving, the better.

They grow tax-free so that you can build a nest egg for education spending.

You can fund a 529 plan with up to $16,000 per year and still qualify for the annual gift tax exclusion – but you can also fund five years at once if you’re behind and want to catch up. They aren’t just for college – K-12 qualifies too.

Risk Management

Life insurance is critical to keeping your family’s lifestyle and goals on track.

For most people, a term life policy offers the ability to cost-effectively replace your salary during your prime earning years.

The rule of thumb is the policy should be 5-10 times your annual pre-tax income. It may also be time to think about an umbrella liability policy to protect your assets over and above your existing coverage.

But as your income increase – or the potential for income through equity compensation –  you want to be sure you minimize risk. An umbrella policy can provide the coverage you need, but it’s important to factor in the cost.

Retirement Savings

Maxing out retirement savings is the best way to lower your taxable income and increase your investment pool for the future.

If you have complex compensation that is bonus-based, you need a strategy to do this that takes into account the current volatile markets.

It’s Not a Rainy Day Fund – It’s a Sunny Day Fund

Having an emergency fund of 3-6 months of expenses in an accessible account is a solid place to start.

But once you’ve achieved that, are maxing out your 401(k), and saving for specific goals on the side, what do you do with excess income?

It’s all about your time horizon. While your emergency fund is in cash, your taxable investment is goal-specific, so having an account that you invest for opportunities can make sense. It can allow for growth, possibility, and above all – optionality.

Tax Planning Keeps Your Income in Play

All of the tactics we addressed above have one thing in common: tax planning. The theory behind effective tax planning is two-fold:

  • Reduce taxes this year
  • Reduce lifetime taxes

Tax planning touches every part of your financial life, and it is a series of tactical maneuvers combined with proactive actions. It’s thinking through the impact of every move with a tax lens. Because what you make is ultimately defined by what you keep.

The Bottom Line

Financial planning can help you make the right choices to move towards your goals, but selecting the right partner is important.


This work is powered by Seven Group under the Terms of Service and may be a derivative of the original. More information can be found here.

The information contained herein is intended to be used for educational purposes only and is not exhaustive. Diversification and/or any strategy that may be discussed does not guarantee against investment losses but are intended to help manage risk and return. If applicable, historical discussions and/or opinions are not predictive of future events. The content is presented in good faith and has been drawn from sources believed to be reliable. The content is not intended to be legal, tax or financial advice. Please consult a legal, tax or financial professional for information specific to your individual situation.

Filed Under: Strategic Wealth Blog Tagged With: cash flow planning, fee only planners, financial planners, financial planning

  • « Go to Previous Page
  • Go to page 1
  • Go to page 2
  • Go to page 3
  • Go to page 4
  • Go to page 5
  • Interim pages omitted …
  • Go to page 19
  • Go to Next Page »

Footer

LET'S CONNECT

  • Email
  • Facebook
  • Instagram
  • LinkedIn
  • Twitter

AUSTIN LOCATION

6420 Bee Caves Rd, Suite 201

Austin, Texas 78746

DISCLOSURES

Form ADV  |  Privacy Policy  |  Website Disclosures

  • Home
  • Difference
  • Process
  • Services
  • Insights
  • Team
  • Clients
  • Form CRS
  • Contact Us

Copyright © 2017-Present by IronBridge Private Wealth, LLC. All rights reserved.