We’ve all been there. (At least those of us with kids have been.)
The start of a long road trip. Everyone is excited to get going. Then you get 8 minutes into an 11-hour drive, and you hear the famous words emanate from the backseat…”Are we there yet?”
We’ve all been through bear markets too. (Although it’s been 15 years this month since the last real one began.)
Yesterday, markets had one of the largest reversal days in history.
Which begs the question…”are we there yet?”. Is this bear market over?
SPOLIER ALERT…the answer is pretty clear…no, we’re not there yet.
What about that Giant Reversal Day Yesterday?
Inflation data for September was announced yesterday morning. The CPI came in higher than expected, at 8.2% year-over-year. Markets expected a reading of 8.1%.
Last month, the same thing happened. And markets fell over 3% on the day.
Initially, it looked like we were going to see repeat of the damage. Markets fell hard in the morning, and were down over 2%.
But by the end of the day, all major US stock indices were HIGHER by more than 2%.
On the surface, this would seem like a good thing.
Markets heard bad news but rallied on it.
This isn’t the first time the market has had a big reversal like this.
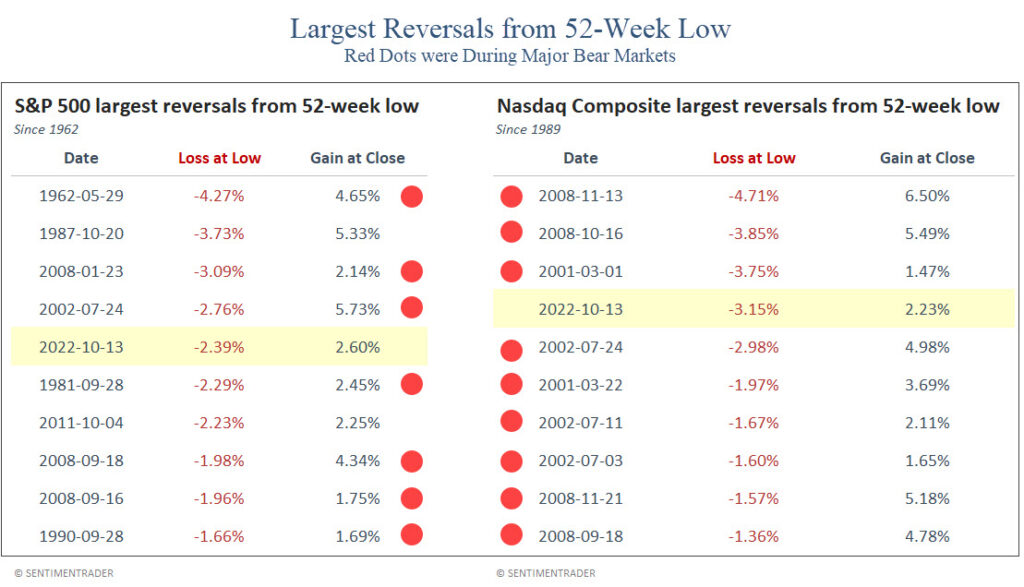
Our first chart shows the ten largest reversals when the the S&P 500 and the Nasdaq were each at respective 52-week lows, courtesy of SentimenTrader.
The red dots are times that this happened while the markets were in major bear markets.
What does this chart tell us about big reversals like we saw yesterday?
- 16 out of 18 previous events (excluding yesterday) occurred during deep recessions.
- 7 occurrences happened during the 2008 Financial Crisis
- 6 occurrences happened during the 2001-2002 Tech Bust
- All previous occurrences in the Nasdaq happened in 2001/02 or 2008. Both times the index lost over 60%.
- None of these events occurred at the lows.
During 2008, these events actually happened before things really started to unwind.
For the S&P 500, reversals happened once in January and twice in September of 2008. After the occurrence in September of 2008, the S&P 500 fell another 46%.
Reversals on the Nasdaq happened throughout the fall of 2008. After the first one occurred in September of 2008, the Nasdaq fell another 42%.
These events are not indications of hope. They are signs that things are broken.
Caution is still warranted.
High Inflation is not because of Supply Issues
Inflation is proving to be harder than the Fed expected to get under control.
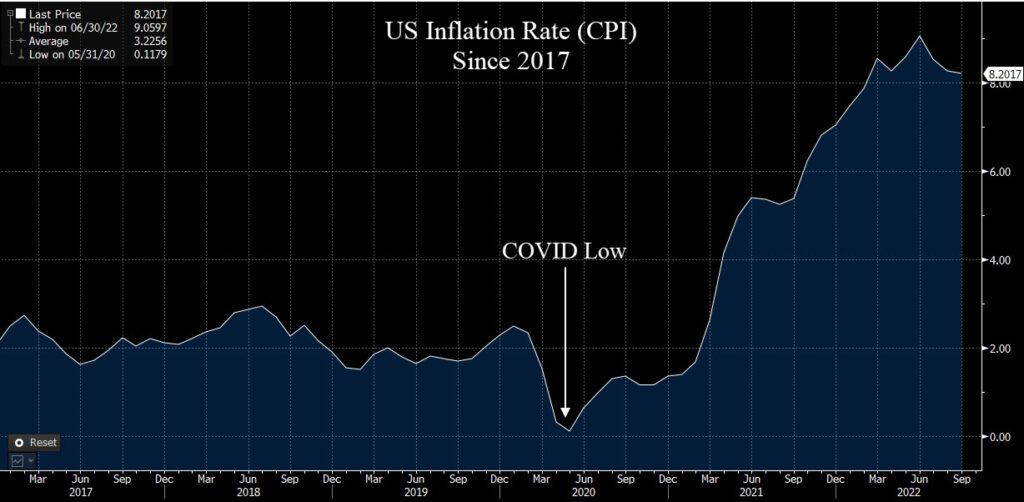
By looking at the past 5 years, we can definitely see the spike in inflation in the US, as shown below courtesy of Bloomberg.

The low on this chart was during the COVID lockdown. It has skyrocketed since.
One major factor after COVID is that there were problems in the global supply chain.
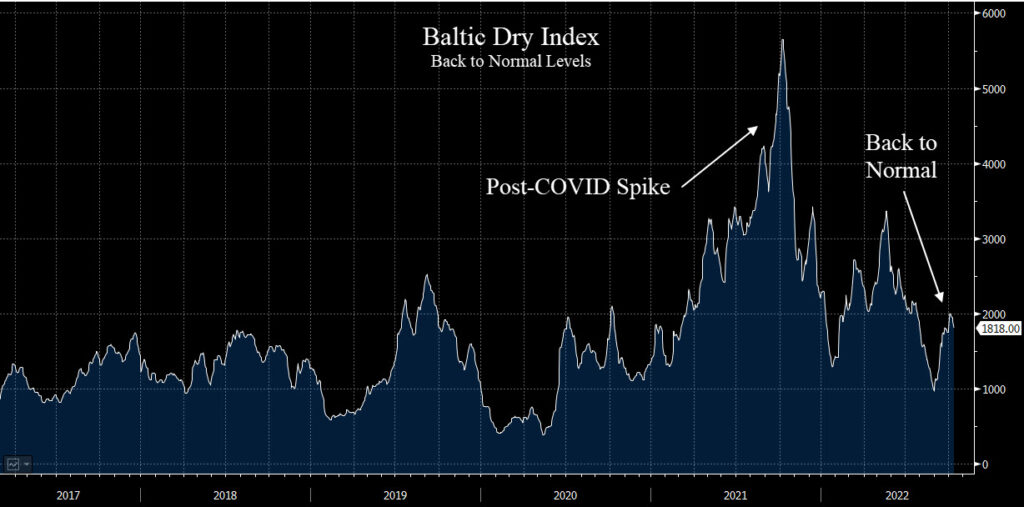
The Baltic Dry Index is a measure of the cost of shipping containers across the globe. When it goes up, it means that there are supply chain issues and great demand for ships.
This index is shown in the next chart.

The spike in this chart in 2021 was when there were massive bottlenecks at ports across the globe. At one point there were hundreds of ships waiting to get into the port at Long Beach, California.
But this index has moved back to pre-COVID levels.
This suggests is that inflation is NOT due to supply constraints. At least not on a global level.
For the most part, things are moving quite normally across trading channels.
So why is inflation high?
Components of Inflation
To understand the inflation numbers, we must understand the various data points that go into the CPI number.
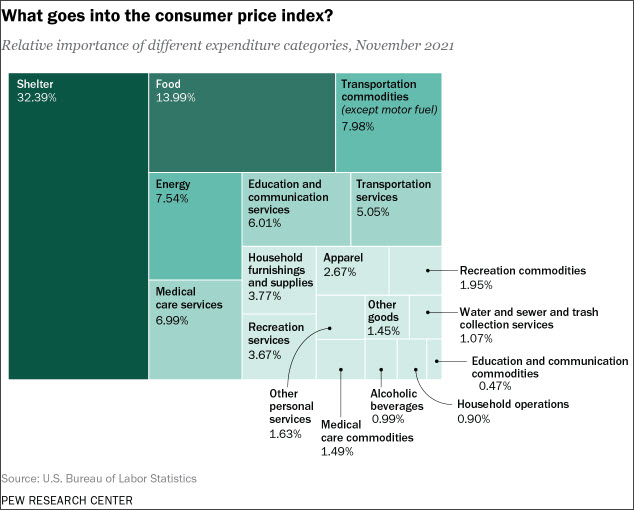
Here’s a helpful graph from the Pew Research Center that shows the various components of inflation.
Shelter, food, education, transportation and medical care account for 74% of the CPI numbers.
None of these are showing signs of weakening yet.
It’s tough for the CPI number to get to their stated goal of 2% if the largest inputs continue to go up.
This is why the Fed is so focused on the housing market.
At 32%, it is more than double the next largest component.
Energy prices are a decent-sized component at 7.54%, but they would have to fall by 90% to get the CPI where the Fed wants.
So they are attacking home values.
What would make home prices fall?
People get laid off. They can’t afford their monthly payment. There are fewer buyers because interest rates are too high.
The Fed essentially has a goal of crushing lower and middle class Americans.
In our previous report, “A Recession or Not a Recession”, we discussed the belief that the housing market will be the key to whether we see a major recession or just a mild one. Here’s a link to that report:
We stand by this thought.
The housing market has been showing some minor indications of weakness, but nothing like what the Fed wants to see.
Bottom Line
We have been pretty clear for the past few months that it appears we are in a major bear market.
We don’t see any reason to abandon that point of view.
That said, we should expect some fierce bear market rallies. And ones that last longer than one or two days.
But as of right now, there is very little reason to expect that we are near a major bear market low.
As always, please do not hesitate to reach out with any questions.
Invest wisely!


