He released the two seas, meeting side by side. Between them is a barrier neither of them can transgress.
– The quran 55:19-21
Financial markets work in cycles.
Some cycles are short, lasting only hours. Like those following Fed meetings.
Others, however, last decades.
And when longer-term investment cycles change, things don’t always mix well.
Like many characteristics of financial markets, we see this phenomenon in nature as well.
What implications will this transition of investment cycles have on financial markets?
The Meeting of Oceans
At the southern tip of South Africa, the warm currents of the Indian Ocean meet the frigid currents of the Atlantic Ocean, as seen in the illustration below.
Unlike geographic boundaries, the dividing line where these two oceans meet is determined by the CONDITIONS on each side of the line.
And despite their proximity, the composition of nearly everything in each respective ocean is different from one another.
Lifeforms, currents, temperatures, and mineral composition of the water all differ depending on which side of the boundary you look.
What is common place and normal under one set of conditions is abnormal and unusual in the next cycle.
Today, we are dealing with the transition from a falling interest rate cycle to a rising one.
The investment cycle, much like the meeting point of the Atlantic and Indian Oceans, is a place where forces collide, currents shift, and the landscape changes in unpredictable ways.
The transition between cycles is not always a clean one, either.
It can be messy.
This is because with longer-term cycles, investors become engrained in their belief that the underlying causes of the previous market cycle will continue into the next cycle.
Inflation & Interest Rate Cycles
The cycle we’re dealing with today is the inflation and interest cycle.
Historically, the full cycle lasts 60 years.
That’s 30 years of rising rates followed by 30 years of declining rates.
We can see this cycle on our first the chart below, courtesy of Tom McClellan.
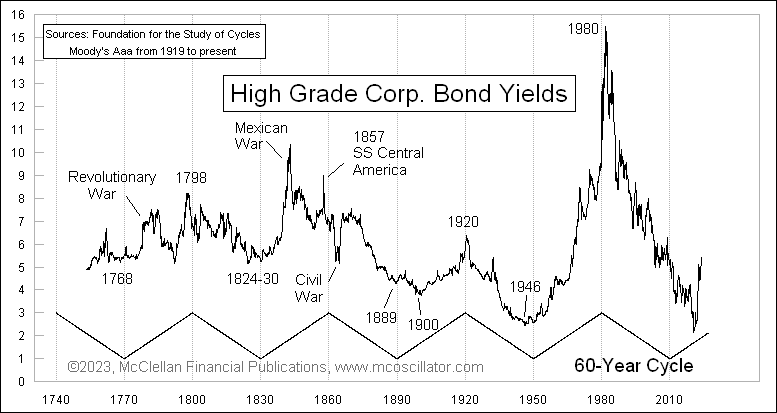
The declining interest rate cycle that likely ended last year is actually quite late getting started.
According to the 30-year cycle, rates should have begun moving higher in 2010.
But the Fed had a different idea, and placed their thumb on the scale to keep interest rates at zero for another decade.
The decline in rates began in 1982. And began moving higher again in 2022.
That’s 40 years of a financial tailwind of declining interest rates supporting higher and higher asset prices.
When interest rates fall, the cost of money decreases. And when the cost of money decreases, profits rise.
This creates a “virtuous circle” of investment, where the declining cost of debt makes investment projects more and more appealing as rates fall.
But the inverse is true also.
Rising interest rates push the cost of capital higher, putting downward pressure on profit margins.
This pressure on profits results in many stocks struggling to grow during rising rate environments, mostly due to the influence of interest rates on valuations.
Stock Valuations and Interest Rates
One of the easiest places to visualize the effect of interest rates on the stock market is via valuations.
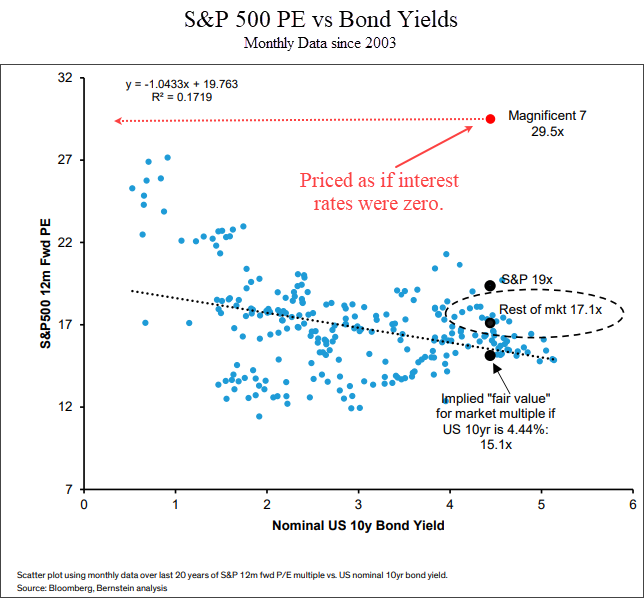
The next chart shows a scatter plot of the P/E ratio of the S&P 500 versus the 10-year US Treasury yield.
The yield of the 10-year Treasury is shows on the x-axis from left to right. The y-axis is the forward P/E ratio of the S&P 500 index.
Each blue dot shows the P/E ratio at the end of each month for the past 20 years, along with the corresponding 10-year US Treasury yield.
What this chart tells us is that there is a DIRECT correlation between interest rates and valuations.
And the formula is pretty easy: higher rates = lower valuations.
Most of the market is respecting this phenomenon.
The “Magnificent 7” is a term used for the largest seven companies in the index: Apple, Microsoft, Amazon, Nvidia, Meta, Google and Tesla.
This “Magnificent 7” is still trading as if interest rates were almost zero.
In the chart above, the red dot shows these seven stocks.
At an average valuation of 29.5, they are 72% more expensive than the rest of the S&P 500.
They may have better future growth prospects than other stocks, but this is still a very obvious data point where investors are assuming the lessons of the previous cycle will repeat in the next one.
The implication is that at some point in the next few months or years we should see reality start to set in for these big tech stocks.
That means that eventually we will start to see mid-caps, small-caps, international stocks and other investments start to outperform big tech stocks.
We’re seeing this in our system. We have recently added small caps, mid-caps and international stocks to client portfolios.
If interest rates put downward pressure on valuations, what does that mean bigger picture for the stock market?
Let’s look at the last two rising rate cycles for clues.
Rising Interest Rate Cycle (early 1900’s)
The last two times US markets experienced a rising interest rate cycle was in the 1970’s and the early 1900’s.
Let’s look at the early 1900’s first.
The next chart shows the Dow Jones Industrial Average from 1895 to 1925.
During this time, interest rates moved from a low of 3.7% to a high of over 6%.
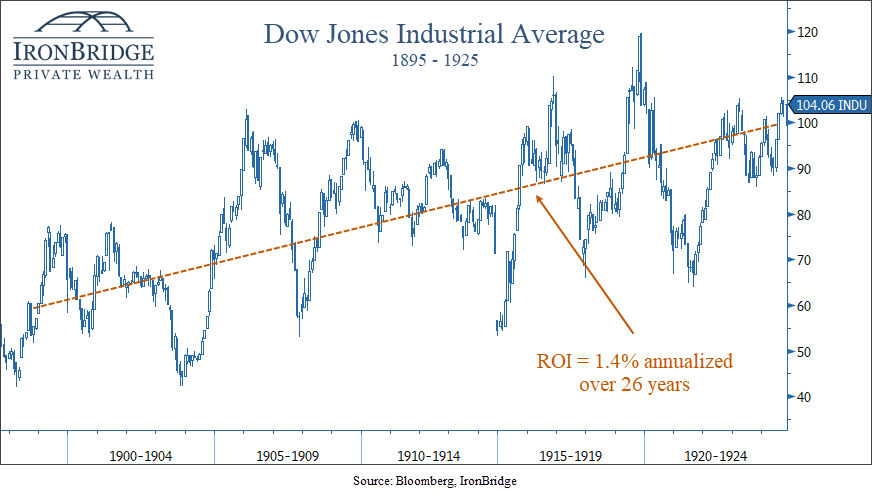
This was the last interest rate cycle that happened before the existence of the Federal Reserve.
Over this period, stocks returned a whopping 1.4% per year compounded return.
Not great.
Interestingly, both GDP and earnings grew over the same period of time, much faster than the overall growth in equities.
This is because higher rates kept valuations low compared to the low rates of the previous cycle.
That’s great, but can we really compare today’s world to the one 100 years ago?
After all, isn’t everything different?
Sort of.
The one common denominator is us.
Humans are the key to the investment cycle.
With all of our flaws, behavioral oddities and penchant for making the same mistakes over and over and over, we bring our inherent biases to our actions whether we know it or not.
Sure, we think we’re smarter. After all, we have all the information in the world at our fingertips via our smart phones. But we tend to use it to view cat videos. So are we really that much more advanced?
But we digress.
So what about a more recent rising rate cycle?
Rising Interest Rate Cycle (1970’s)
The last time the US economy went through a rising rate cycle was in the 1970’s.
How did this compare to the period in the early 1900’s?
Answer?
Not any better.
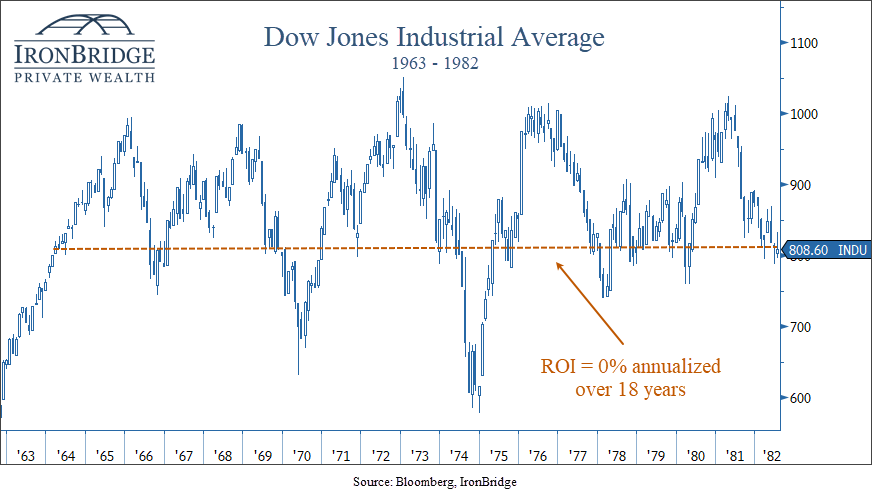
In fact, stocks returned 0% over nearly 20 years.
Stocks had a nice move higher post-WWII, but ran into the same valuation wall as it did in the early 1900’s.
Higher interest rates simply make it more difficult for stocks to grow over time.
There are many factors that go into the relationship between interest rates and valuations:
- High interest rates compete for capital. Cash paying 5% has attracted dollars that otherwise would have gone into stocks.
- The current value of a future stream of cash flows goes down as the discount rate goes up.
- Financing costs increase, reducing profitability.
One thing is for sure: we must pay attention as these cycles change.
Mini-Cycles Within the Larger Cycle
If we have indeed made the transition from a declining rate environment to a rising one, we should expect broad stock markets to struggle more than they did in the previous cycle.
In these environments, bull markets will likely be measured in months instead of years.
In both previous rising rate cycles, stocks had mini-bull markets that lasted from 24-36 months.
They were typically followed by bear markets lasting 18-24 months.
During the 1970’s, we saw 5 mini-bull markets, and 5 mini-bear markets, shown in the next two charts.
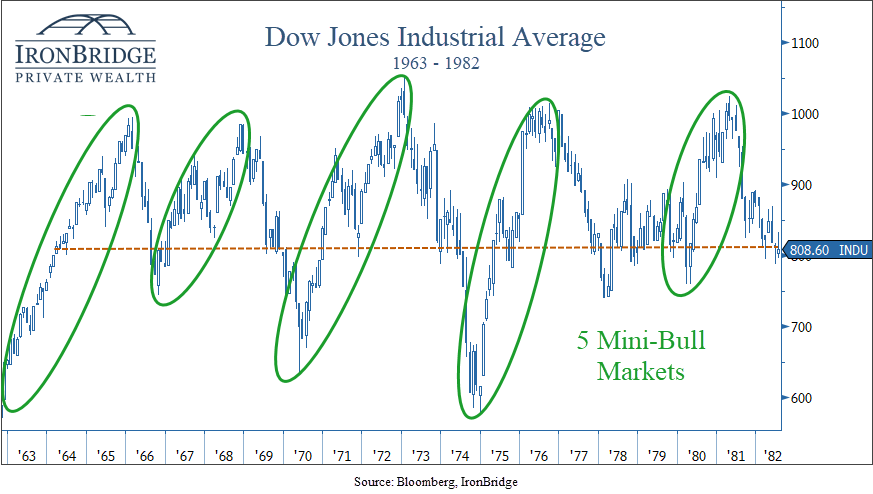
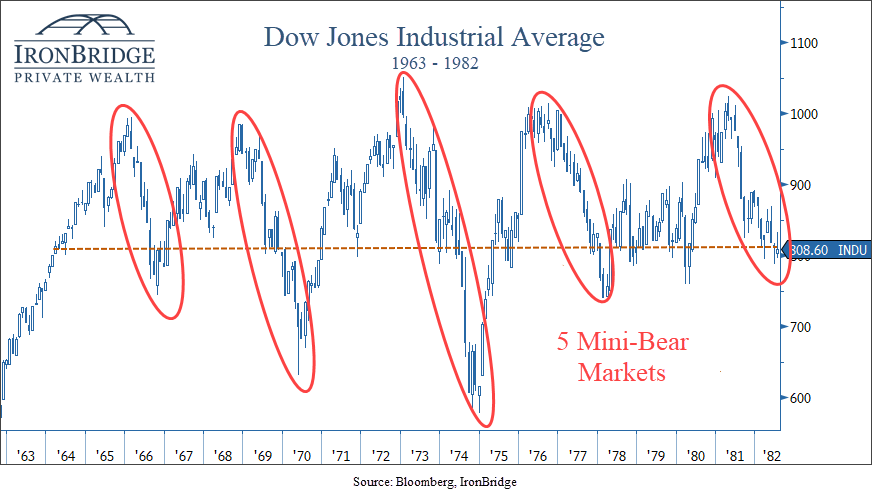
During each mini-bull market, prices met or slightly exceeded new highs on each subsequent move.
But each time markets would try to push to new highs, inflation would rise and a mild recession would occur. Stocks would fall to the low end of the range, and a mini-bear market would ensue.
This is the definition of a choppy market.
And this is the market that we may very well have over the coming decade.
Flash forward to today, and we’re in a bull market that has lasted 13 months thus far.
If the current cycle is anything like previous ones, we could see this mini-bull last a bit longer, possibly into mid-to-late 2024.
But chances are we should not expect a long-term bull market like we had during the 1980’s, 1990’s and 2010’s.
Bottom Line
The ebb and flow of interest rates and inflation create a dynamic environment that demands careful navigation.
In the coming years, it will become increasingly important to adjust exposure to risk based on non-emotional signals.
It will also become increasingly important to generate yield and not just rely on market appreciation to meet your financial goals.
A higher interest rate environment allows you to reduce risk and volatility over time.
But this rising interest rate cycle is not a two-year cycle that began in 2022 and ends in 2023.
Higher interest rates will likely be with us for many years into the future.
Invest wisely!


