
As we enter 2021, we turn our focus to things that could change the current bullish environment. Two main risks may emerge as the market continues its push higher: Valuations and the Fed.
“Life is a cycle, always in motion, if good times have moved on, so will times of trouble.”
-Indian Proverb
What a year.
And we’re only 8 days into it.
We read a meme online this week that said, “I tried the 7-day free trial for 2021, and I’d like to cancel it please.”
2020 was quite the year too. Just when we thought it was in the rear-view mirror, events remind us that the new year is more of a mental construct than any kind of actual barrier or turning point.
What may happen in 2021? How long can this bullish market environment last? What should we be watching for?
2020 Review
First, let’s briefly review the chaotic year of 2020.
A year ago, if someone told us that there would be a global pandemic that killed millions of people worldwide, GDP fell by a whopping 33% at one point, there were riots across the country, the presidential election was contested, and a mob stormed the US Capitol, what do we think the markets would have done?
Obviously, the majority of those surveyed would almost all say that markets were in total chaos. We would likely have predicted that market would be 40-50% lower, if not more.
But what happened?
- The S&P 500 rose 18%.
- The Nasdaq rose an amazing 43%.
- The Dow Jones rose 9%.
- Bonds rose over 7%.
These are not returns we would normally associate with a chaotic environment.
Which brings up an interesting question: What if the COVID market crash in March was just an exogenous anomaly?
At the time, it all seemed very logical. The forced shut down of the US and global economy had a real, tangible effect on markets. The subsequent rally, fueled by central banks across the globe, lifted financial markets, while having very little impact on those truly affected by the virus.
Generally speaking, markets have both internal and external influences. External, or exogenous, influences include things like COVID, terrorist attacks, assassinations, etc. While internal, or endogenous, influences are things within the market structure that affect prices, such as the Fed and the financialization of real estate prior to 2008.
Most investors believe that external factors have the most influence on asset prices. But throughout history, external events tend to have only fleeting impacts on markets. COVID may very well end up being another one of these exogenous events.
Let’s look at a chart to illustrate the seemingly temporary impact of COVID on asset prices.
The first chart below is the S&P 500 Index since mid-2018. The big spike downward is what we refer to as the COVID crash. The second chart simply removes the three months around this crash.
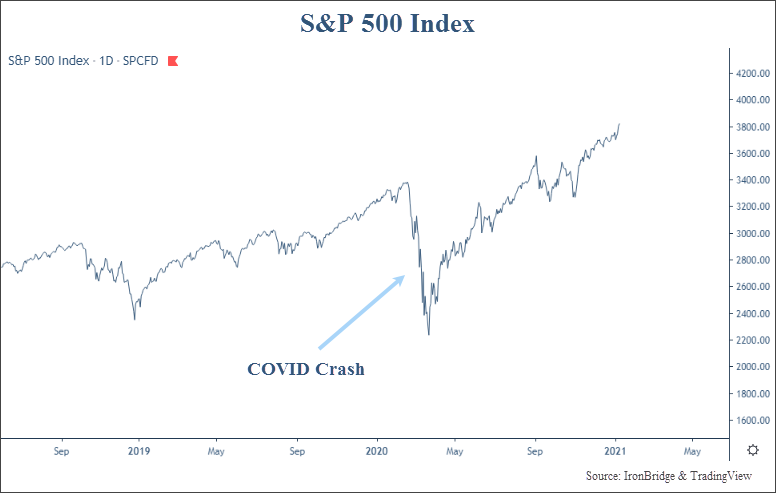
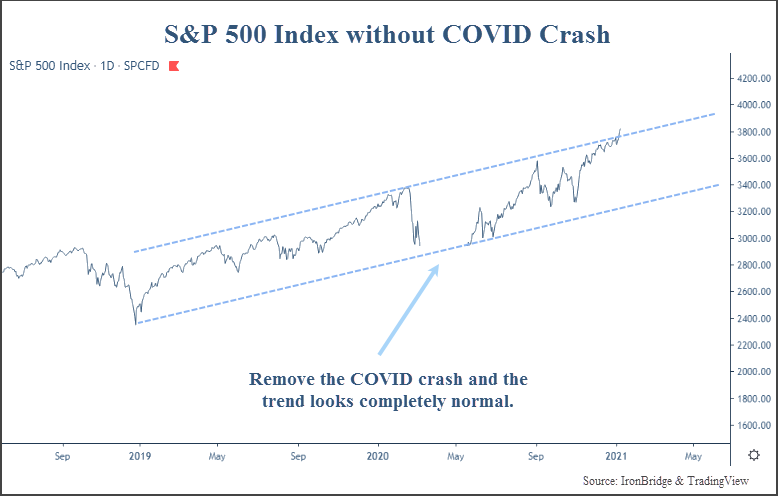
By removing the panicked, crash environment in March and April, the market appears to have simply gotten back on track to the trend it had before COVID-19 showed up.
Of course, we cannot simply remove parts of history that we don’t like. There is valuable information in the data removed from the second chart that helps give context to the current environment.
However, COVID absolutely classifies as an external influence to markets. This crash was not the result of a build-up of excesses. It was not the result of the financial sector being massively over leveraged to real estate like in 2008. It was not the result of tech stocks being massively overvalued when the Nasdaq doubled in 3 months to end the tech bubble.
The COVID crash is frankly a textbook exogenous event. It was unexpected and wreaked havoc, but it will likely be temporary. If the market is assuming that it is temporary, it makes sense that it is looking beyond the next few months.
The more important thing that the the 2020 crash did was it amplified two major risks in 2021 and beyond: valuation risks and Fed liquidity risks.
Valuation Risks
By any measurement, valuations on the equity markets are extremely high today.
There are multiple ways to measure valuations in the stock market:
- Price to Earnings (P/E) Ratio
- Price to Sales Ratio
- Price to Book Value
- Price to Earnings Yield
Today, every one of these are at or near all-time highs. Or at least they are higher than 98% of the readings that have ever occured.
Let’s look at the most common measure of valuation in stocks, the P/E ratio. This ratio measures the price of a stock (P) to the earnings per share (E) of a particular company.
The chart below shows this ratio for the broad market since 1870.
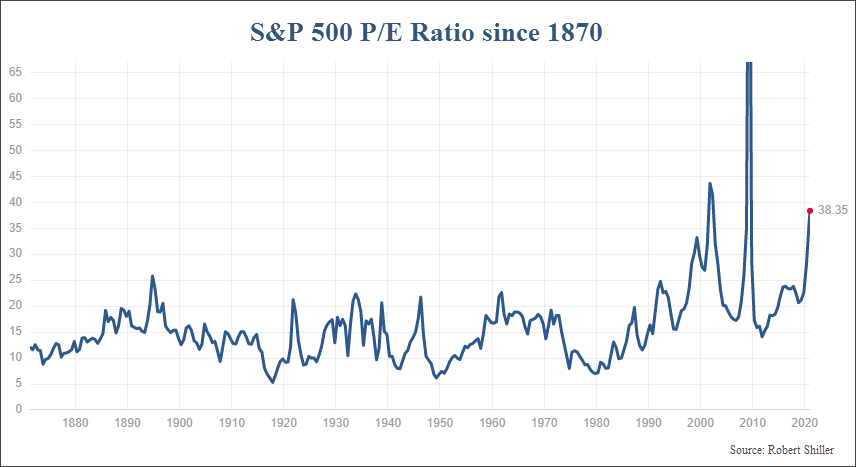
With a current reading of 38.35, it is higher than only two other time in history.
One might suggest that it would be a good opportunity to sell based on this overvaluation.
We disagree. Valuations are an excellent way to view the potential risks in markets, but they are a terrible tool to make a buy or sell decision on.
Prior to the year 2000, valuations ranged from a low of 5 to a high of 22. If someone used the P/E ratio to make a buy or sell decision, they would have sold in the late ’80s or early 90’s, and would have missed an entire DECADE of returns, as shown the next chart below.
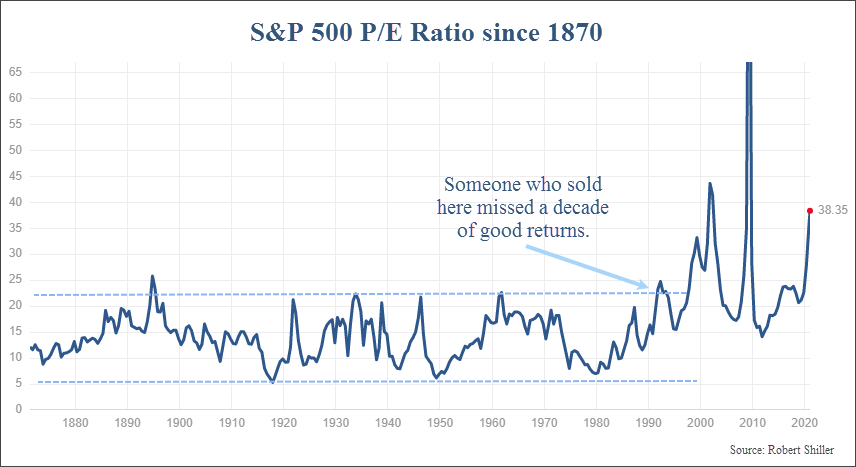
Selling at other times when valuations were extreme were also not great times to sell. Every time the market reached the upper dotted line in the chart above (the mid-1890’s, early 1920’s, late 1930’s, late 1940’s) all resulted in poor times to sell. It resulted in tremendous missed opportunities. And if you waited until valuations became extreme to the downside, you missed decades of investment opportunity.So what should we do? Just ignore valuations altogether?
Not necessarily.
Valuations by themselves are fairly useless. And by “fairly” we mean “very”. A stock can remained undervalued for years. And a stock can also remain overvalued for years.
But valuations can provide context to help determine where we might be in an investment cycle.
For periods with higher valuations to become more “normal”, it requires either prices to fall or earnings to rise.
After the last two periods of overvaluation in 2000 and 2007, prices fell. Of course, earnings also fell since the economy was in a massive recession each time. But prices fell fast than earnings, so the P/E ratio also fell.
But this is not always the case.
Following the overvaluation in the early 1960’s, prices did not fall. They went sideways for nearly 20 years. Earnings eventually caught up to prices, and P/E ratios fell as the “P” stayed the same and the “E” rose.
So just because valuations are high doesn’t mean prices should fall. It means that we should be alert for a change in trend, but it does not mean that we should flat out sell.
When looking at today’s landscape, extreme valuations can be seen everywhere. Tesla is a prime example.
Tesla stock rose more than 700% in 2020. It made Elon Musk the richest man in the world yesterday. In fact, it has risen over 1,000% from the March lows.
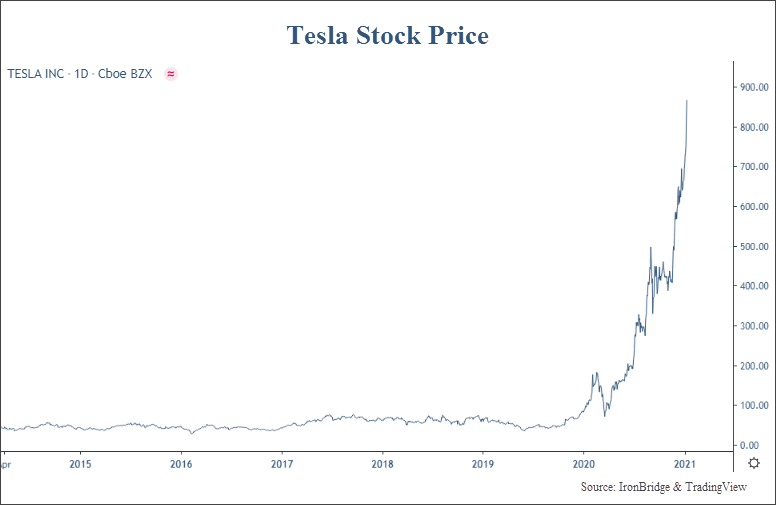
So far in 2021, the total value of Tesla stock has increased more than the total value of GM and Ford combined. It has not achieved a value more than GM and Ford combined, it has increased more than the two combined. And that’s only this week.
People thought it would fall at $200 per share. And at $400. And at $600. Rinse and repeat. At some point they may be right. But no one knows from what level the price will ultimately reverse and move lower or move sideways.
But we don’t need to know when that may happen. We only need to know that these are indications of frothiness. They are not indications that we should massively raise cash immediately.
They are indications, however, that you should have stop-losses and a pre-defined exit strategy.
And those stop-losses should be rising in conjunction with the prices each of your investments. High valuations are indicative of a late cycle environment, and these environments have the potential for danger.
Anything can pop the bubble of high valuations. But it is usually something from within the market itself that ushers in the next bear market. COVID tried to pop the bubble, but appears to have failed. In fact, valuations seem to have benefitted from COVID. Go figure.
So what could cause the market to fall, and valuations get back to normal levels?
Ironically, it is the same thing that could keep valuations high for an extended period of time.
The Fed.
We’ve talked about the Fed a LOT in this newsletter. And you should probably expect us to continue to talk about it.
Risks from the Fed
In our view, markets could continue to move higher for quite some time. But they also could turn lower tomorrow and begin a multi-year decline.
So here is our formal 2021 prediction: we have no idea what is going to happen.
For our clients and longer term readers, you’ve heard us say this before. It’s okay to not know what is going to happen. In fact, it is more dangerous to think you know the outcome when dealing with complex systems than it is to admit you don’t know and prepare for multiple outcomes. It simply depends on how the markets view the Fed’s ability to keep prices propped up.
For now, the market is resilient. The Fed is turning events that seemingly should startle the market into non-events that simply have no effect on prices whatsoever.
The best sign of a bull market is when prices rise in the face of bad news. We have that in spades right now.
However, we don’t know how long this will last. We do know that it will not go up in a straight line, that there will be volatility, and that at some point we will likely enter into a new phase of extended price declines. Worse than what we saw in the COVID crash.
But what would the Fed do to start the next down market?
First, the Fed could make a policy mistake. Markets are watching every move the Fed makes. Policy mistakes could include raising rates too fast, or providing guidance that is unexpected to the market. They could push too much money into the financial system and cause hyperinflation. They could intervene in currency markets and cause imbalances that cause ripples throughout the globe.
Second, a new Fed chair could emerge who causes uncertainty. The current Fed chairman, Jerome Powell, holds this position until 2022. President Biden may choose to reappoint Mr. Powell, but will likely appoint his own chairperson. He announced that former chairwoman Janet Yellen would be his Treasury Secretary, so it appears on the surface that he wants to keep the current policy of easy money around for a while.
Third, the market may simply come to the determination that enough is enough. Trillions of dollars of money printing will have consequences at some point. The further we go along the current path of obscene money printing, the more dire the future consequences in our opinion.
So at some point, we will need to take steps to preserve assets for our clients and have large allocations to cash and other non-stock assets. But that time is not now.
As we start 2021, the market continues the trend of 2020 and is moving higher in the face of bad news. At some point, maybe 2021 is opposite and moves lower on good news.
In the meantime, markets continue to make all-time highs, and the trend is higher. This trend should be respected until proven otherwise. It could remain higher for longer than any of us think possible.
Until then, we will continue to look for both opportunities and dangers, and adjust to whatever 2021 may bring.
Invest wisely!
Our clients have unique and meaningful goals.
We help clients achieve those goals through forward-thinking portfolios, principled advice, a deep understanding of financial markets, and an innovative fee structure.
Contact us for a Consultation.
Neither the information provided nor any opinion expressed constitutes a solicitation for the purchase or sale of any security. The investments and investment strategies identified herein may not be suitable for all investors. The appropriateness of a particular investment will depend upon an investor’s individual circumstances and objectives. *The information contained herein has been obtained from sources that are believed to be reliable. However, IronBridge does not independently verify the accuracy of this information and makes no representations as to its accuracy or completeness. Disclaimer This presentation is for informational purposes only. All opinions and estimates constitute our judgment as of the date of this communication and are subject to change without notice. > Neither the information provided nor any opinion expressed constitutes a solicitation for the purchase or sale of any security. The investments and investment strategies identified herein may not be suitable for all investors. The appropriateness of a particular investment will depend upon an investor’s individual circumstances and objectives. *The information contained herein has been obtained from sources that are believed to be reliable. However, IronBridge does not independently verify the accuracy of this information and makes no representations as to its accuracy or completeness.
