We hate year-end predictions.
Maybe “hate” is the wrong word…it is far to kind.
We absolutely despise the cringeworthy year-end predictions that accompany this time of year. (Feel free to imagine other colorful adjectives we may use to describe them.)
Why?
- Because they are worthless.
- There is no accountability whatsoever for those who make them.
- There is no way to accurately predict such a complex system as the global financial markets with any consistency, other than using the most commonly occurring outcome of an historical return bell-curve.
- Did we mention they were worthless?
Case in point…the six largest investment firms in the world missed last year’s performance by nearly 20 percentage points on the S&P 500. Oof.
Our apologies in advance if you’re looking for our wild-ass guess expertly modeled estimate of what the S&P 500 will be on December 31, 2022.
As our clients hopefully know, we don’t try to predict what will happen. Instead, we try to listen intently to the markets and let our rules drive the investment decisions.
So instead of sharing our predictions, let’s instead share the five themes we’re tracking for the upcoming year.
Theme 1: The Fed
For those who regularly read our reports, there’s no surprise here that the Fed holds the top spot in themes we’re watching this year.
The Fed is the Alabama Crimson Tide of the financial world. They are always among the top few drivers of what will happen during the season. And unless you’re on the team or an alumni, most people are pretty tired of you by now.
More accurately, the Fed IS the driver of the market. It has been since 2009. So we MUST pay attention to what they are doing.
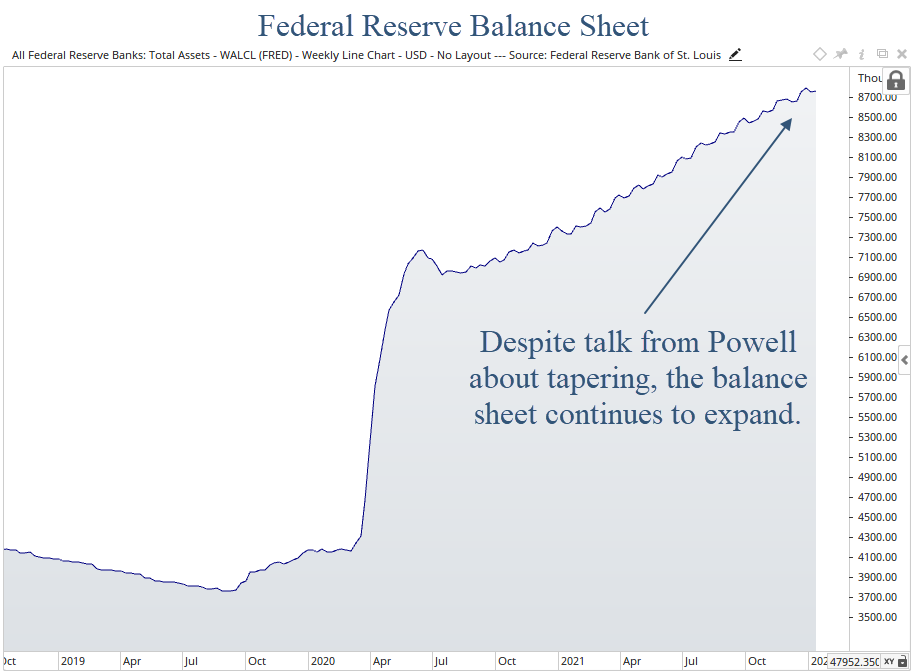
Right now, despite the talk from Chairman Powell about tightening and raising rates, they are still expanding their balance sheet.
The increase in the Fed’s balance sheet is the single biggest contributor to both the increase in the stock market, as well as the re-emergence of inflation across the globe.
It is also a reason why we’ve only seen minor pullbacks since COVID began.
The eventual reduction by the Fed is very likely to lead to a much choppier environment for stocks, and at some point an outright bear market.
Whether that happens in 2022 or not is anyone’s guess.
But as of right now they are scheduled to begin reducing their balance sheet this year, not just slowing down the increase of it.
Paying attention to global markets when the Fed ACTS, instead of when they SPEAK, will be key for risk assets this year.
Theme 2: Inflation
The second theme to watch this year, and the natural follow up to the Fed, is inflation.
We’ve all seen it recently. From cars to steaks to milk to $10 packets of bacon. Everything costs more.
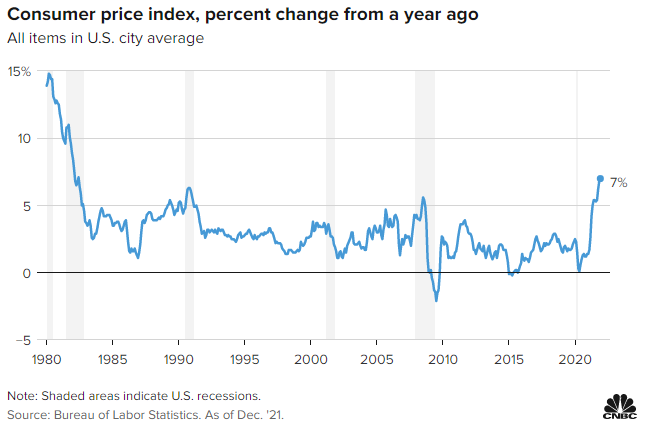
In fact, inflation just recorded the largest year-over-year increase in 40 years. It rose 7% in the past 12 months, as shown in the chart below.
On the surface, this looks ominous. We haven’t seen an inflationary environment since the 1970’s, and that decade was not a good time to passively invest in stocks.
However, our belief is that inflation will not increase and stay at elevated levels.
Instead, we think it will occur in waves.
We wrote about inflation numerous times last year (click to read):
- The Coming Inflation Waves
- Increased Gas Prices Signal both Post-COVID Norm and Inflation
- The First Wave of Inflation is Receding
Lumber is a good example of our inflation-wave thesis.
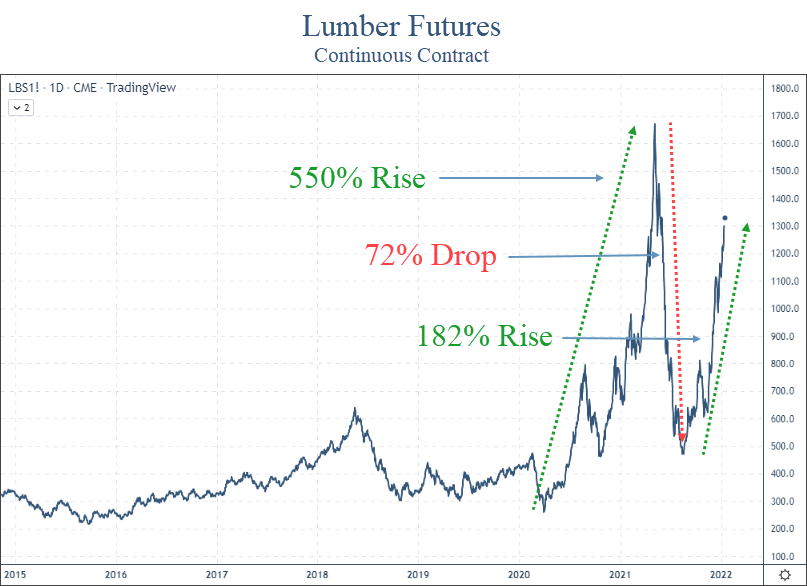
After skyrocketing the first part of 2021, lumber prices subsequently collapsed. Now, they are skyrocketing again.
Take a look at the extreme moves in lumber recently.
This chart is pretty amazing. We’re talking about the price of LUMBER. Not some phantom crypto-coin being schlepped by a Kardashian.
Lumber is an excellent case study for this environment. There are demand influences, supply chain issues and quality differences in various types of lumber that contribute to this massive volatility. And for the most part, it does not have governmental influences on it like the cost of healthcare does.
Inflation has far-reaching ramifications. Not only for asset prices and the economy, but for society as a whole.
Higher prices hurt consumers. They hurt businesses without pricing power. They cause massive price adjustments in all sorts of areas. Inflation also has massive political implications as a disgruntled populace focuses its frustrations on political leaders.
This quote by John Maynard Keynes is fairly long, but worth the read:
By a continuing process of inflation, governments can confiscate, secretly and unobserved, an important part of the wealth of their citizens. By this method they not only confiscate, but they confiscate arbitrarily; and, while the process impoverishes many, it actually enriches some. The sight of this arbitrary rearrangement of riches strikes not only at security, but at confidence in the equity of the existing distribution the system brings windfalls, beyond their deserts and even beyond their expectations or desires, become ‘profiteers,’ who are the object of the hatred of the bourgeoisie, whom the inflationism has impoverished, not less than of the proletariat. As the inflation proceeds and the real value of the currency fluctuates wildly from month to month, all permanent relations between debtors and creditors, which form the ultimate foundation of capitalism, become so utterly disordered as to be almost meaningless; and the process of wealth-getting degenerates into a gamble and a lottery.
– John Maynar Keynes
Sounds pretty applicable to today. It was written in 1920.
We don’t expect inflation to cause massive societal disruptions this year, but we sure can see the foundation being laid for that to happen.
Inflation needs to be near the top of things to watch this year. And the coming decade for that matter.
Theme 3: Interest Rates
The third major driver of markets and the economy is the prevailing interest rate environment.
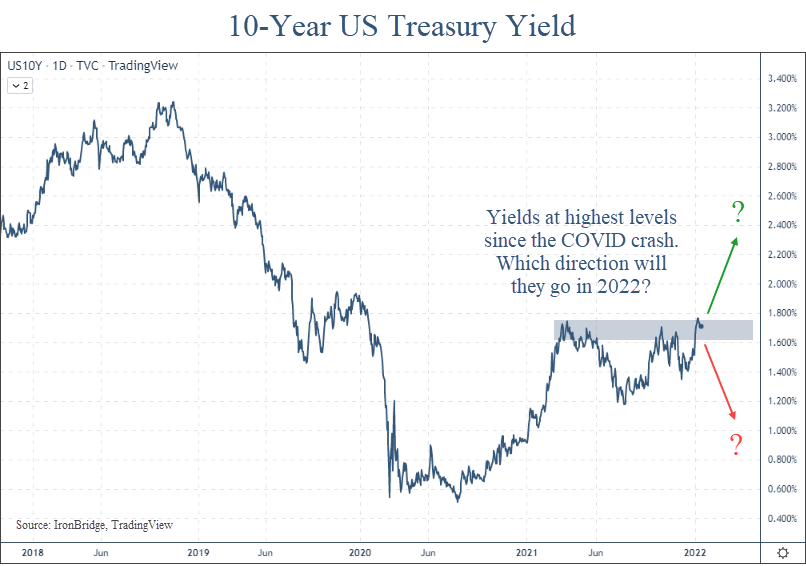
The COVID Crash in March 2020 pushed yields to their lowest levels in history. Not just recent history. All-time history. In the entire history of recorded financial records, dating back to ancient Egypt 4000 years before Christ, interest rates were never lower than they were two years ago.
Since then, they have marched higher. And they are currently trying to move beyond their highest levels since COVID began, as shown in the next chart.
Higher interest rates affect many areas. Real estate, fixed income markets and global currencies all have some sort of tie to interest rates. Not to mention more complicated instruments like derivatives and futures contracts.
Stocks are a bit different.
Higher interest rates aren’t necessarily bad for stocks all the time.
In fact, stocks tend to do just fine when rates rise.
The next chart, courtesy of LPL Financial’s Ryan Detrick, shows the performance of the S&P 500 each time the 10-year yield has risen by more than 1.00% (or 100 basis points).
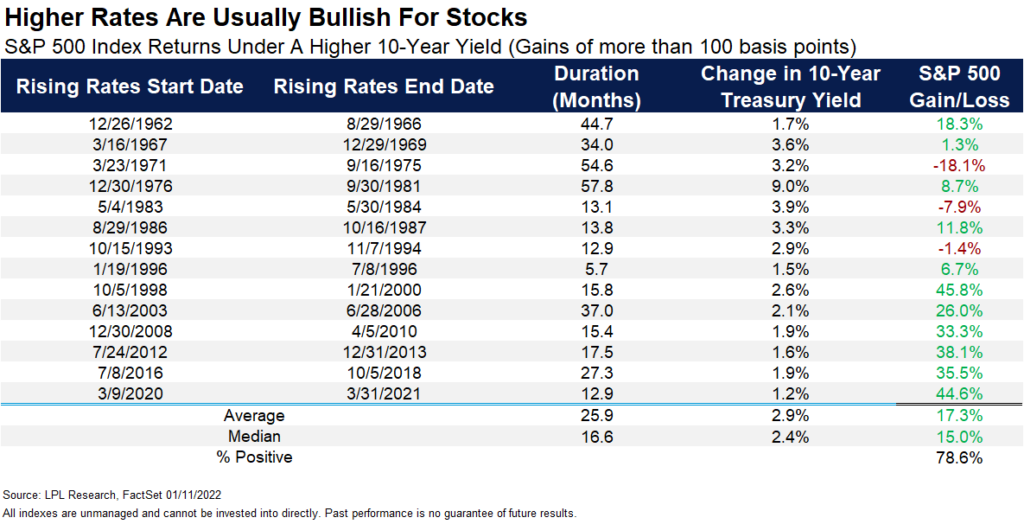
Since 1962, there have been 14 times when the 10-year Treasury yields has risen by more than 100 basis points. Stocks were higher 11 of those times by an average of 17.3%.
Granted, most of these periods occurred during the massive bull market we’ve had over the past 40 years, but this is still an impressive statistic nonetheless.
While parts of the market are likely to suffer as interest rates rise, we shouldn’t assume that higher interest rates will automatically make stocks go down.
We are likely to find out if this holds true again this year.
Theme 4: Risk Makes a Comeback
The S&P 500 had an excellent year in 2021. CNBC and most financial news outlets primarily focus on the performance of this behemoth index.
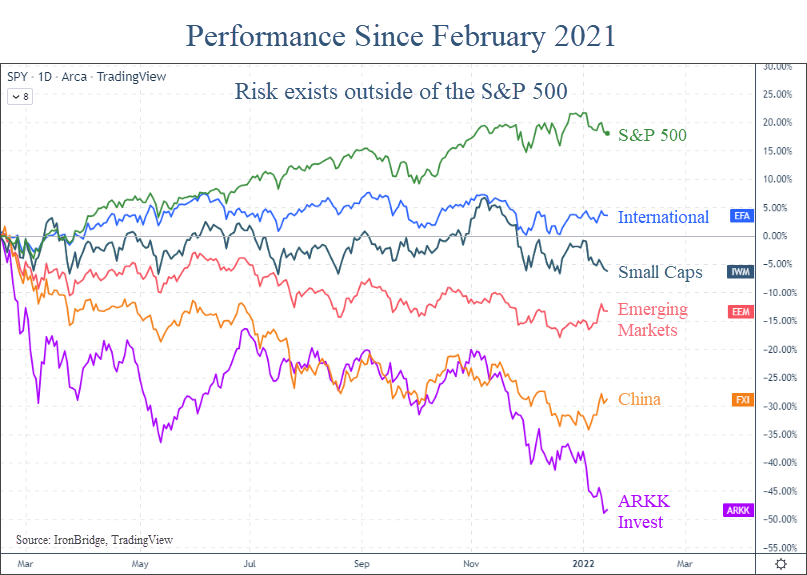
But last year did have its share of risk if you looked outside of the large cap growth stocks.
The chart below shows the performance of various assets since last February.
The S&P is the leader by far. It was up almost 22% before the turn of the new year, since last February alone.
However, other assets didn’t perform so well during that same time:
- International stocks were barely higher (Up 3%)
- Small Caps lost value (Down 7%)
- Emerging Markets down big (Down 13%)
- China was substantially lower (Down almost 30%)
- Even the high-flying ARKK investment ETF, run by Cathie Wood and epitomizing the speculative edges of the markets, fell by nearly 50% since last February.
- Bitcoin is down nearly 40% in the past two months (not shown on the chart above). Not what we consider to be an effective a store of value, especially with inflation at 7%.
Why did the S&P returns exceed other areas of the market so much?
Simple…nearly 30% of the index is in the top 5 stocks. And those stocks did amazingly well last year.
The rest of the financial world experienced weakness or outright bear markets already.
The main question for this year is whether the rest of the world can do well if the top stocks in the S&P 500 do poorly.
If they can, which is an excellent possibility, then there will be more opportunity in owning things outside of the big tech companies. In our view, this is the likely path forward.
But if they can’t, and the rest of the world remains weak while the heavy lifters in the S&P 500 deteriorate, then it could be a difficult year across the board.
There are mixed messages here, and the answers are not clear. So you must adapt as the things develop, whether they become bullish or bearish.
Theme 5: Another Damn Election
It’s a mid-term year, and the fully saturated political environment is going to soak us once again.
In an ideal world, politics shouldn’t influence asset prices. But in our world they do.
Remember the performance of Chinese stocks from the chart above? A number of Chinese companies have excellent business models, fantastic customer bases and thriving businesses, but political influences caused massive declines in the performance of their stock last year, and it brought down the entire stock index in that country.
With this being an election year, there are some key areas of the market that could be made into whipping boys this year.
The two most likely targets? Big Tech and Big Oil.
We’re starting to hear rumblings from Washington about their intentions.
The big social media companies are scheduled to testify to Congress soon. And our beloved politicians won’t miss the opportunity to send an outlandish quote hurling through the echo chamber to get on the front page nationwide.
Same with big oil. We’re already hearing from President Biden that oil companies are gouging the American people. Maybe he’s right, maybe not. But we should expect them to be a target this year as well.
Despite of whether there is political influence or not, midterm election years tend to have increased volatility on average.
The next chart, again courtesy of LPL Financial, shows This chart shows the average return of each year of the 4-year Presidential Cycle since 1950.
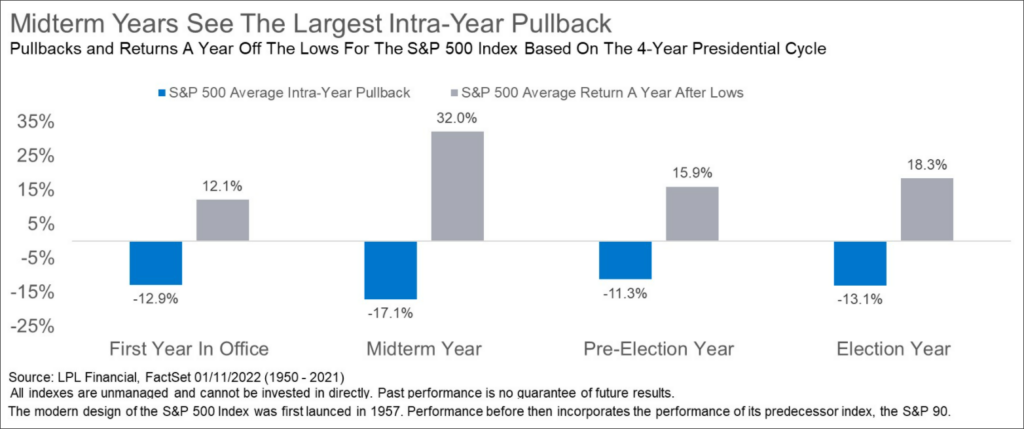
Specifically, it shows that Midterm years have an average drawdown of 17% during the course of the year.
It also shows that on average, stocks are higher by 32% a year after the lows.
While each year has its own specific characteristics and abnormalities, the Presidential Cycle data suggests we should see some volatility this year, but should expect a nice recovery.
Bottom Line
Bottom line, the market is finishing up a strange year in 2021. The S&P 500 did great, but other areas didn’t do as well.
And markets are off to a fairly rocky start to the year so far. But the overall trend still remains higher, at least for now.
Where the market ends up at the end of the year is anyone’s guess. But we’ll keep adjusting portfolios as the data warrants, and will work hard to both protect and grow your hard-earned wealth.
Invest wisely!

