• Skip to main content
  • Skip to footer

IronBridge Private Wealth

Forward with Confidence

  • Home
  • Difference
  • Process
  • Services
  • Insights
    • IronBridge Insights
    • Strategic Wealth Blog
    • Strategic Growth Video Podcast
    • YouTube Channel
  • Team
  • Clients
  • Form CRS
  • Contact Us

Ukraine

Ukraine War: Portfolio Update

March 4, 2022

We shared two other reports this week regarding the Ukraine War:

  • Informational Resources: View Report
  • Market Update: View Report

Today, we’ll give a brief update on our clients’ portfolio positioning given the uncertainties in Ukraine.

This report will be brief. Please reach out to us directly if you would like to discuss your individual portfolio in more detail.

We will provide another market update next week.

For now, let’s focus on three primary asset classes:

  1. Cash
  2. US Equity
  3. International Equity

We will look at two basic portfolios today: Balanced and Aggressive Growth.

We do have clients with custom portfolios, so please reach out if you would like a detailed snapshot of your account.


Balanced Portfolios

Let’s look at balanced portfolios this year.

Specifically, let’s look at the change in allocation from the start of the year.

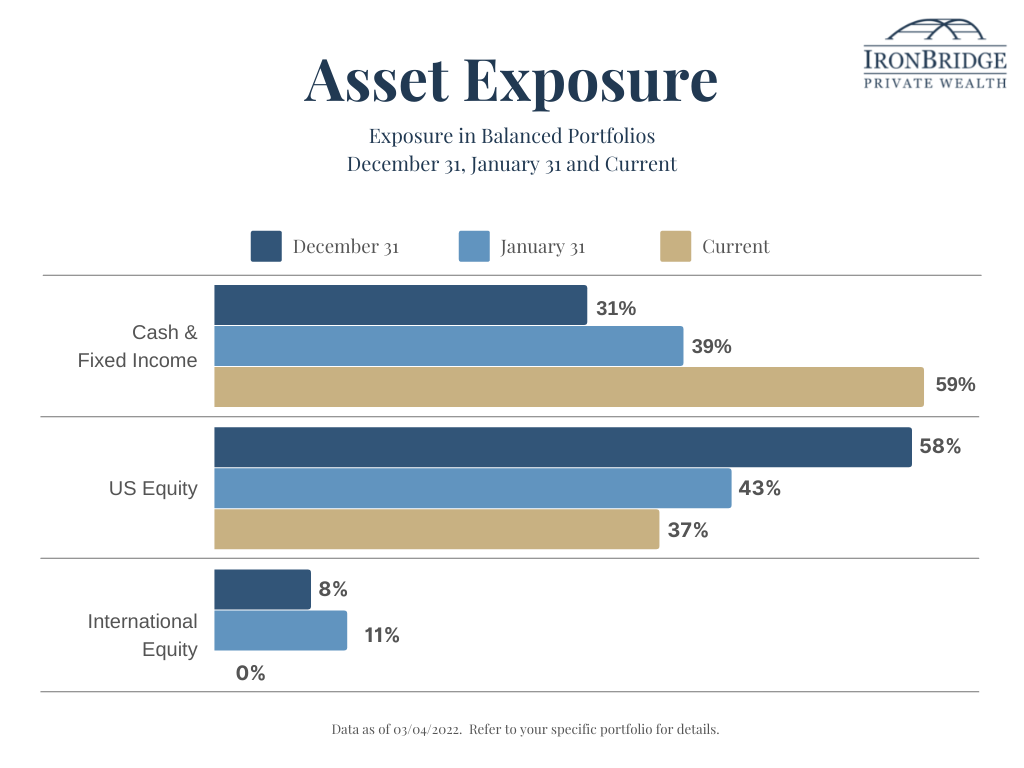
The chart below shows three major asset groups (Cash/Fixed Income, US Equities and International Equities), and how much of a balanced portfolio was invested in each on three different points this year:

  • December 31
  • January 31
  • Current (March 4)


In this chart, the dark blue is the exposure to each asset class on December 31st. The lighter blue shows exposure on January 31st, and the gold is the current allocation to that asset class.

Broadly, this chart shows the following changes from the end of last year to now:

  • Cash/Fixed Income: increased from 31% to 59%
  • US Equity: decreased from 58% to 37%
  • International equity: decreased to 0% once Russia invaded Ukraine.

Since the start of the year, overall stock exposure (US plus International) fell from 66% to 37%.

This is very large increase to safer assets this year, especially given that there has only been roughly a 10% decline in the S&P 500 so far this year.

Now, let’s look at the same chart for more aggressive portfolio.

Aggressive Portfolios

Here is the same chart as above, only for portfolios that are more aggressive.


This tells the same story:

  • Cash/Fixed Income: increased from 6% to 40%
  • US Equity: decreased from 82% to 55%
  • International equity: decreased to 0% once Russia invaded Ukraine.

For both portfolios, clients should expect to see lower volatility now than in the first few weeks of the year.

This also speaks directly to one of our core objectives at IronBridge: to eliminate the big downside scenario.

We cannot avoid volatility, nor do we want to. You must have volatility if you want to try to achieve decent returns over time.

But by reducing exposure to risk on a total portfolio basis, you can greatly reduce the risk of having large, damaging returns.

Changes in the Composition of Equity Exposure

If the first tool in your risk management toolbox is your overall exposure to cash, the second tool is the characteristics of the assets that are still invested.

The charts above show that overall stock exposure has decreased this year.

The other thing that has happened is that the stocks in which you were invested changed as well. Specifically, the characteristics of those stocks changed.

Here are various ways the amount invested in stocks has changed this year:
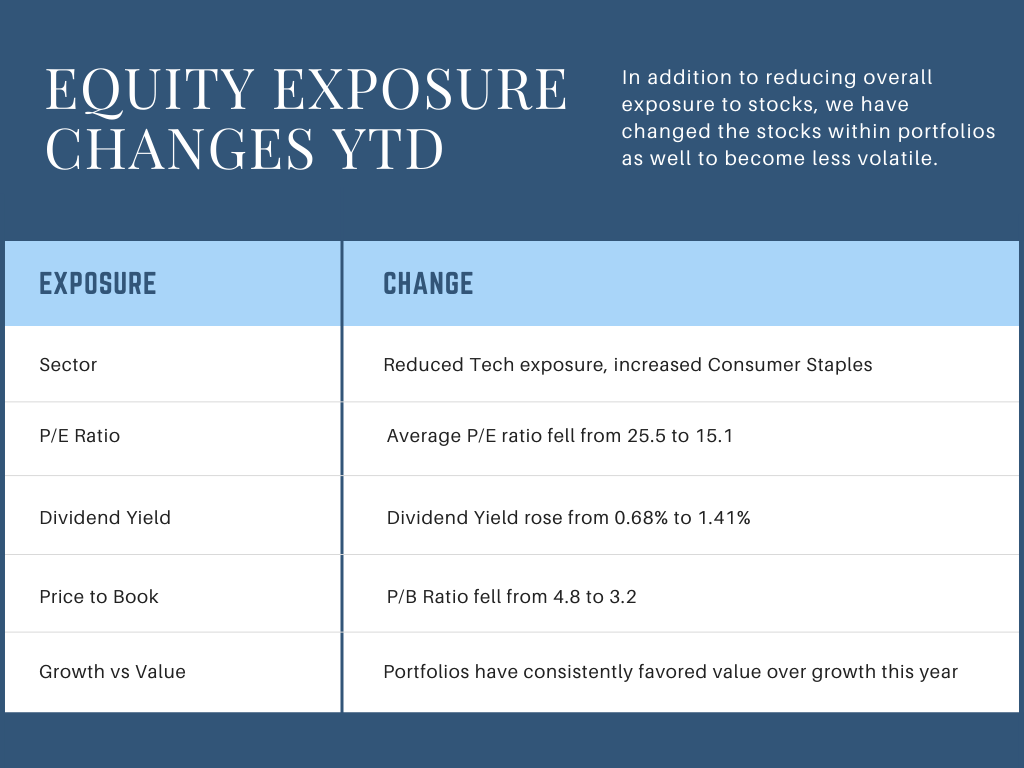
All of the items listed above should contribute to lower volatility in the stocks you are still invested in.

Sector exposure changed from aggressive (technology) to defensive (consumer staples).

Stocks with lower P/E ratios and price-to-book ratios typically have lower volatility.

And we have had a very distinct shift from growth to value in your portfolio as well.

Why we like Cash for Risk Management

As shown above, cash exposure for all clients has increased substantially this year.

We strongly believe that cash is THE BEST way to manage risk.

Why?

Cash is predictable.

There are other ways to manage risk: hedging, asset allocation, derivatives in futures markets, certain options strategies and shorting stocks.

Each of these can be effectively used. But they are complex and have various other risks that come along with them.

To do this effectively, you MUST have a process. You cannot have emotion be a part of the decision.

Why? Because we are humans and we are not very good at combining rational actions with emotional feelings.

Bottom Line

We have continued making portfolios less aggressive and less exposed to risk. As long as the market is showing volatility, we will continue doing that.

Given the continued approach by Putin to dig in his heels and extend the duration of this war, markets are likely to remain volatile.

We are positioned for volatility now, and may become more defensive as time goes by.

As always, please let us know if you have any questions.

Invest wisely!


Filed Under: IronBridge Insights Tagged With: bonds, cash, investments, portfolio, russia, stocks, Ukraine, war

Ukraine War: Market Update

March 2, 2022

There is a LOT happening in markets this week. As we said in our email on Monday, this may be the most important week since the 2008 financial crisis.

Today we’ll discuss a few of the major issues we’re watching:

  • Sanctions against Russia (the Financial War)
  • S&P 500
  • The Fed

As a note, we’ve put together a series of resources that we have been tracking, which you can reference here:

Ukraine War: Informational Resources

Let’s get started.


Sanctions against Russia (aka, the Financial War)

Once Russia invaded Ukraine last Thursday, the U.S. and the European Union announced a series of initial sanctions against Russia and various Russian companies. These sanctions were quick and were very coordinated among nations.

This immediately caused Putin to fight three separate wars: a military one in Ukraine, a financial war with the global financial system, and a war of perception at home.

Let’s focus on the financial war.

Frankly, once the initial sanctions were announced last week, we perceived them as basically useless.

Nearly every one allowed the entities and individuals sanctioned a 30-day window to comply with the sanctions. This meant that they weren’t going to take effect until potentially AFTER the war was over.

However, over the weekend, the sanctions became much more punitive.

They were also universally approved by the US, European Union, and the UK. Other countries such as Switzerland, Australia, Japan, New Zealand and Taiwan have all made their own sanctions against Russia as well.

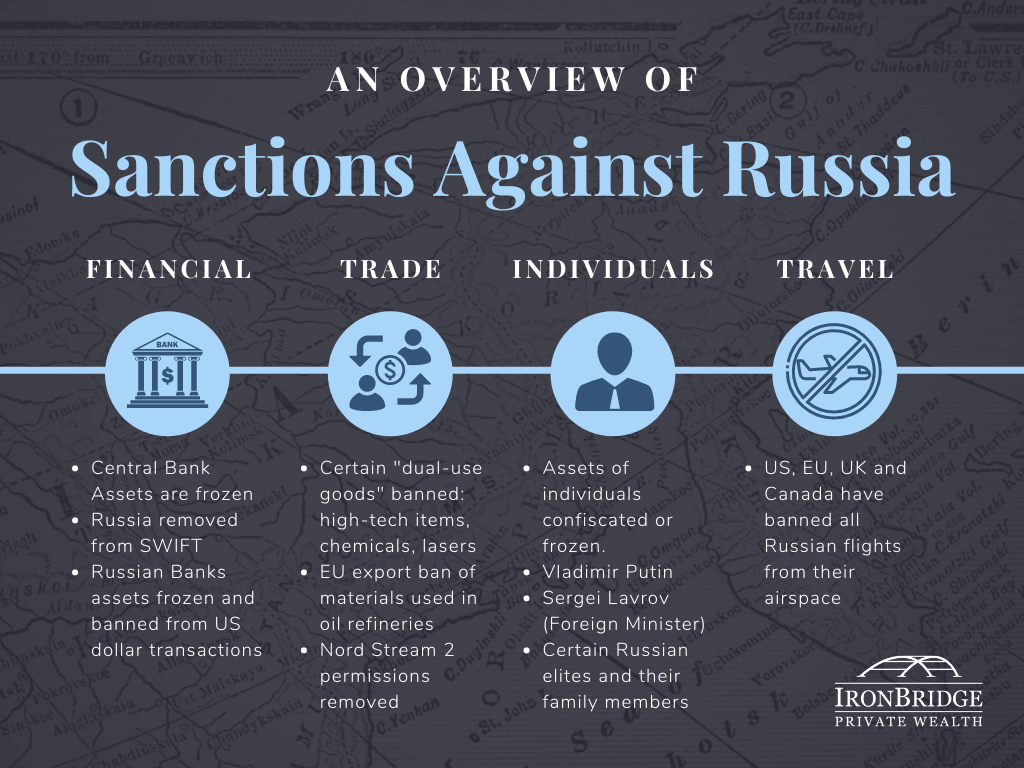
There are essentially four types of sanctions being imposed:

  • Financial
  • Trade-Related
  • Sanctions on Individuals
  • Travel

Here’s our overview of these sanctions:

All of these sanctions have two goals:

  1. Punish Russia financially by freezing financial resources and removing them from the global financial system.
  2. Turn global and Russian sentiment against Putin.

So far these are working well in the short time they have been in effect.

Russia has $640 billion in foreign reserves that have now been frozen. The war is costing them approximately $20 billion per day. By most estimates, Russia has $200 billion of unencumbered assets within Russia that have not been frozen by sanctions.

That means that financially, Russia could possibly run out of money in 10 days.

We shall see, but the initial response is that the sanctions have indeed put Putin in a tough situation.

But what impact has the war had on the stock market?


S&P 500 Index

Historically, when wars begin, the stock market tends to bottom near the time of the initial invasion. This has been true for every major war since the Germans invaded Poland at the start of World War II.

So far, markets have responded to the Russian/Ukraine war as markets historically have done…by rallying higher against almost every ounce of common sense any of us possess.

As of today (March 2nd), the low point of the market happened on Thursday, February 24th. This was the day that Russia invaded Ukraine.

Since then, the S&P 500 is UP nearly 7%.

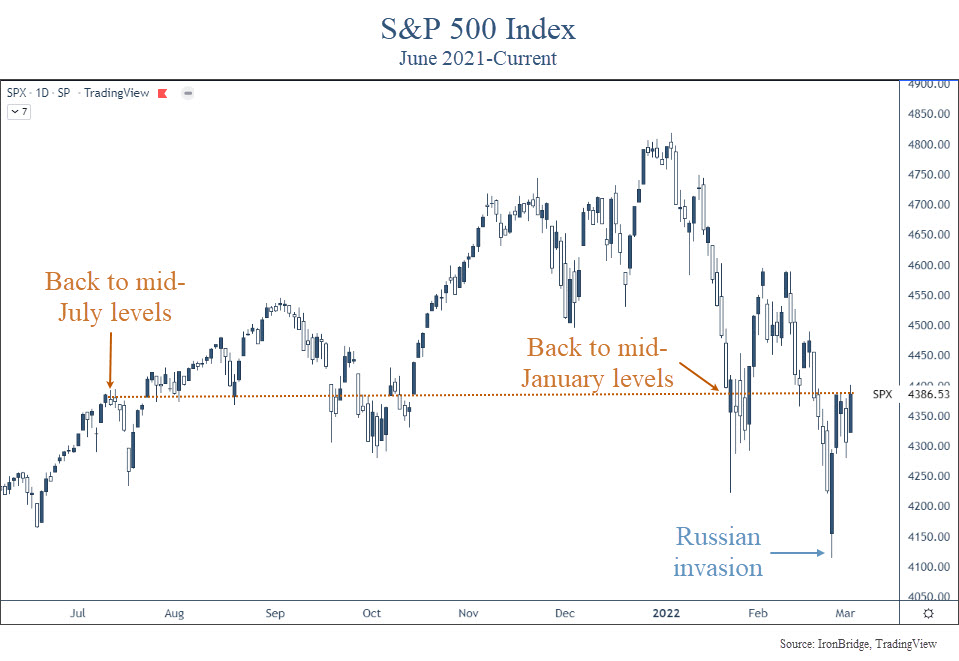
The chart below shows the S&P 500 Index since last June.

The first thing we notice is that the low point of the market thus far was immediately following the invasion. Despite the onset of this war, markets are essentially the same place they were in mid-January.

The second thing we notice is that the market was down “only” 2% the morning of the invasion.

That sounds like a lot, but relative to the volatility that occurred during the COVID crash, when markets moved nearly 10% any given day, a 2% move isn’t overwhelmingly bad. Especially given the fact that many people think this could lead to a nuclear war.

However, during the COVID crash, and also during the bear market of late 2018, markets regularly moved 2% a day.

But this pullback feels worse, doesn’t it?

That could be because we have been lulled to sleep by a very calm market in the past couple of years. It also could be that the risk of nuclear war seems like a reality for the first time in decades, which is obviously nothing to ignore.

Either way, people in general seem to have a more negative feeling towards these developments.

While the invasion itself didn’t cause much volatility, markets definitely anticipated volatility prior to the onset of this unnecessary war.

In fact, the S&P 500 was down 14% from peak-to-trough intraday in 2022, while the Nasdaq and Russell 2000 were both down over 20% peak-to-trough.

Does the fact that we didn’t see much volatility since war began mean we’re in the clear?

The answer is both “maybe” and “absolutely not”.

There are a number of positives that could result in a strong market if the Ukraine war comes to a peaceful and quick resolution:

  • The economy is strong.
  • The consumer is strong.
  • The Fed is now likely to slow down their pace of interest rate increases, resulting in continued support of financial markets.
  • The world is unified against Russia, making a coordinated effort to overcome the fallout from sanctions more economically and politically realistic. (Supplying Europe with gas from the US, for example.)

So if we get a peaceful resolution, there are reasons to be optimistic.

However, the elephant in the room is Putin. More accurately, he is the wild animal who is cornered and scared.

Dictators have one goal: to remain in power.

And Putin’s reputation has been greatly diminished both globally and domestically.

If he can’t get out of this situation peacefully, save face, and retain power all at the same time, there is no telling what he might do. And this is the risk we all fear.

Let’s refocus on the financial markets.

Prior to the Ukraine mess, the markets were selling off because concerns on inflation and the speed at which the Fed might act.

What should we expect from the Federal Reserve now?


The Fed

What might the fed do now?

The easiest way to look at this is what the anticipation of Federal Reserve rate hikes might be.

The next chart, from Bianco Research, shows the probability of Fed rate hikes at each upcoming Fed meeting.

Here’s how to read this table.

On the top left, the FOMC Meeting on 16-Mar-22 shows (from left to right across the table) a 100% probability of a hike of 0.25-0.50%, a 21% probability of a 0.50-0.75% hike, and so on. (FOMC stands for “Federal Open Market Committee”)

This tells us that the market is now pricing a 0.25% hike in March, and a total of four rate hikes this year.

Three weeks ago, there was a probability of over 90% of a 0.50% rate hike in March, with 6-7 hikes likely this year.

So the Ukraine situation is causing the Fed to pause slightly, at least for now.

That could create a tailwind for stocks as well.

But they are definitely behind the curve.

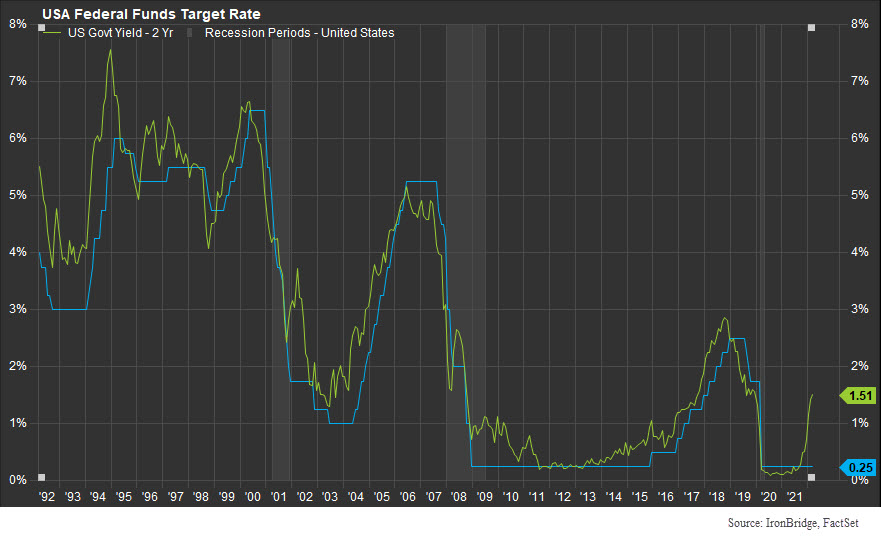
For the past 30 years, the Fed Funds rate has essentially mirrored the 2-year US Treasury yield, as shown in the next chart.

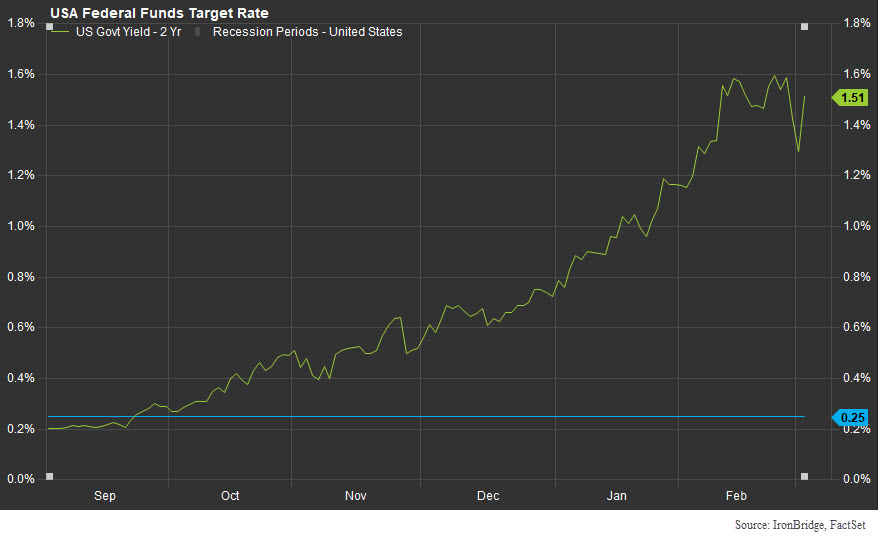
But if we zoom in to the recent rise in the 2-year Treasury yield, we see just how far the Fed needs to go to catch up.

Six months ago, these rates were the same.

Now, the Fed would need to hike 6 times to catch up to the 2-year yield.

This is their dilemma.

The other thing to note on the chart above is that the 2-year Treasury yield barely moved in response to the Ukraine war.

Globally, investors have not been moving into safe havens like we would normally expect.

Bottom line, we are not seeing the type of volatility that we would probably expect in a conflict with the implications of this one.

That leads us to believe one of two things will happen:

  1. Markets are correct. This implies that the Ukraine conflict will come to a conclusion within a week or two.
  2. Markets are unprepared. This implies that the real volatility is yet to come.

We don’t like to think about what happens in scenario 2.

But we must think through it and be prepared for any scenario, for that is our job as fiduciaries of your capital.

On Friday, we will give you a portfolio update and look at the specific levels on the markets that we are watching.

Invest wisely!


Filed Under: IronBridge Insights Tagged With: fed funds rate, federal reserve, fiduciary, investing, markets, russia, treasury yields, Ukraine, volatility, war

Ukraine War: Informational Resources

February 28, 2022

During times of uncertainty, information is critical. We have been tracking multiple resources to follow developments in Ukraine, and wanted to share these with you.

Unfortunately, the major US News outlets are filled with partisan slant. It is distracting, and more resembles propaganda most likely found within Russia than what should be presented by an unbiased and informed media (and we’re referring to both sides of the political aisle).

Instead, we have been following a variety of different informational resources that we have found to be objective and informative.  We hope that you find these helpful if you’re interested in tracking developments in the conflict. They are listed below.


BEST NEWS OUTLET:

  • BBC World News: https://www.bbc.com/news

BEST ARTICLES ON SPECIFIC TOPICS:

  • Markets & War: Investor Amnesia: A History of Invasions, Wars and Markets
  • The SWIFT Sanction: What is SWIFT and Why is it Being Used against Russia, WSJ
  • History of Ukraine: The History, Geography, People and Culture of Ukraine, Encyclopedia Britannica
  • Vladimir Putin: Wikipedia Page

BEST REAL-TIME MAPS & DATA TO TRACK THE CONFLICT:

  • New York Times: Tracking the Invasion of Ukraine
  • Council on Foreign Relations: Global Conflict Tracker

BEST FREE DAILY MARKET UPDATE:

  • Bloomberg’s Five Things: https://www.bloomberg.com/account/newsletters

BEST SOCIAL MEDIA FOLLOWS:

  • Twitter: Major General Mick Ryan (sample below)
  • Twitter: Ukraine President Zelensky (we’re witnessing in real time his fascinating transformation from a comedian politician to Ukraine’s Winston Churchill)

Major General Mick Ryan is a former officer in the Australian Army, and has had excellent perspective on all things Russian, particularly the possible use of nuclear arms by Russia.

Tweets by WarintheFuture

Bookmark or subscribe to these resources and you’ll get a better sense of the full scope of this conflict.

Invest Wisely!


Filed Under: IronBridge Insights Tagged With: information, russia, Ukraine, war

Ares: Forever Quarrelling

February 8, 2022

Ares, the god of war, statue representing both the valor and brutality of war. Ares was one of 12 original Olympians and a son of Zeus.

In Greek mythology, Ares was the God of War.

He was one of the 12 original Olympians, and a son of Zeus. He symbolized both the valor and brutality of war.

Much of Greek mythology comes from ancient writings, such as Homer’s Iliad.

In the Iliad, Zeus tells his son, Ares:

To me you are the most hateful of all gods who hold Olympus. Forever quarreling is dear to your heart, wars and battle.

zeus to his son ares, in Homer’s iliad

It is telling that the Greeks chose to have War represented in their 12 primary deities. But it is most telling that they portrayed the God of War as the worst one of the bunch.

28 centuries later, humanity still faces those who feel the pull of Ares. Specifically, Vladimir Putin. And his drumbeats of war are growing louder by the day.

The possibility of a Russian invasion into the Ukraine has been increasing for at least two months now. It now appears almost inevitable that Russia will invade.

(Unless, of course, this was a pre-planned show of force with a pre-negotiated peaceful resolution that helps both Putin and Biden with their constituents.)

But we digress.

We will not discuss the human impact of a potential invasion or war. We only hope that if an invasion occurs, death and destruction are minimized as much as possible. And we hope it does not escalate into a more broad conflict that includes China, European nations or the United States.

What we will do is focus on the potential impact on the markets. Specifically, we discuss:

  • Timing of a Potential Invasion
  • Are Markets Pricing in the Risk of War?
  • What happened after Previous Geopolitical Events?
  • What is the risk of Russian Attacks on our Infrastructure?

Let’s get to it.

Timing of a Potential Invasion

First of all, Russia has a history of invading countries when the US is preoccupied with other things.

  • They invaded Afghanistan on Christmas Eve in 1979.
  • They invaded Hungary two days before the Presidential election in 1956.

Russia’s two biggest adversaries, the US and China, are both pre-occupied right now.

  • China is hosting the winter Olympics, and are trying to look good on the world stage (although nobody seems to be watching).
  • The Super Bowl is this weekend in the US. It is annually one of the most-watched television events of the year.

So it appears that this weekend may make sense if they are going to invade.

However, people said that in December as well, projecting that Russia might again invade around Christmas and that didn’t happen.

We are no geopolitical experts, but we would not be surprised if an invasion happened this weekend.

Are Financial Markets Pricing in an Invasion?

Bottom line, no, they are not. And if they are, they simply don’t care.

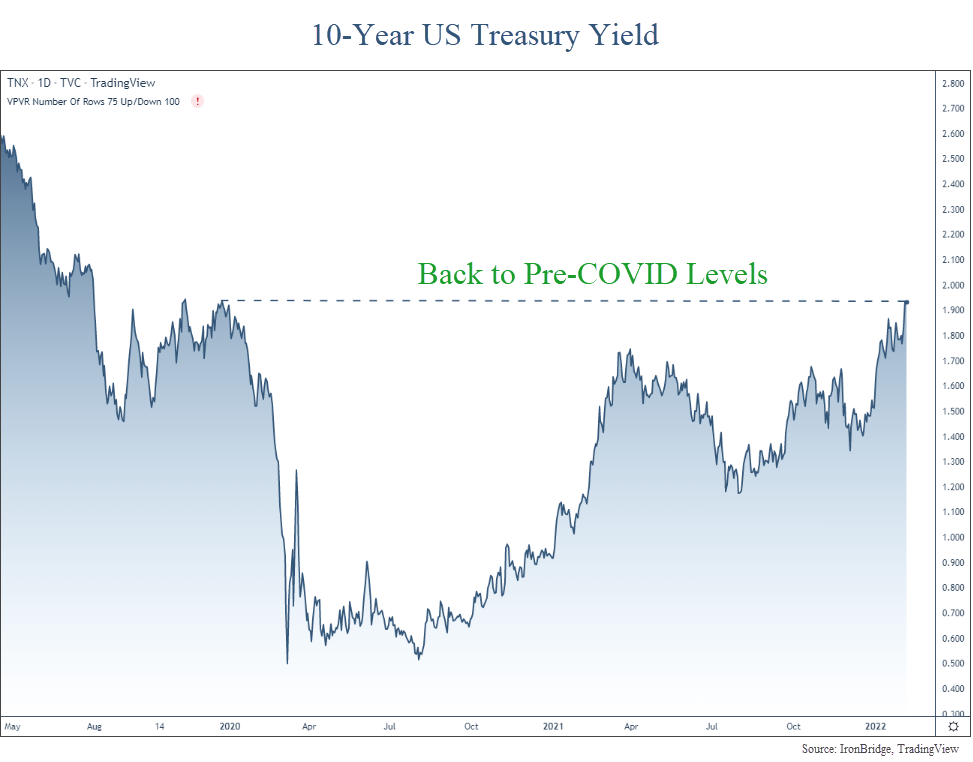
Typically when financial markets are concerned about a negative potential event, money flows into US Treasuries, causing yields to go down. However, yields have risen recently, and there has been no flight into the safety of US Treasuries.

In fact, US Treasury yields have continued moving HIGHER, and are now back to pre-COVID levels, as shown in the chart below.

10-year us treasury yields have been moving higher, despite tensions between russia and ukraine

The spike higher on the far right side of the chart shows a bond market that is decidedly NOT pricing in any global instability.

If the global financial markets were concerned about this invasion, we would first see it expressed in lower yields, not higher ones.

In fact, since late November and early December (when rumors about a Russian invasion began), yields have only risen. They are up over 65 basis points in that time, which is a very large move in yields for the Treasury market.

Simply put, this is not a bond market that is concerned about an invasion.

The stock market isn’t much different.

Yes, we have seen volatility this year. But it appears for now that the choppiness this year is simply a market working off the froth after large gains over the past two years. Not an anticipation of further escalation in the conflict.

As invasion rumors have continued to gain momentum over the past couple of weeks, US markets have rallied.

What about in Europe?

Germany appears to be the biggest loser (besides Ukraine) in all of this. They get energy from Ukranian pipelines, and their economy appears to have the most to lose.

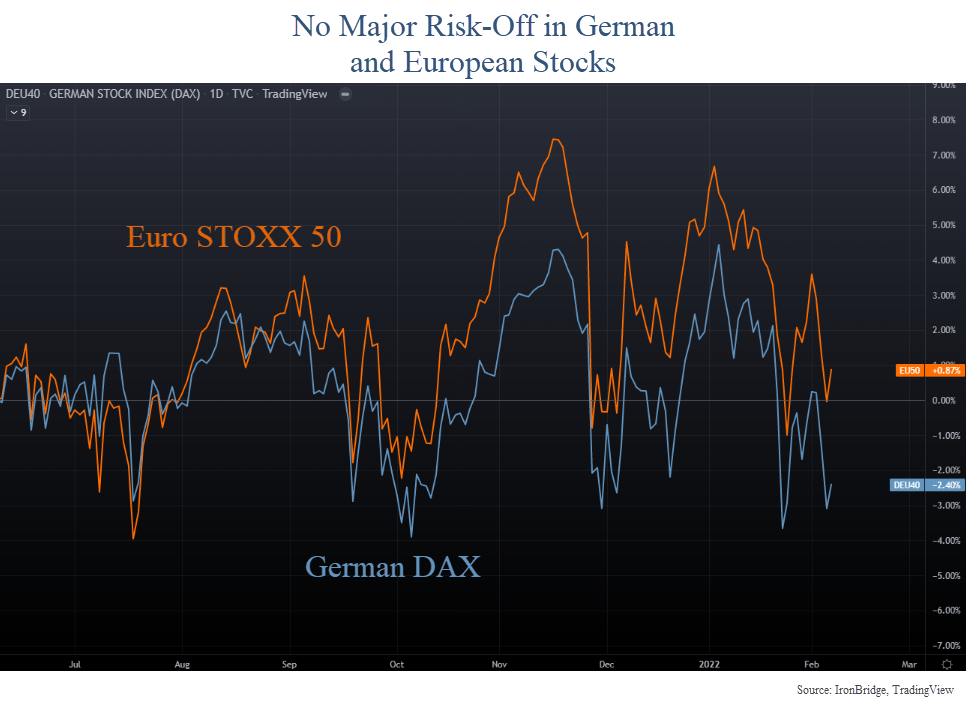
Well, European markets are basically telling the same story…that there isn’t much to worry about.

The next chart shows the Euro STOXX 50, an index of the 50 of the largest companies in 8 European countries, and the German DAX, which is Germany’s equivalent of the Dow Jones Index.

euro stoxx 50 index and the german dax leading up to a potential russian invastion of ukraine.

This chart shows European markets that have been choppy since last summer. You’d never know by this chart that there was about to be a war any day.

In fact, European stocks have fared much better than US stocks over the past month, despite having much more to lose if Russia invades Ukraine.

Bottom line, financial markets across the globe simply aren’t predicting any lasting impact of the potential conflict.

What Happened in Previous Geopolitical Events?

This isn’t the first time we’ve had geopolitical scares.

In fact, we wrote about this exact thing in 2017 when there was sabre rattling as tensions with North Korea began to flare. Read it HERE.

Somewhat to our surprise, we found that geopolitics simply don’t have the negative effect that many people think.

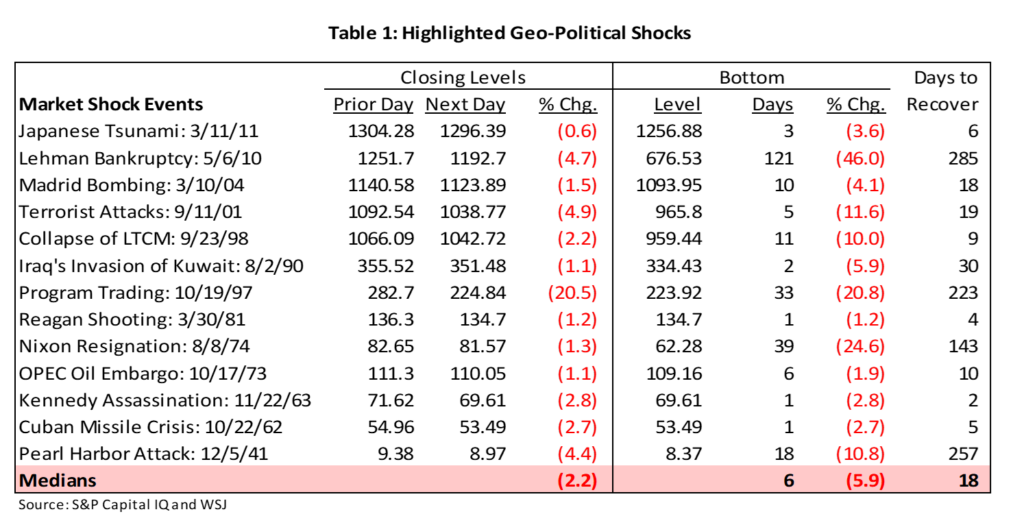
The next table shows the performance of the S&P 500 Index following major geopolitical shocks, courtesy of S&P Capital and the Wall Street Journal.

stock market reaction following major geopolitical events since pearl harbor

Essentially there were 3 events in the past 100 years that caused markets to fall more than 12%:

  • Lehman Bankruptcy (that started the global financial crisis)
  • The minor bear market in 1997 during the tech bubble
  • Nixon Resignation during the sideways bear market of the 1970’s.

In fact, EVERY war in the past century was a non-event to markets.

Surprising, huh?

Pearl Harbor, the Cuban Missile Crisis, JFK assasination, the first Iraq war, 9/11…all resulted in only moderate declines the day it was announced, and all resulted in completely normal pullbacks.

In January, we saw the S&P 500 fall 12%. It has recovered about half of that move so far.

So maybe the market ALREADY priced in Russia invading Ukraine, based on how stocks have responded to the start of previous wars.

What if Russia Attacks Infrastructure in the U.S.?

This is the biggest wildcard.

One of the concerns by some is if the United States put punitive sanctions on Russia, they would retaliate with an attack on our infrastructure.

An attack on our digital infrastructure would be a problem, but it appears that would be a temporary one. There is not just one internet or communication provider. There are many. So while a localized attack may cause localized disruption, it would be very difficult to stop the “web” of communication that exists across this country. Landlines, cell towers, satellites, all provide data to people. It is a very decentralized system that would be hard to attack.

Water and electricity resources is another potential target. But as we’ve witnessed in Texas over the past year, the power grid going down or water supply being compromised does indeed cause inconveniences. But it would not necessarily cause permanent or irreparable damage to the country.

So what would Russia have to gain? They cause major inconveniences to us? Just keep robo-calling us about our expired car warranties and call it a day.

Is the inconvenience worth starting World War III? It doesn’t seem like it.

Conclusion

Bottom line, financial markets aren’t concerned. There isn’t enough tension, risks and potential benefits to Russia to warrant expanded conflict. And expanded conflict is the real risk.

Ukraine is a strategic benefit for Russia, but is not crucial to the global economic or market infrastructure.

Financial markets are taking the approach that there will always be conflict. Humans will be forever quarreling. And they are taking the view that minor conflicts are not important enough to change the overall market and economic cycle.

We’re not saying that it for sure WON’T turn into something bigger. If it does, we will adjust portfolios accordingly. After all, the market can change its mind anytime.

But for now, it appears that if Russia does in fact invade Ukraine, there is not much to worry about when it comes to your portfolio.

Invest wisely!


Filed Under: IronBridge Insights Tagged With: ares, geopolitics, god of war, greek mythology, markets, risk, risk management, russia, treasury yields, Ukraine, war

Footer

LET'S CONNECT

  • Email
  • Facebook
  • Instagram
  • LinkedIn
  • Twitter

AUSTIN LOCATION

6420 Bee Caves Rd, Suite 201

Austin, Texas 78746

DISCLOSURES

Form ADV  |  Privacy Policy  |  Website Disclosures

  • Home
  • Difference
  • Process
  • Services
  • Insights
  • Team
  • Clients
  • Form CRS
  • Contact Us

Copyright © 2017-Present by IronBridge Private Wealth, LLC. All rights reserved.