Anyone who isn’t confused really doesn’t understand the situation.
edward r. murrow
The Federal Reserve met today, and for the first time in over a year they kept interest rates unchanged.
Typically, when the Fed pauses, it is a signal that they are more confident that their objectives have been met.
But this meeting was a bit different.
It was full of mixed messages.
Instead of signaling to the market that they are seeing concrete signs that inflation is going down, their message was incredibly strong that inflation problems have gotten worse and that higher interest rates are still ahead.
Let’s look at their mixed messages from today’s meeting.
The Projected Terminal Rate Increased
The Federal Reserve has a dual mandate as dictated by Congress: stable prices and full employment.
The “terminal rate” is the rate at which the Fed believes will best balance these two objectives.
Think of the terminal rate like getting two sides of a scale to be in balance.

If interest rates are too low, the employment goal is achieved but inflation can run hot.
If they are too high, then inflation is tamed, but it risks high unemployment.
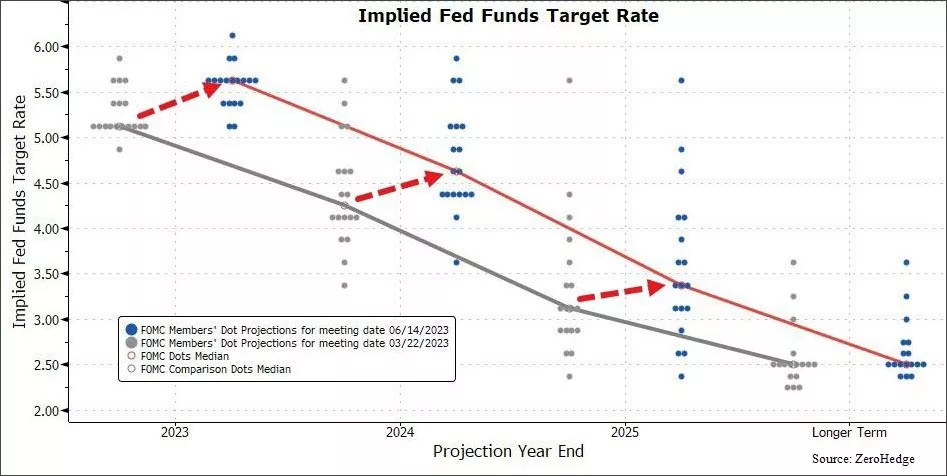
The projected terminal rate went up by 0.5% from their meeting one month ago.
This means they think they will increase rates at least two more times by the end of the year.
That may not seem like much, but in Fed-world, that is an enormous increase.
Which leads us to mixed message #1: They are MORE convinced today that inflation will continue to be a problem than they were at their last meeting. Yet, they chose to RAISE rates at the last meeting, and KEEP RATES UNCHANGED today.
Nine of the twelve voting members increased their projected terminal rate.
One member, in fact, believes the Fed will have to raise by another full percentage point to get inflation contained.
We can view this in the “dot plot” below.

Each dot in this chart represents one voting member’s view on where they think interest rates will be at the end of the year (shown along the bottom of the chart).
The grey dots were their previous projections and the blue dots are from today.
The question is…why pause if they are all so convinced inflation is still a problem?
It frankly doesn’t make much sense.
Especially given that inflation data has consistently been showing signs of slowing for at least a few months now.
So what does the inflation data tell us?
Inflation Data Differs from the Fed’s Message
This is where we start to question what the Fed is looking at.
If we look at numerous inflation data points, without question they are easing.
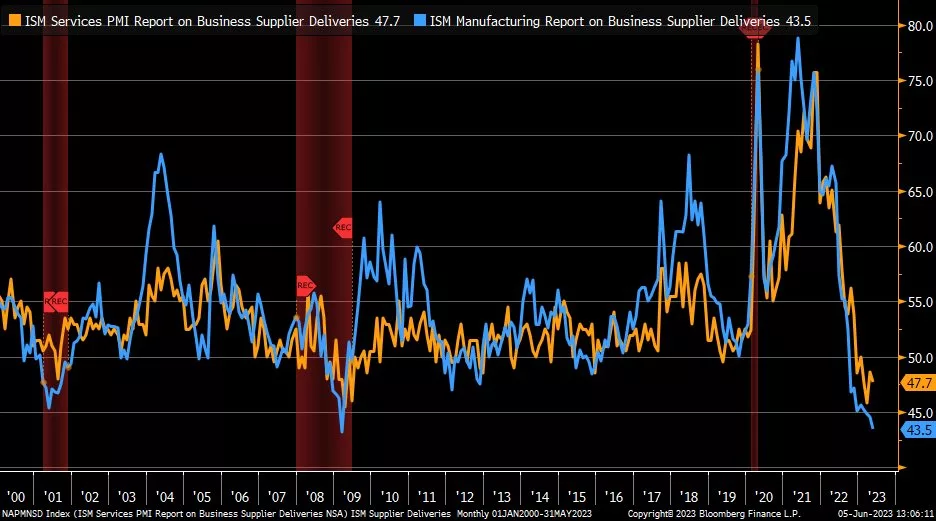
The next chart looks at a measure of inflation for the services sector of the U.S. economy (in orange) alongside the manufacturing supplier deliveries (in blue).
This is “fast data”.
Which means that it is an up-to-date measurement of inflationary pressures in the early stages of economic activity.

Think of supplier deliveries as the raw material ordered before a good is produced, sold and shipped. From electric vehicles to microwaves to jelly beans, this measures all of the various inputs to those end products.
This indicator tracks the actual deliveries, not just the orders.
And deliveries have fallen off a cliff in the past year.
Deliveries are important because they give us a glimpse into the first things that go into producing goods. Companies have purchasing managers who are responsible for getting the “stuff” in the door to make whatever widget that company produces.
This data is in recessionary territory (a reading below 50 signals a contraction).
You may think that this is just a result of the supply-chain issues being resolved after COVID. But that would make deliveries go UP. Companies would be receiving MORE of the inputs to their products, not less.
This is a sign that DEMAND is going down.
We can see this demand destruction in the business sector as well.
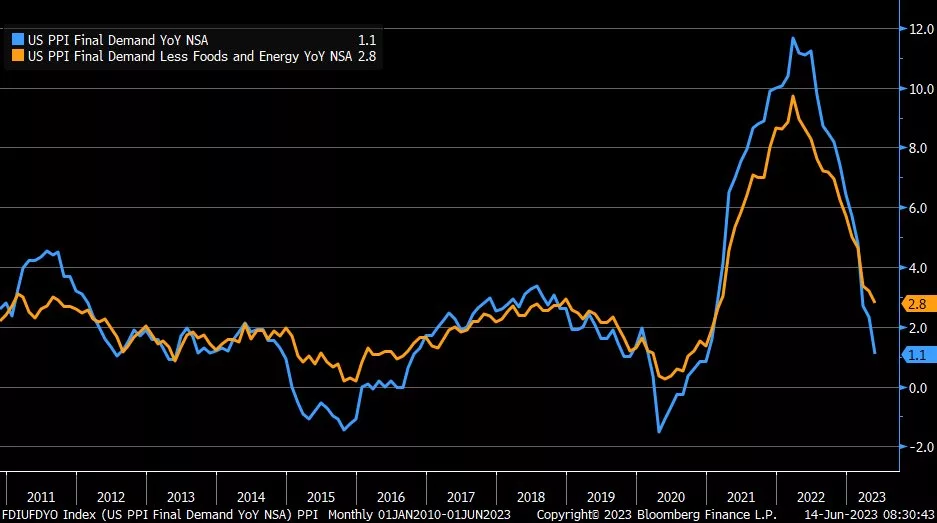
The next chart looks at final demand of producers (in blue) with final demand excluding the more volatile food and energy part of the economy (orange).

This also shows an environment where inflationary pressures are falling quite dramatically.
This is brings us to mixed message #2: the Fed has INCREASED their projected inflation targets while the data is showing exactly the opposite.
To be fair, employment continues to be strong, and the consumer remains resilient.
But employment data is “slow data”. When an employment number comes out it is typically at least a month old.
In fact, at the start of the last 4 recessions, employment indicators were all positive. It’s simply not a great tool to extract future economic activity.
Prioritizing slow data is like driving your car using the rear-view mirror. It doesn’t make much sense and it is incredibly dangerous.
And the Fed is doing just that.
Higher interest rates take time to work their way through the economy. They work on a lag. Increased rates now may take 6-12 months to show up in actual data.
They are prioritizing slow data to justify policies that work on a lag. It simply doesn’t make sense.
But there are very smart people working at the Fed. In addition to setting interest rates, they also provide numerous economic forecasts, including ones on unemployment.
This leads us to the last mixed message.
Unemployment Projections are Inconsistent with Growth Projections
As mentioned, the Fed does economic forecasts as a part of their “job”.
They should….there are over 400 Ph.D. economists employed there.
One forecast is on unemployment.
In May, they forecast that the unemployment rate would be 4.1% next year. (It is currently 3.7%).
But today they increased their forecast to 4.5%.
At the same time, they increased their GDP forecast from 0.6% annualized up to 1.0% annualized.
Here is mixed message #3: they think GDP will be STRONGER than they projected last month, but unemployment will be HIGHER than they thought as well.
We hate to break the news to them, but unemployment has NEVER risen by 0.8% in one year outside of a recession. (From the current 3.7% to their projected 4.5%).
Bottom Line
In our opinion, the mixed messages from today show just how different the potential outcomes are over the coming months.
On one hand, inflationary pressures are decreasing and economic data is showing signs of a slowdown. On the other hand, stock markets have remained surprisingly buoyant on the back of an artificial intelligence tech frenzy.
We’ll review these potential outcomes in our 2023 Mid-Year Outlook webinar that will be held on Tuesday, June 27th. You’ll receive details next week.
Until then we’ll continue to monitor the variety of differing data points to best help you achieve your financial goals.
Invest wisely!