So much for the New Year’s wish of putting 2020 and 2021 behind us and getting back to normal.
Or are we?
The markets had one of the calmest years in history last year, mainly on the back of the mega-cap tech firms.
But that calm was shattered as the market fell over 12% in a few short weeks.
Which begs the question…”Is this normal, or is this a sign that the biggest bubble in the history of the world is popping?”
Before we dig in, we’ll mention that the Fed met today and not much came of it. Yes, markets reversed lower after the announcement, but there were no surprises today.
They reiterated that they plan to raise rates by 0.25% in March. And reiterated that the balance sheet is way too big for the current economic environment. Both of these are accurate and prudent.
The markets were hoping he would say that all potential rate hikes are off the table, but that was an unrealistic expectation. And one mostly fabricated by the financial media.
So the reality of the Fed this evening is exactly the same as the reality of the Fed at noon today.
Let’s move on to the markets.
The S&P 500
Markets have had a terrible start to the year. In fact, we’re off to the worst January in history.
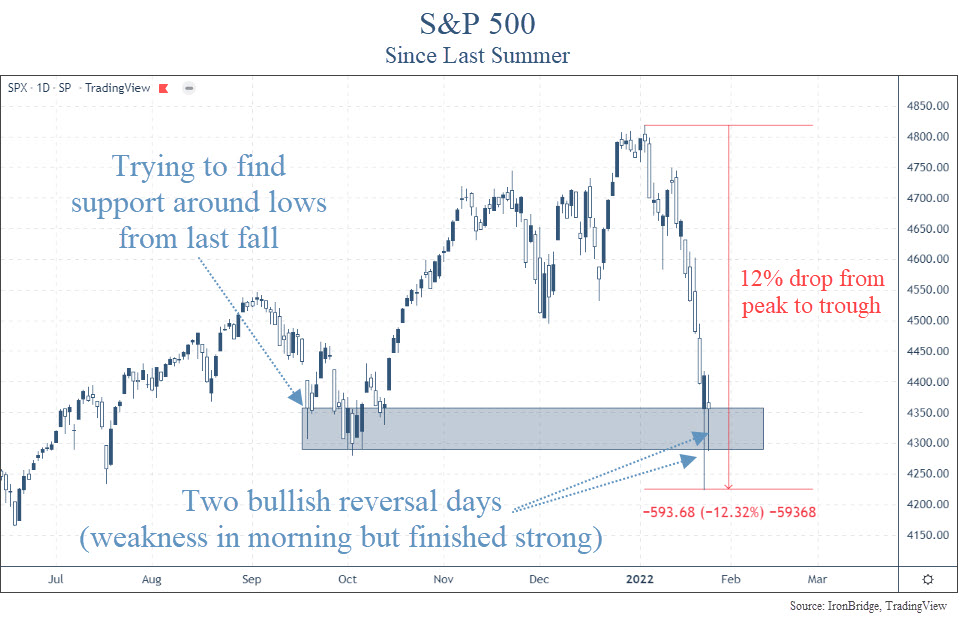
From peak-to-trough, the S&P fell 12% (so far at least).
Let’s look at the chart.

December was actually a fairly choppy month, but as soon as the clock struck midnight on New Year’s Eve, markets began to drop without much relief.
The last time the market had any sort of mild correction was last September. It chopped around for a few weeks and moved higher into year end.
Now, the market is testing those levels, as shown in the blue shaded rectangle in the chart above.
The other thing the market is trying to do is to rebound during the day from a very weak start.
The market has had two consecutive reversal days. The bulls are trying to show that they aren’t ready to give up just yet.
On Monday, Jan 24th, the S&P was down as much as 3.99%. However, by the end of the day it was actually positive. That’s a HUGE reversal day that only has a few precedents.
Since 1950, there have been 88 times the S&P fell by this much in a single day.
Only 3 times (including Monday) it finished positive on the day.
The other two times? October 2008.
Yikes.
On the surface, this doesn’t appear to be very good.
October 2008 was the thick of the financial crisis. Banks were failing, the housing market was tumbling, and there was economic and market chaos.
We aren’t seeing anything close to that right now.
Outside of the supply chain bottlenecks, the overall economy is doing fine.
The bond market isn’t showing any signs of stress either.
In fact, the bond market is typically the better market to watch if you’re concerned with the potential for a large drop in equities.
Yield Curve and Yield Spreads
The yield curve and yield spreads are the two major bond market data points that have been the best indicator of economic and widespread financial market stress over decades.
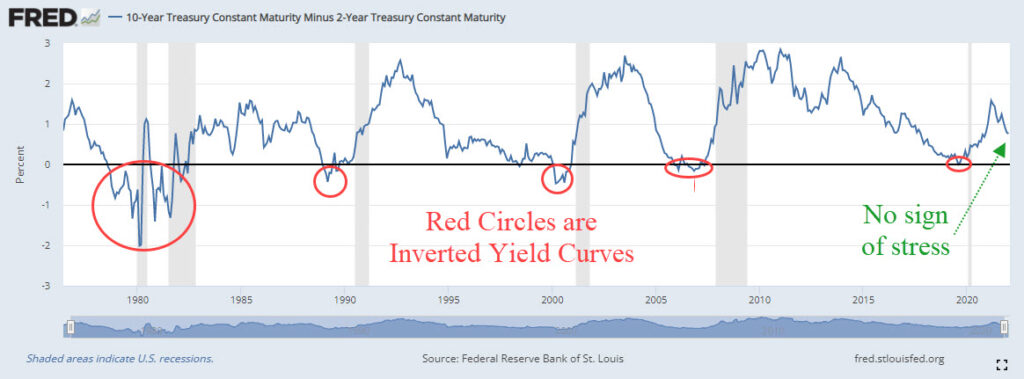
The yield curve measures the difference between longer-term bonds and shorter-term bonds. Specifically, the difference between the 10-year Treasury yield and the 2-year Treasury yield.
When the 10-year yield is LOWER than the 2-year yield, the curve gets “inverted”. An inverted yield curve has preceded EVERY recession over the past 50 years, as shown in the next chart.

The yield curve isn’t showing ANY concern.
What about the other major data point…yield spreads?
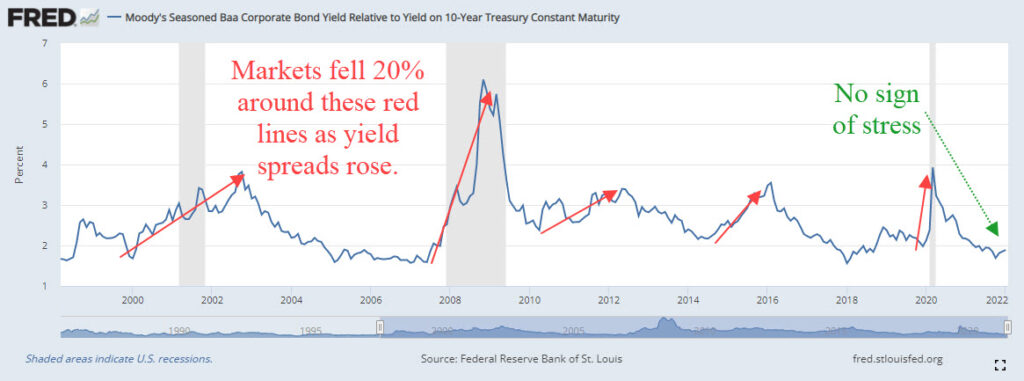
Yield spreads measure the difference between yields on the safe bonds (US Treasuries) versus the yields on unsafe bonds (junk bonds).
Specifically, we look at the Baa Corporate Bond Yield and the 10-Year Treasury yield.
This spread is shown on the next chart, which goes back to the late 1990’s.

Every time the market fell 20%, yield spreads widened well before that happened. There has been NO widening of yield spreads this year.
Bottom line, the bond market isn’t worried.
So why all the volatility recently?
The answer is pretty easy. They even met this afternoon…the Fed.
The Fed
The Fed met today, and despite a late day market selloff, no real news came from the meeting.
They reiterated that they anticipate a 0.25% rate hike in March.
This was expected.
They said they would remain aware of economic and financial conditions, and would adjust their approach if the situation warrants.
This was also expected.
So there was actually very little “news” that came of the meeting today.
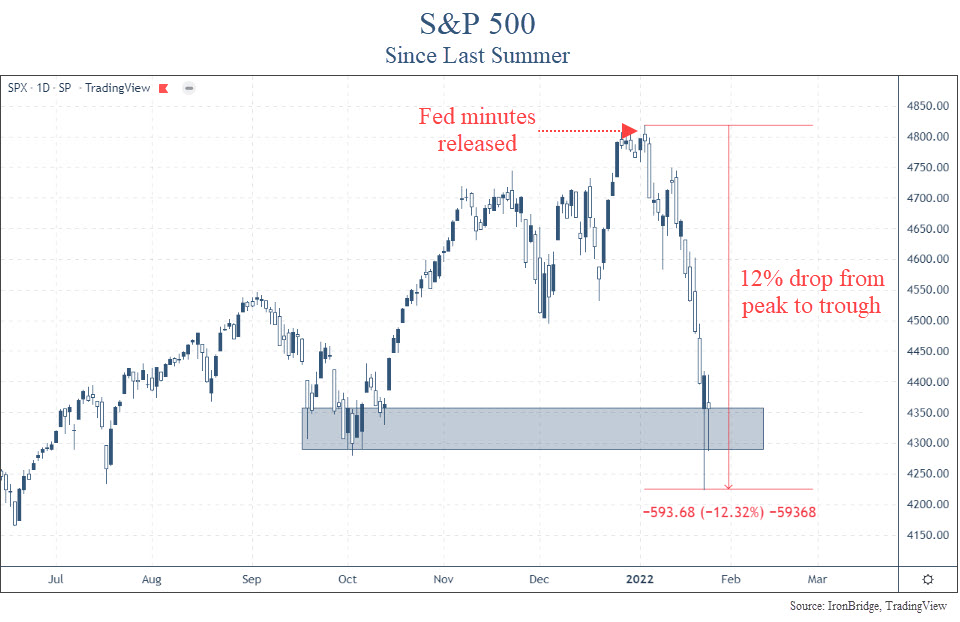
The real news happened a few weeks ago, when they released their minutes from their last Fed meeting of 2021.
In these minutes, they discussed a faster tightening that what the official messaging has been to the market.
The chart below shows when the minutes were released.
Oops. Since the release of the meeting notes, the market has gone pretty much straight down.
There were a couple of nice reversal days this week, but after the Fed meeting this afternoon, markets again fell.
So we’re getting mixed signals.
On one hand, the very speculative areas of the market are essentially collapsing:
- Bitcoin is down almost 50%
- Speculative tech stocks are down 70-80%
- A whopping 42% of the stocks in the Nasdaq Composite Index are down over 50%
We’re seeing risk at the edges of the market.
Major stock indexes are also showing weakness. The S&P as we mentioned above fell 12%. The Nasdaq has been worse, falling 19% from peak-to-trough.
We’re NOT seeing risk at the core of the global markets…bonds.
Which side should we choose?
For now, we must assume that the volatility we have seen this year is normal.
10% corrections happen on average every 12-18 months. It’s been almost 2 years since we’ve seen one. So this type of volatility isn’t all that unusual.
It FEELS a little worse, because we had such low volatility last year.
And it may continue for a while longer.
But until we start to see risk show up in the more important areas of the market, we should expect an ultimate resolution higher.
That said, we have been taking steps to modify client portfolios. After all, we never know when a small correction will turn into the big one.
We increased cash two weeks ago. We have been rotating out of the more aggressive areas of the market into the traditionally more conservative areas.
International stocks have shown a tremendous amount of strength relative to their US counterparts. We have increased exposure there as well.
If the markets continue to show volatility, we will more aggressively raise cash. And we’re not far from those levels.
But the weight of the evidence, at least for now, suggests this pullback is normal. And frankly we should expect more of this type of volatility going forward.
It does not look like the start of the bursting of the bubble. At least not yet.
Invest wisely!
