After an extended period of calm in financial markets, volatility has exploded higher the past two days. What caused it and should you be worried?
Hoping for the best, prepared for the worst, and unsurprised by anything in between.
Maya Angelou
Webinar
We are holding a webinar on Tuesday, August 6th to answer your questions and discuss current market volatility.
Look for information in a separate email.
What is Happening?
A few data points have spooked the market recently:
- Japanese Central Bank raised interest rates, causing a “carry trade” to unwind. (This is the main culprit).
- Yield Curve briefly un-inverts.
- A jobs number was relatively weak last week.
- Geopolitical concerns around Iran and Israel.
Should We be Worried?
Not yet.
Market volatility is always unnerving, but at this point the data suggests that this is a temporary move lower that should not result in the start of a major bear market.
However, we do expect large moves both up and down over the coming week(s).
We will update you as necessary.
What Should We Look For?
Most importantly, we should see selling pressure reduce in the next 48 hours:
- If the selling is temporary, we should see a big snap-back rally this week.
- If the selling is NOT temporary, we should still expect a big rally, but it will quickly be reversed over the next week or two.
Are we Selling?
Not yet.
We have “volatility overrides” as part of our investment process. This means that if certain panic conditions are present, we do not sell positions that meet this criteria.
Today, our process identified the current move as a panic move.
The last time the market gave us panic signals was at the COVID low in March of 2020.
Are we Buying?
We added exposure to small caps on Friday, and will likely continue to add on this weakness.
We did not buy or sell any positions today, but do expect to allocate to risk as the selloff fades.
That said, we will not hesitate to raise cash if needed.
Market Review
Let’s go over a few charts today:
- VIX Index (Volatility)
- Credit Spreads
- Japanese Yen Carry Trade
We will discuss more tomorrow in our webinar.
Volatility Index
The VIX index is giving us the best view of the spike in volatility.
The move we have seen since last week is quite amazing. Here’s the chart:
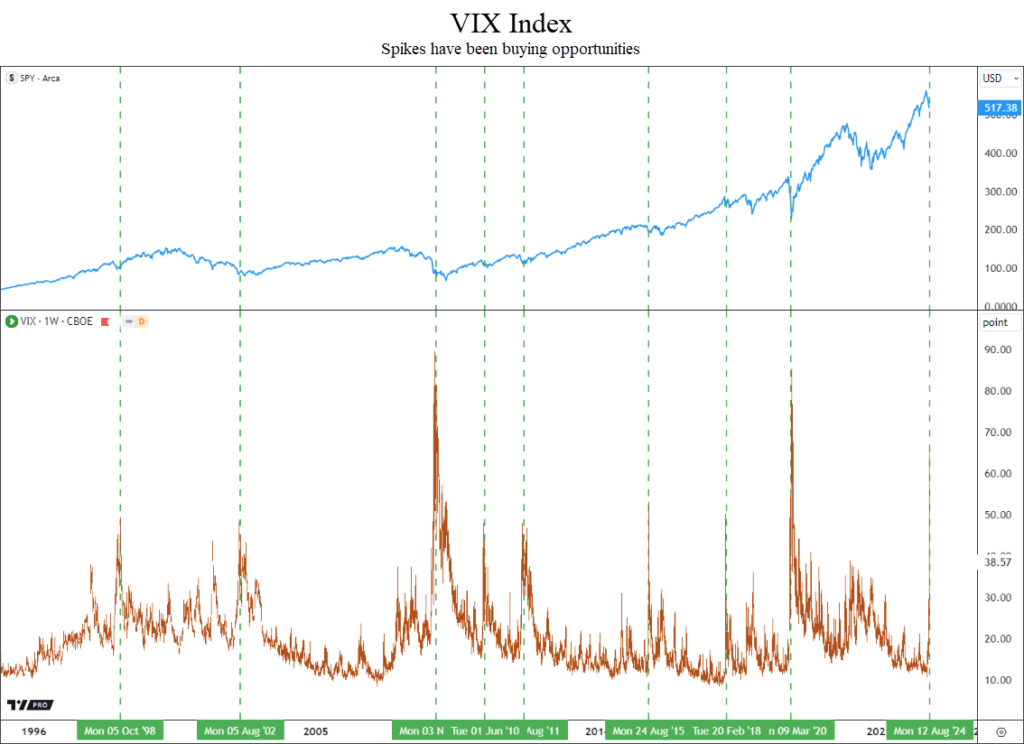
The blue line on top is the S&P 500 index (SPY), and the VIX index is in orange in the bottom pane of the chart.
This has been quite a spike higher, with the VIX approaching 70 today. It closed at 38 which is a good start.
Volatility doesn’t spike higher like this very often.
When it does, it has been an extremely good indicator that the selloff is either over or almost over.
This type of move typically does not mark a top in markets.
Quite the opposite in fact…this type of move usually signals that a low in price has either occurred or is close.
Credit Spreads
This is a warning sign that requires the most attention.
Anytime we see big moves lower in stocks, credit spreads widen a little as investors sell high-yield bonds and buy US Treasuries.
That is what we are seeing now, as shown in the next chart.
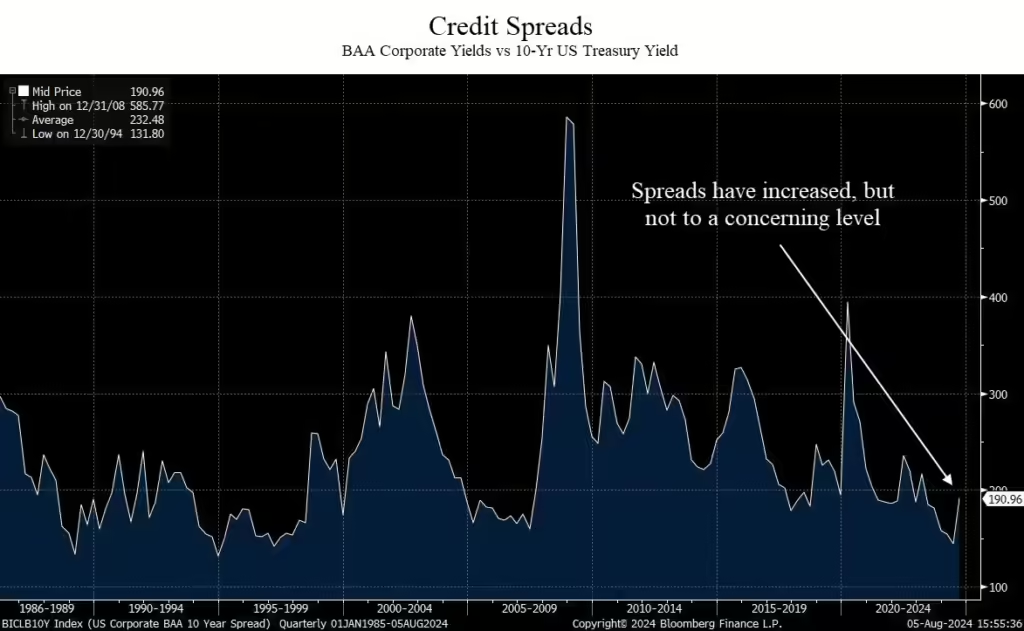
When this line goes up, it signals stress in the bond market.
Specifically, this shows the difference in yield between junk bonds and the 10-year US Treasury yield.
At 190 basis points, this means that junk bonds rated BAA only pay 1.90% above the 10-year treasury yield.
During the 2008 financial crisis, spreads jumped nearly 600 basis points, or 6%.
Normal spreads are 2-3%.
At readings of 1.9%, we are still below historical ranges.
For now, this indicator is not flashing warning signs, but the recent increase requires monitoring.
Japanese Yen Carry Trade
We saved this for last because it is the most complex.
We’ll try to simplify it.
A typical “carry trade” goes like this:
- Borrow money at low interest rates;
- Invest that money in assets that have higher return potential;
- Pay off the loan and keep the return minus the cost of the debt.
It’s essentially a fancy way to arbitrage, or make a spread between the cost of capital and the return you may get on the borrowed funds.
With the Yen carry trade, there are more factors at work.
One of the biggest factors is the currency conversion.
When money is borrowed in Yen, it is typically then converted to another currency, like the US Dollar.
That money is then invested in stocks or bonds.
The total return on the borrowed money is the return on the invested capital, plus or minus any return due to the currency moves.
When the Yen appreciates versus the US Dollar, it takes more dollars to pay off the initial loan in Yen. That means returns are diminished.
It then becomes stuck in a feedback loop.
The more assets that are converted back into Yen, the stronger the Yen becomes.
A stronger Yen puts more pressure on the carry trade, resulting in more selling.
More selling reduces return on the borrowed funds, resulting in a scramble to get out at any cost, as the return on the borrowed funds is eliminated by the strong Yen.
So let’s look at what the Yen has done.
Let’s review two charts:
- Short-Term chart going back to last year;
- Long-Term chart going back to the early 1990’s.
Let’s start with the short-term chart.
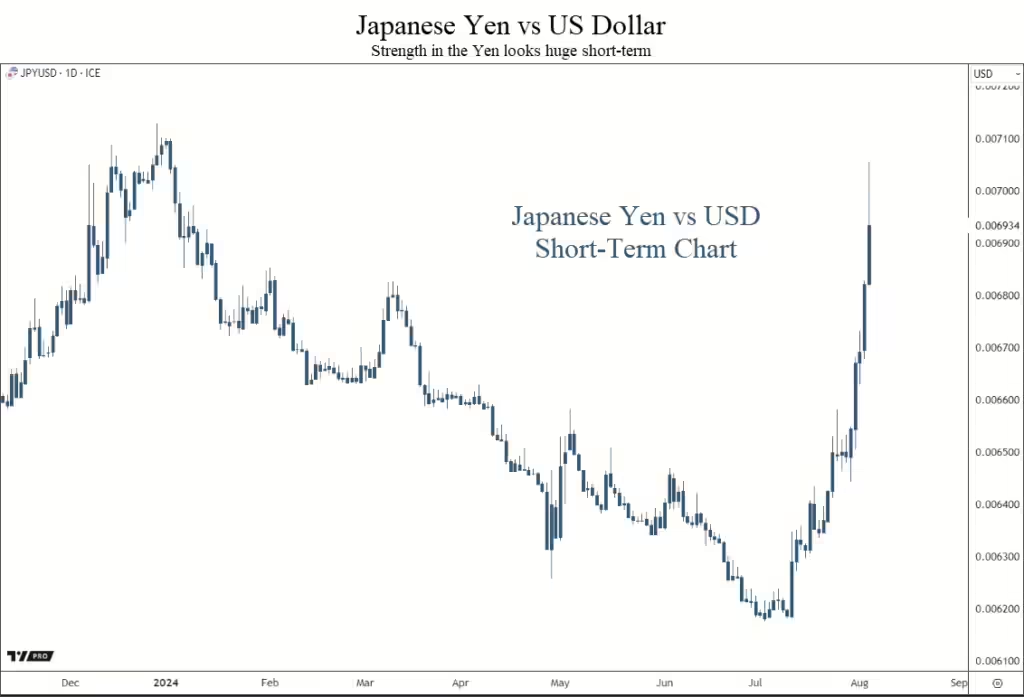
The move higher in the Yen appears to be a very large move.
When this line moves higher, the Yen is stronger. This hurts the carry trade.
When it moves lower, the Yen is weaker, helping to support the carry trade.
This move higher has resulted in a fast deleveraging of this carry trade.
Selling has been indiscriminate as investors try to reduce the damage from the strong Yen.
But like credit spreads, it’s helpful to take a broader view, so let’s look at the long-term chart.
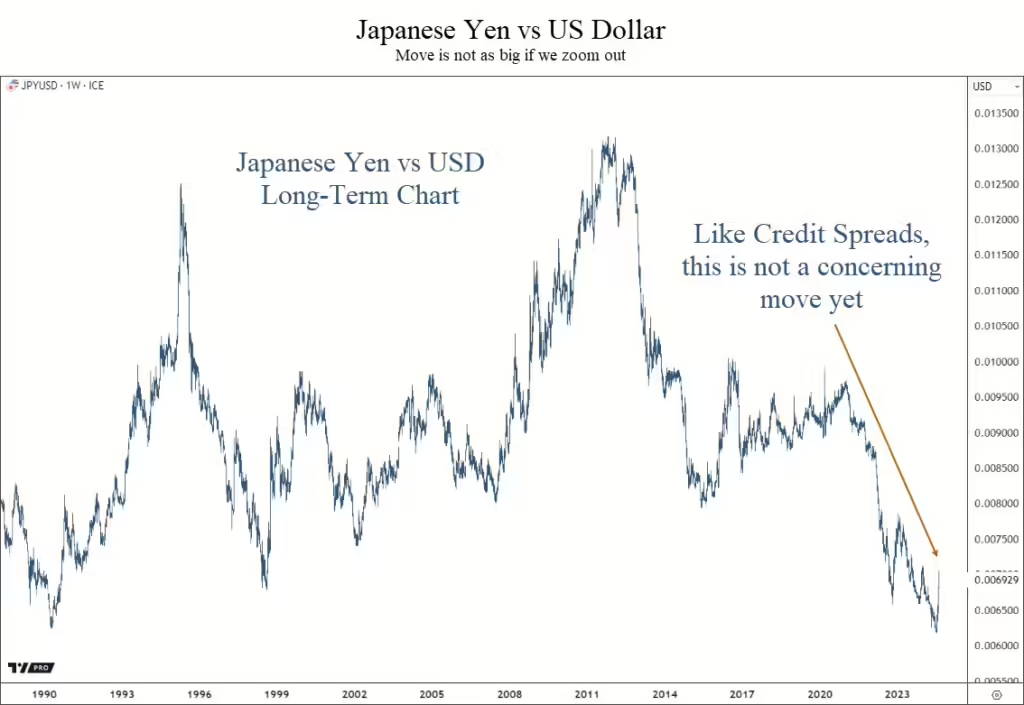
Just like credit spreads, the short-term move looks bad.
But by zooming out, we can see that the move hasn’t been all that unusual.
It may signal a massive trend change in favor of the Yen, but it is too early to say that with any conviction.
Bottom Line
The declines over the past two days have not been pretty. But at this point there is not enough evidence to get too defensive.
We will have plenty of information in the coming days, and will keep you posted on our analysis.
We will discuss this more in-depth in our webinar tomorrow, so keep an eye out for that email.
Invest wisely!


