Inflationary pressures have been steadily building over the past year. That can easily be seen in the price of lumber, residential houses and various raw materials. Recent data showed that CPI increased a whopping 4.2%. What implications does this have on your portfolio?
The first panacea for a mismanaged country is monetary inflation. The second one is war.
Ernest Hemingway
There is no question that we have seen massive inflation in various parts of the US economy since the end of the COVID-related market crash last year.
Homes in Austin are regularly being offered 20-30% above list price. The price of lumber has quadrupled over the past year. Used car prices are at all-time highs.
Some of the side effects of an inflationary environment are fairly obvious. Prices at the grocery store will go up. Gas prices will go up. Generally speaking, the cost of all kinds of “stuff” will rise. After all, that is what inflation is.
But there are other, less obvious things that are likely to happen during the period of rising inflation and interest rates that we have likely already entered.
There are two that we think are of primary importance:
- Non-linear price and interest rate increases.
- Dispersion in asset returns.
Both of these characteristics are critical to understand the investing environment over the next 20 years.
The non-linearity of the coming inflationary cycle simply means that it isn’t likely to hit us all at once. It will likely come in waves. We don’t need to know the exact timing and duration of each wave to properly navigate the next “rising” environment. We simply must be aware that it won’t come out of nowhere…there will be plenty of signs, many of which we’re seeing now.
We’ll go into more about dispersion below, but let’s first look at the historical cycle of rising interest rates to better understand what to expect.
The Interest Rate Cycle
Everything works in cycles. The Earth circles the sun. The seasons regularly change. Humans are born, age and decline.
Interest rates are no different.
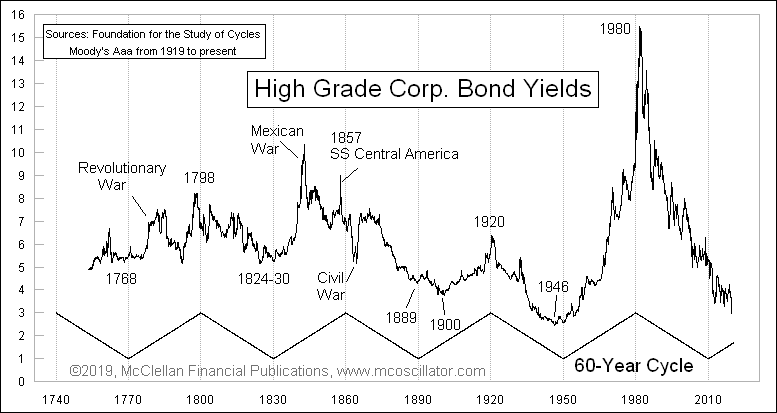
In fact, interest rates typically rise and fall on a 60-year cycle. That’s a 30-year cycle of rising interest rates, and a 30-year cycle of declining rates.
The chart below, from Tom McClellan of McClellan Financial Publications, is one of the best examples we’ve seen that shows this cycle in action.

This chart goes back to the mid 1700’s. We can fairly easily see the regular rise and fall of rates over this period of time. With the exception of a few wars here and there that artificially affected interest rates, the 30-year rhythm plays out pretty well.
The current period of declining interest rates began in the early 1980’s. Inflation peaked at 14.3% in 1980. Interest rates peaked in June of 1981, with the prime rate at an incredible 21.5%. Many of you reading this likely had mortgages at 13% and 14% at the time.
Paul Volcker, the chairman of the Federal Reserve at the time, famously declared a war on inflation and took steps to “pop” the inflation bubble. And he was ridiculed for it at the time.
Since then, however, inflation and interest rates have been on a steady decline, as we can see on the “Black Diamond” ski slope downward on the right-side of the interest rate chart above.
But interest rates began declining in 1980. It’s 2021. We’re now 40 years into a 30-year cycle. We’re on borrowed time for when interest rates should be moving higher.
But what will this transition look like from a declining interest rate and inflation cycle to a rising one?
Slowly then Suddenly
One of the expectations right now is that inflation will hit us like a Mack truck. That’s a logical conclusion, given that lumber prices are four times higher than this time last year.
But this is a mistake that many people make when thinking about rising interest rates and inflation.
It doesn’t happen all at once, especially at the start.
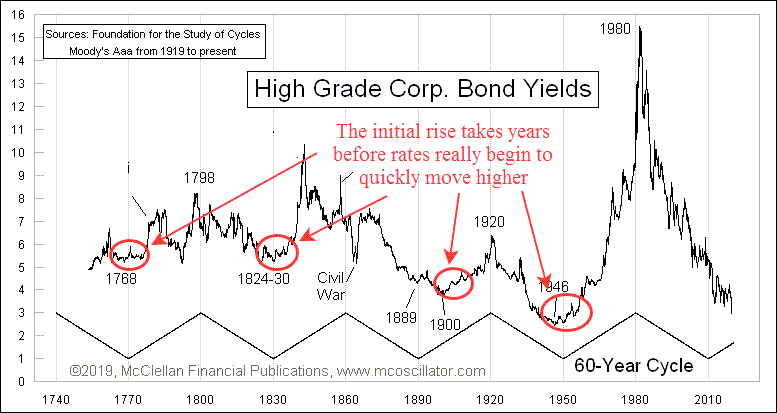
Let’s look at the same interest rate cycle chart, but focus on the beginning stages of each rising cycle. There have been four major turning points in the last 260 years, as noted on the chart below.

If we look at the red circles, interesting patterns starts to emerge. Rates don’t have any initial spikes higher at first. It takes time for long cycles like this to turn, much like steering a cruise ship.
In fact, we notice three distinct similarities in these periods of rising rates:
- In all four cycles it took 7-10 years for the first 1-2% rise in rates to occur.
- During this first 7-10 years, there are multiple “squiggles”, where rates take two steps forward and one step back. They ebb and flow like waves.
- Following the gradual rise, there is almost always a large spike higher in rates. Unfortunately, this has consistently been associated with a major, generational war.
If interest rates bottomed last year during the COVID crash, we are literally at the very beginning of this rise.
If the cycle of higher rates is indeed beginning now (which is our primary thesis), then we should still be a few years away from the period of rapidly rising rates.
But as with all things market-related today, the Fed is once again the wild card.
The Reckless Fed
We have discussed the Federal Reserve many times over the past few years. As recently as January in our “Twin Risks” report we discussed the possibility of Fed missteps. And last June’s “COVID vs the Fed“, we expected that the Fed would win when it came to rising asset prices, and that was indeed the case.
But even with improvements in economic conditions and the pandemic seeming to be much more under control with the highly effective vaccines, the Fed continues to print and print and print some more.
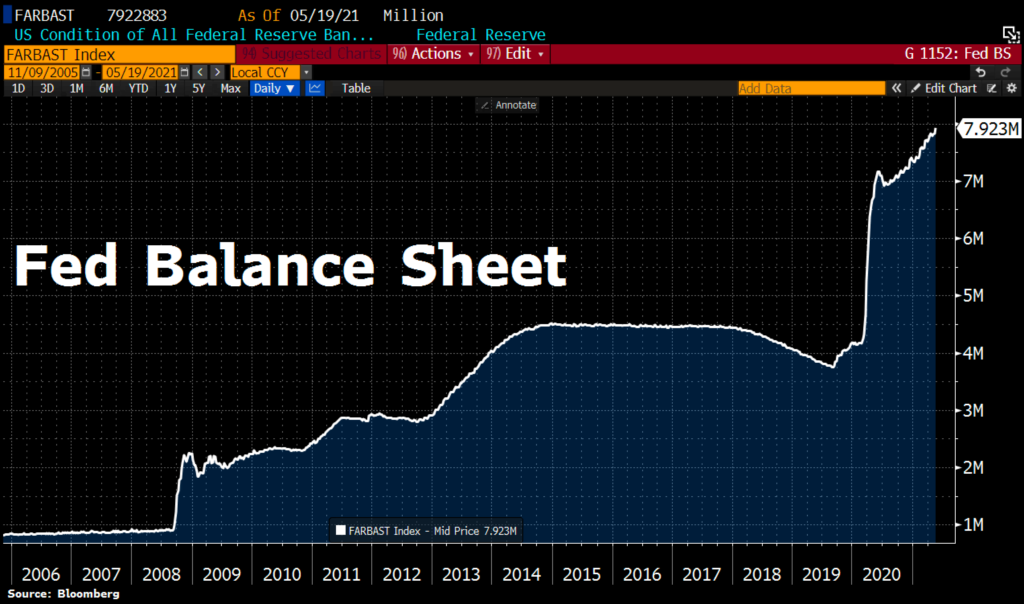
In our next chart below, we can see that the Fed balance sheet continues to expand dramatically.

The spike higher in 2020 was the obvious and appropriate response to the COVID lockdowns. However, since late last year, the Fed has printed another $1 Trillion and force-fed it into the financial markets like a goose being primed for foie gras.
Last week alone the Fed printed nearly $100 Billion. All while the economy is obviously recovering and financial markets are at all-time highs.
During COVID, it was logical for the Fed to step in. Now? Frankly, it doesn’t make any sense.
It seems like we now have the first ingredients of a misstep. Continued massive monetary expansion WILL eventually have unintended consequences. What we don’t know is when the consequences will show up and what exactly those consequences will be.
The Fed is obviously signaling that it wants inflation. It is showing up all over the economy. Yet, the “official” inflation numbers are low.
Following the further injections of liquidity into the markets, pretty much every asset has risen in price (predictably). Some assets have risen more than others, but for the most part they all have gone up.
This simply can’t continue indefinitely. As Howard Markes says, “Trees don’t grow to the sky”. Everything works in cycles, especially asset prices.
And if everything works in cycles, and we are in a cycle where everything went up, what do we think might be next?
Well, it could be a cycle where everything goes down. But more likely it will be a cycle where instead of everything performing in unison, it could be a cycle where nothing performs in unison.
Which brings us to our second major theme for the coming decade: the return of dispersion.
What is Dispersion?
The official definition of dispersion, as it relates to our purposes here, is “the extent to which values of a variable differ from a fixed value such as the mean.” 1
Okay, so what does it mean in non-statistical terms?
It means that everything won’t go up at the same time.
It comes from the root word “disperse”. As when police officers instruct a crowd to go about their separate ways.
For our purposes, it means there will be areas of the financial markets that perform very well over the next 10-20 years, but there will also be many assets that decline in price as well.
In the definition above, the “values of a variable” simply mean different parts of the market. The “fixed value such as the mean” is the index.
So if the performance of S&P 500 is the “mean”, the underlying stocks and sectors within the market are the variables.
We would not be surprised if broad markets didn’t perform very well in the coming cycle. They could easily have flat or even negative returns over the next decade.
But that doesn’t mean you can’t make money. The “mean” is the average. But underlying that average are components that went up in price, and components that fell in price.
Since the early 1980’s, nearly every asset class has been in a bull market. Outside of the bear markets in 2000 and 2008 (and the COVID crash last year), stocks in general moved higher.
Guess what? So did bonds, commodities, homes, office buildings, international stocks, gold, and just about everything else on the planet as well.
Everything went up. The only difference was how much each investment went up.
And it makes sense that they all went up. As we noted earlier, both interest rates and inflation have been steadily declining since the early 80’s.
Declining interest rates almost always help asset prices go up. After all, many things are purchased with debt. Real estate is the most common use of debt to finance an acquisition, but debt is also used for all sorts of different financial activities. It is used to acquire companies, both large and small. And to build manufacturing facilities. And to purchase stocks. And to improve infrastructure. And to build high rises.
As interest rates fall, the cost of debt decreases. And that gives a purchaser the ability to buy more real estate, companies, manufacturing facilities, etc.
The opposite is also true.
As interest rates rise, the cost of debt increases. It takes away the purchasing power of everyone, from your new neighbor to the federal government.
This is why the Fed is so hell-bent on keeping interest rates low. And for a while now they have been successful.
But as we mentioned above, they can’t keep doing that forever. So we must start to think about what the next cycle may hold so we can make sense of the signals we may get from our investment process.
What Assets may Benefit from Rising Rates?
This is the $64,000 question. And if you’ve followed our reports at all, you probably know our answer. We have no idea.
While our investment process is designed to pick up on these changes over time, let’s look at some key characteristics of assets that could benefit from higher rates and inflation.
Pricing Power
In an inflationary environment, the costs of goods go up. That means that companies who are selling those goods are selling them at higher prices. Which naturally means that the revenue to these companies are also going up. Granted, input costs also rise, but if they can pass along higher prices to their consumers, it means they have pricing power.
Pricing power is critical to a company being able to successfully keep profit margins at current levels, and even being able to increase their margins. Without pricing power, companies have to increase efficiency or reduce costs to maintain profit margins.
Many companies will not be able to keep profit margins at current levels. The companies that can’t will likely have their stock price suffer.
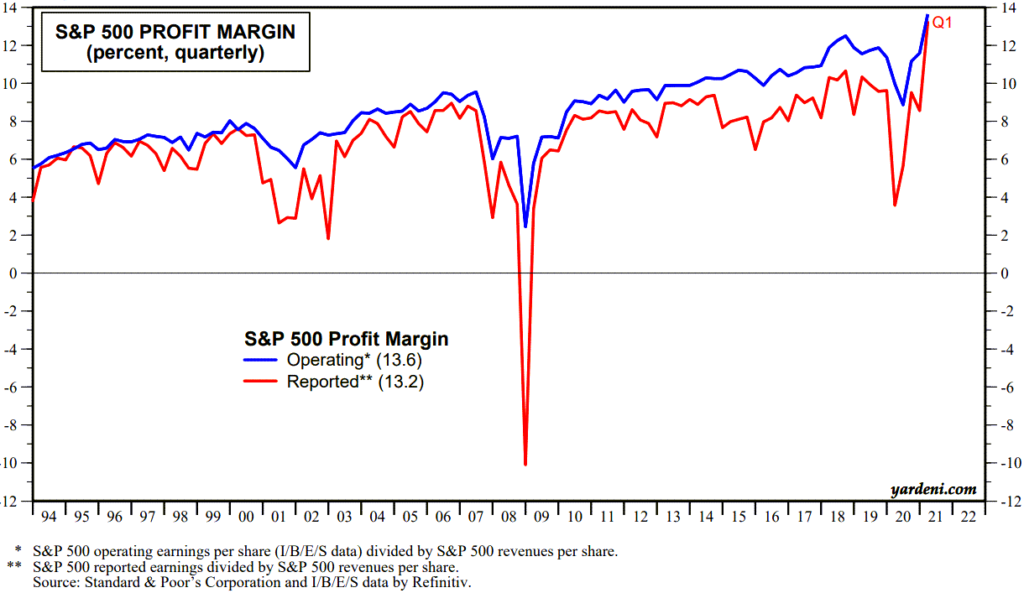
The next chart shows that profit margins on the S&P 500 are at all-time highs.

As we discussed in our previous report “The Icarus Market“, we discussed how P/E ratios were elevated due to the increased concentration of technology stocks in the S&P 500 Index.
This also applies to profit margins.
Technology companies tend to have both higher profit margins and P/E ratios. So as technology becomes a larger portion of the index, profit margins should naturally increase.
To assume that profits margins can stay at these elevated levels seems like an optimistic assumption. And if they can’t stay at these levels, it is most likely due to tech not being able to keep pace.
Low Reliance on Debt
Another characteristic of a potentially good investment is a low reliance on debt.
As we discussed above, as interest rates rise, so does the cost of capital. Companies with lower debt loads, companies not dependent on financing activities to support their business, and recipients of higher interest rates could all benefit.
Banks are one area that may do well. Most banks make money off of a spread. They pay you nothing on your savings account, but charge you interest to take a loan. The difference in what they pay versus what they receive is called the “Net Interest Margin” or NIM.
As interest rates go up, their NIM should also go up. Because they are quicker to pass along higher rates to you as a lender than they are to you as a saver. Be prepared for continued frustration for a few years if you’re expecting the yield on your savings account to go up much.
But the big banks are turning into dinosaurs. There are many companies looking to disrupt this industry, so it may be areas in the financial sector outside of the behemoth banks that ultimately do well.
Other investments are much more dependent on debt. Real estate, for example, is one such asset.
Traditionally, real estate is expected to benefit from inflation. But it is also hurt by higher rates. So the dynamic between the inflation waves and the interest rate waves is key when it comes to housing prices.
We’re seeing home prices skyrocket now, partially due to demand, but also due to the fact that inflation is starting to appear, but higher interest rates are not.
So when inflation rises and interest rates stay low, home prices should continue to rise. But in our wave theory, there will be periods where inflation goes down and interest rates go up. That would not be favorable for real estate, and may provide opportunities to increase exposure to real estate.
This is exactly what we are talking about with the coming inflation and interest rate waves.
Stuff
The last area that may benefit is simply “stuff”. Commodities, materials, lumber, chemicals, and many other things that are used in real life things.
The reason these areas do well is the mindset of consumers during inflationary periods. The expectation is that what you are buying today is going to cost much more next year. So while it is more expensive than it was a year ago, it’s probably going to be more expensive next year. So you might as well buy it today.
As this mindset permeates the economy, the prices of stuff get more expensive. At first, higher prices tend to self-correct.
Earlier this month, the price of lumber fell 30% in a couple of weeks. It had gone up so much that people simply stopped building that new home. So prices corrected.
In this first inflation wave, this is expected. We also expect that it won’t get down anywhere close to the prices from last year. Prices will fall, and people will start to build again. And the next wave higher begins.
Alternate that same behavior over the coming years and we have the exact scenario we are describing…waves of inflation that gradually get higher over time. Until BANG! inflation is out of control, and we go into the steepening phase of the cycle.
Bottom Line
It simply appears that we have begun the next cycle of higher interest rates and inflation.
While it will likely take many years before it starts to get out of hand, there are easy ways to prepare yourself for this environment.
- Make sure any debt you have is at a fixed rate. Expect to pay more interest on new debt as time goes by. There is plenty of time to prepare, but now is the time to think about and prepare for higher rates.
- Dispersion favors active management. We’ll discuss this more in the future, but passive index investing and broad asset diversification is likely to be a poor choice in the coming market cycle. Your portfolio must become more focused.
- Re-evaluate your income strategy. Bonds are likely to be the worst performing asset over the coming years, unless we see an outright market collapse. You will need to be very tactical with your bond strategy. Cash rates will eventually move higher, but likely slower than we think.
In the immediate future, however, we should expect higher prices. Given that the Fed is still recklessly throwing gallons of gas on a market that’s on fire, higher prices should be expected in the near term.
But we think that this reckless behavior by central banks ultimately will be viewed in a very negative light. Primarily because of the skewed asset prices it is creating now. But while the party is still raging, more spiking of the punchbowl seems fun. And for now, it is still working.
But as this new phase of rising inflation starts to take hold, the Fed will likely find it more and more difficult to keep asset prices afloat.
That’s when the waves of inflation start becoming bigger and bigger until they simply can’t control it any more.
Our investment process was designed to handle any environment, including the ones that are most uncertain. Let us know if you would like to discuss this in more detail and how your portfolio may be affected.
Invest Wisely!
References:
- “Dispersion” definition from the Oxford English Dictionary online
