• Skip to main content
  • Skip to footer

IronBridge Private Wealth

Forward with Confidence

  • Home
  • Difference
  • Process
  • Services
  • Insights
    • IronBridge Insights
    • Strategic Wealth Blog
    • Strategic Growth Video Podcast
    • YouTube Channel
  • Team
  • Clients
  • Form CRS
  • Contact Us

fed funds rate

Et Tu Brute

May 4, 2023

In Shakespeare’s famous play “Julius Caesar”, a group of conspirators gather in the Roman Senate to assassinate the emperor.

Brutus was one of Caesar’s most trusted confidants.

He and the other murderers pull their swords and stabbed him to death on the Senate floor.

With his dying breath, Caesar looks on in shock and betrayal and utters the words “Et tu Brute”.

Across the country today, regional bank CEOs must feel the same betrayal.

Yesterday, the Federal Reserve raised rates an additional 0.25%.

The Federal Reserve is supposed to be the banking system’s most adamant supporter.

After all, their primary job is “financial stability”, and they are considered the “lender of last resort”.

Yet, they inexplicably betrayed the entire banking system with another unnecessary rate hike.

In the midst of an obvious banking crisis, Chairman Powell referred to the banking system as “secure and resilient”. In the past month, we’ve had 3 of the 4 largest bank failures in history. Ah yes, the epitome of strength and resilience for sure.

The primary problem in the banking system right now are deposit rates versus safe alternatives.

This banking crisis is NOT over by any means.

In fact, risks right now are higher than we’ve ever seen them.

Let’s look at the Fed, Regional Banks and the Commercial Real Estate market to assess risks.

The Fed’s Last Hike

In their meeting yesterday, the Fed left the door open to additional interest rate hikes.

Let’s be clear. We believe there is NO REASON for the Fed to hike again.  Whether they will or not is anyone’s guess.

They have yet to explicitly acknowledge it, but inflation is no longer the problem.

They are fighting a banking crisis that it nowhere close to being over.

Instead of pausing, Chairman Powell felt he had to project confidence in the financial system.

He was faced with a difficult choice:

  • Don’t raise rates, and risk markets interpreting that as fear over the health of the banking sector;
  • Raise rates, but risk making the banking crisis worse.

Powell woke up and chose violence.

In the world of instant public relations campaigns, not raising rates would have been an admission that the financial system has major problems.

Even if the system is weak, they can’t let the market perceive that they think the system is weak.

But if they raise rates (like they did), they all but guarantee more stress on the banking system by boosting rates on money markets, increasing the risk of deposit flight.

And if banks try to raise rates to slow the deposit outflow, they destroy any profitability they had.

In the end, the Fed decided to roll the dice and increase rates again.

Unfortunately, this will likely prove to be an incredibly poor decision.

In fact, markets are now pricing in a 15% likelihood that the Fed will CUT rates at their meeting in June. Not next year, but next month.

The chart below shows the implied Fed Funds rate through January of 2024.

The blue line (and left side of the chart) is the expected interest rate on the date along the x-axis. The orange bars (along the right side of the chart) is the number of expected cuts by next January.
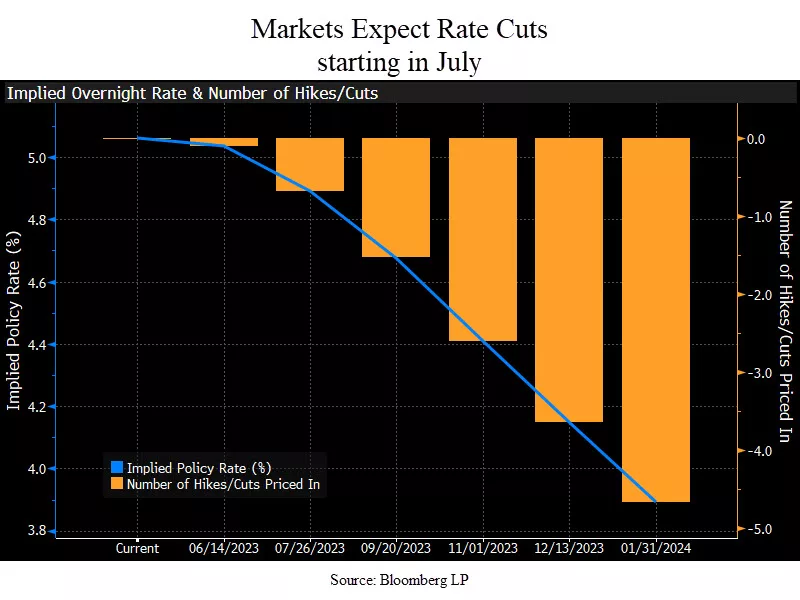
Fed Funds implied interest rate for the remainder of 2023. Number of rate cuts and projected interest rate decreases.

Markets expect 4.5 interest rate cuts this year, and the rate to go from 5.25% down to 3.9%.

This is quite extraordinary given that the Fed raised rates YESTERDAY.

It firmly implies that markets think the Fed made a huge mistake with this recent hike and that the economy is about to be very bad.

Let’s turn our attention to the regional banks next.

Regional Banks

Regional bank stocks are suffering massively.

3 of the 4 largest bank failures in history have occurred in the past month, and there are more to come, likely this weekend with Pac-West Bank. It won’t be the last.

The next chart shows the ticker KRE, which is an ETF comprised of regional banks.
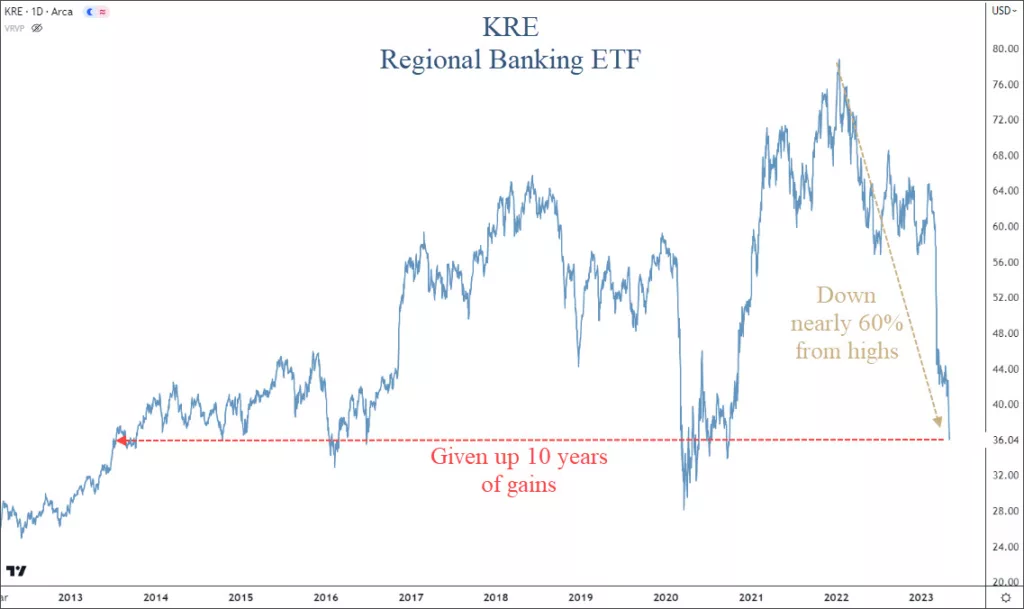
Regional bank stocks are down almost 60% since their highs last year.

They have also have given up ten years of gains. This is simply astonishing.

What this tells us is that the market thinks the banking crisis is much more urgent and important than inflation.

We agree.

Commercial Real Estate

Economic data is weakening. Fast.

Bank lending is one of the biggest contributions to economic growth. We live in a time where loans are the backbone of the US economic engine.

There has been more than $2 trillion of outflows from smaller banks over the past month.

If you are a bank CEO, do you think you would be aggressively handing out loans right now?

No.

You’re keeping all the reserves you can, hoping your customer base is loyal.

Lending standards were tightening before the banking crisis began. Now that it is accelerating, the problems will begin to spread.

The biggest area of concern for us is in commercial real estate.

Let’s look at some stats:

  • 67% of all commercial real estate loans were made by smaller banks.
  • 83% of all CRE loans are balloon notes. This means they mature and the owner is forced to do something (refinance or sell the property).

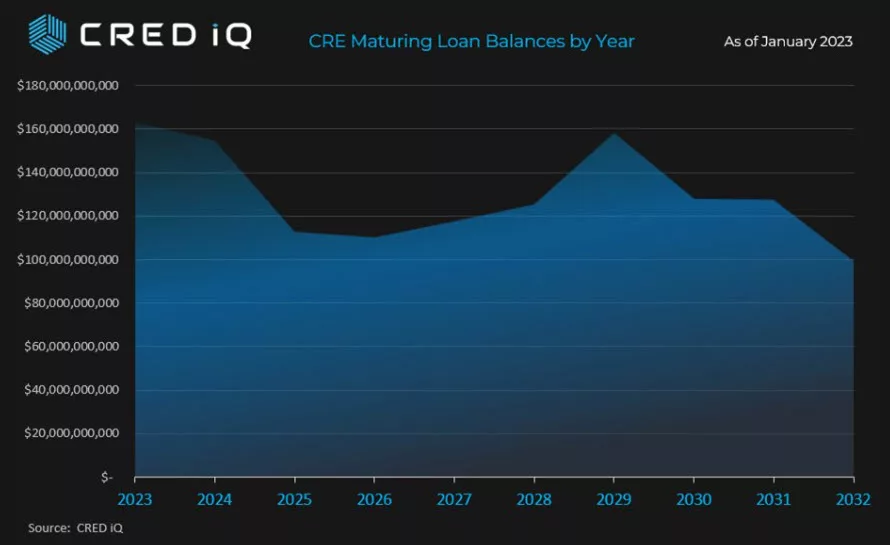
In the next two years, over $300 billion of CRE loans mature, as shown in the chart below from CRED IQ.
We must keep in mind that commercial real estate is a diverse market, and not all properties are created equal.

There are some areas of strength:

  • Manufacturing facilities are moving back to the U.S. from overseas, creating support for industrial space.
  • Grocery-anchored shopping centers (with an HEB for example) are doing quite well.
  • Senior-housing facilities are poised to benefit from aging demographics.

But these are relatively small areas in the CRE market.

Currently, these smaller and mid-size banks are dealing with a liquidity crisis.

They may start to face problems with their balance sheet. This would be an entirely different ballgame.

Bottom Line

Risks are incredibly high right now.

Despite that, markets have been relatively calm.

The next few months are perhaps the most important months of the past decade.

If we can get through them with relatively little damage from an economic and earnings standpoint, there is a chance that we avoid some very bad scenarios.

Until then, it is appropriate to err on the side of caution.

IronBridge clients continue to be extremely below their target risk, with elevated holdings in cash equivalents and various short-term high-quality fixed income holdings.

We anticipate that will continue, but as always we will continue to monitor markets for signals to add risk where appropriate.

Please do not hesitate to reach out with any questions.

Invest wisely!

Filed Under: IronBridge Insights Tagged With: bank run, banking crisis, commercial real estate, fed funds rate, federal reserve, interest rates, jerome powell, markets, volatility

Don’t Fight the Fed

September 21, 2022

The Federal Reserve met today and increased interest rates by 0.75%, as expected.

Stock markets were volatile all day, and ended up down almost 2%. So maybe it wasn’t so expected after all.

As we have consistently said in communications over the past few months, risks are very high right now.

Today didn’t do anything to change that in either our signals or our minds.

We’ll keep it short and to the point today, and let charts do most of the talking, but let’s do a brief portfolio update first.


Portfolio Update

Client portfolios are VERY conservative.

We have continued to reduce equity exposure in all portfolios, and we have added equity hedges to portfolios as well.

If markets continue to fall, your portfolio should remain very stable. We cannot eliminate risk, so there will always be fluctuations. But we have minimized those to properly handle the current environment.

We firmly believe this to be the proper course of action at this point.

As always, markets can change. If we get signals to increase risk, we will not hesitate to do so.


Yield Curve

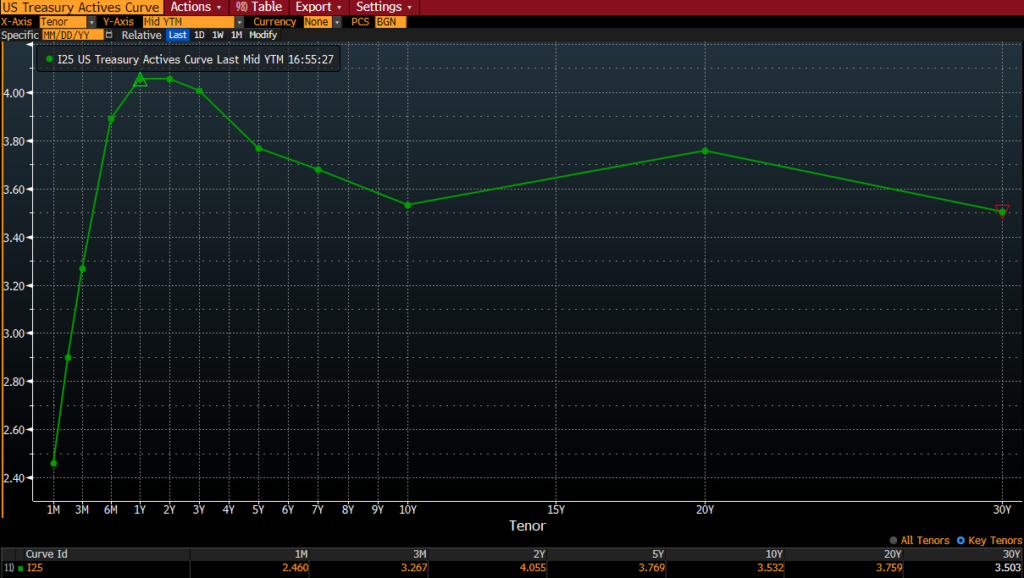
The Yield Curve remains inverted. This means that short-term rates are higher than longer term rates. The yield curve is more inverted than it has been in almost 50 years.

US Treasury Yield Curve is inverted

Why does the yield curve get inverted in the first place?

There are two main reasons:

  • Short-term rates are mostly set by the Fed. They have been steadily increasing rates all year.
  • Longer-term rates are set by the market. When there are concerns about economic weakness, money flows into longer-term treasury bonds.

Longer-term yields have been relatively stable the past few months, while short-term rates have risen dramatically.


Inverted Yield Curves Lead to Recessions

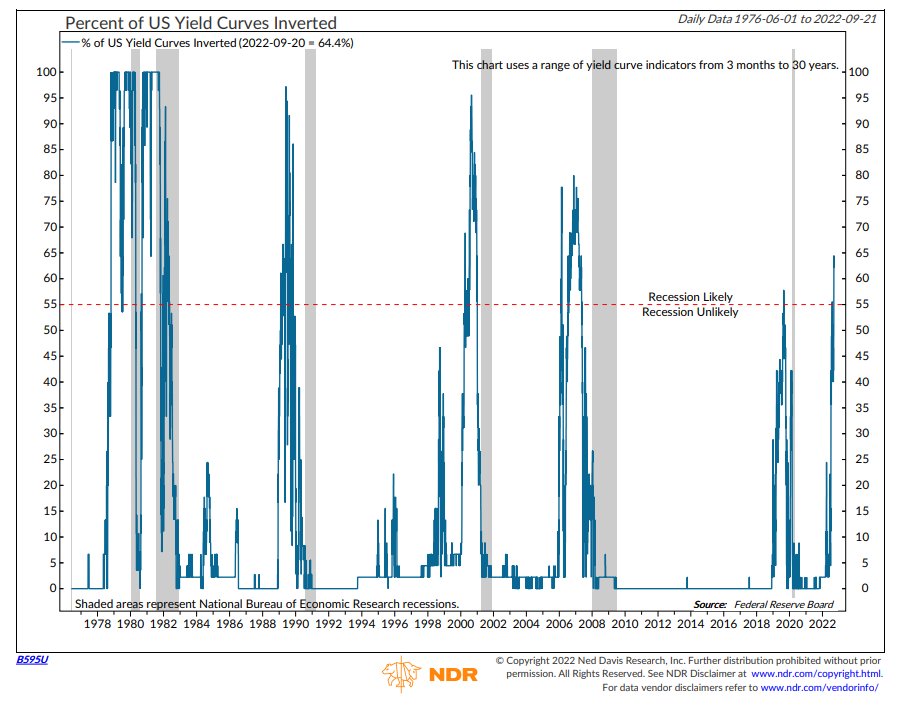
As we have mentioned numerous times this year, an inverted yield curve has been an excellent indicator of recessions.

The next chart shows the percentage of the yield curve that is inverted (blue line), with recessionary periods in gray.

The percentage of the yield curve that is inverted simply looks at various maturities and counts whether the short-term rate is higher than the long-term rate. (3-months vs 2-years, 3-months vs 5-years, etc.)

When more than 55% of the yield curve becomes inverted, it has ALWAYS preceded a recession. We are now at 65% of the yield curve that is inverted.


The Fed’s Dot Plot

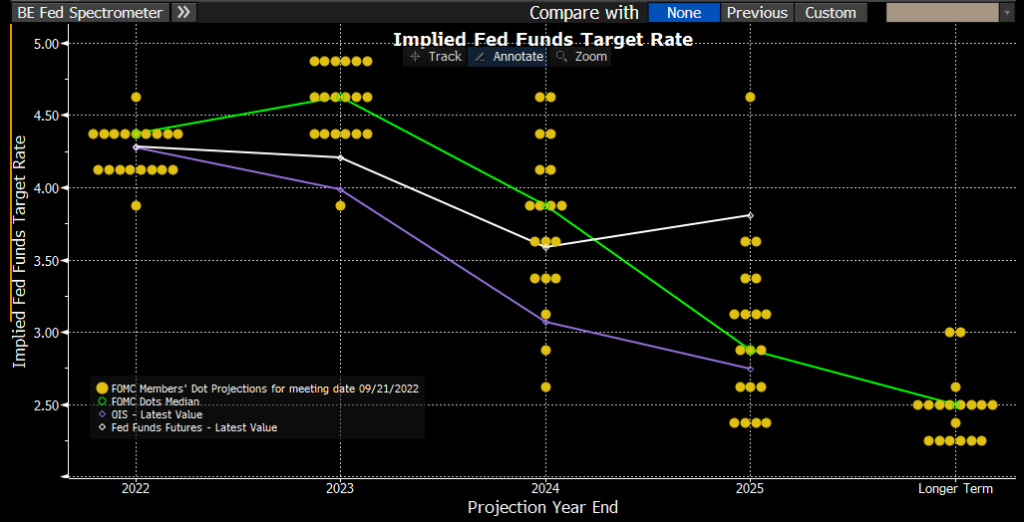
This is a bit of a complex chart, but it shows how each member of the Federal Reserve Committee sees future interest rates.

This shows that the majority of Fed members believe they will hike rates to somewhere between 4.5% and 5.0%. The target rate is currently 3.00-3.25%. (They use a 0.25% range when setting the Fed Funds rate).

So we can assume that there is likely another 1.50-2.00% of interest rate increases to come. This would likely be another 0.75% at the next meeting in October, followed by slightly decreasing hikes (0.50% then 0.25% at the following two meetings).

Things can change, but this is a good gauge of their thoughts.

It is also interesting to note that almost every Fed member is then projecting rates to fall in 2024 and beyond.


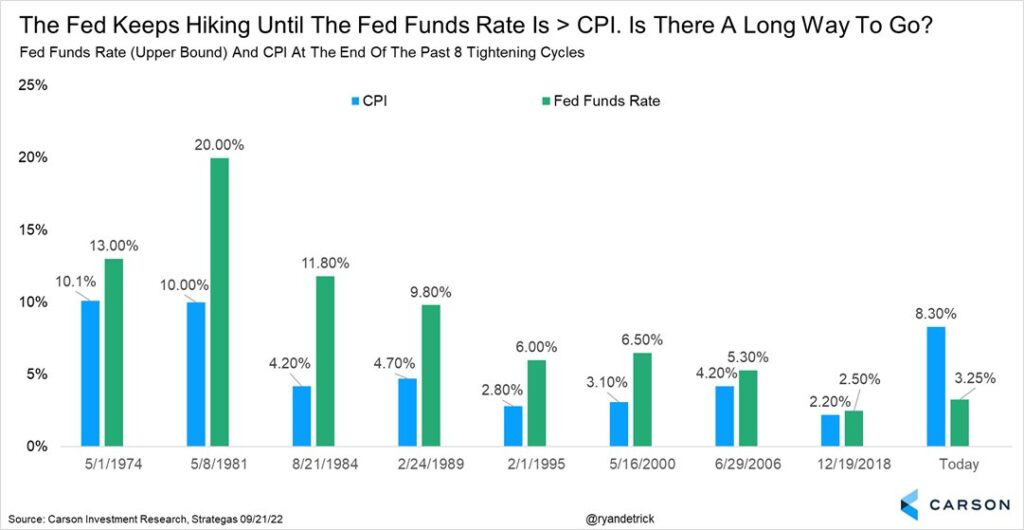
When has the Fed Stopped Hiking Historically?

Historically, the Fed stops raising rates when the Fed Funds rate gets above the inflation rate. There may be some time to go before that happens.


Bottom Line

Today’s developments do not surprise us.

The Fed has been crystal clear about wanting to slow the economy, slow wage growth, and remove speculation from markets (meaning lower stock and home prices).

They re-emphasized that today in no uncertain terms.

The Fed wants prices to fall. Don’t fight them, you won’t win.

The downside scenarios are large enough that it still makes sense to reduce risk if you haven’t done so already.

As always, please do not hesitate to reach out with questions or to review your individual circumstance.

Invest wisely!


Filed Under: IronBridge Insights Tagged With: fed funds rate, federal reserve, interest rates, inverted yield curve, markets, volatility, yield curve

Fed Raises Interest Rates: Implications and What We’re Watching

March 16, 2022

After reducing rates from 2.5% in 2019 to zero at the onset of the pandemic, the Federal Reserve has hiked rates by 0.25%. What does this mean and what should we be watching?

This was about as surprising as dropping a bowling ball on your foot and realizing it hurts.

While there are still MANY risks in the current market environment, this at least removes one uncertainty for now.

The Fed DID raise rates. They DID raise only a quarter-point. And they DID say they were going to raise more this year. (In fact, they hinted that they would likely have a rate increase at each remaining meeting this year).

What does this mean for the markets?

Frankly, not much.

  • Inflation won’t change with a single quarter-point rate increase.
  • Monetary policy isn’t going to change the global dynamics of the Ukraine war.
  • Global supply chains won’t change due to this.

Granted, the mainstream media will make it sound like this is the most important development in the history of mankind, and will bring on “experts” to discuss it ad nauseum. The markets have initially moved higher on this news, which is a good start.

But given the cross-currents around the globe affecting the markets, this interest rate increase is fairly minor in the list of things influencing prices.

As we’ve said many times, markets are extremely complex. Global politics are also extremely complex.

Combine the two and you have an enormous matrix of potential outcomes.

When that happens, it’s best to simplify.

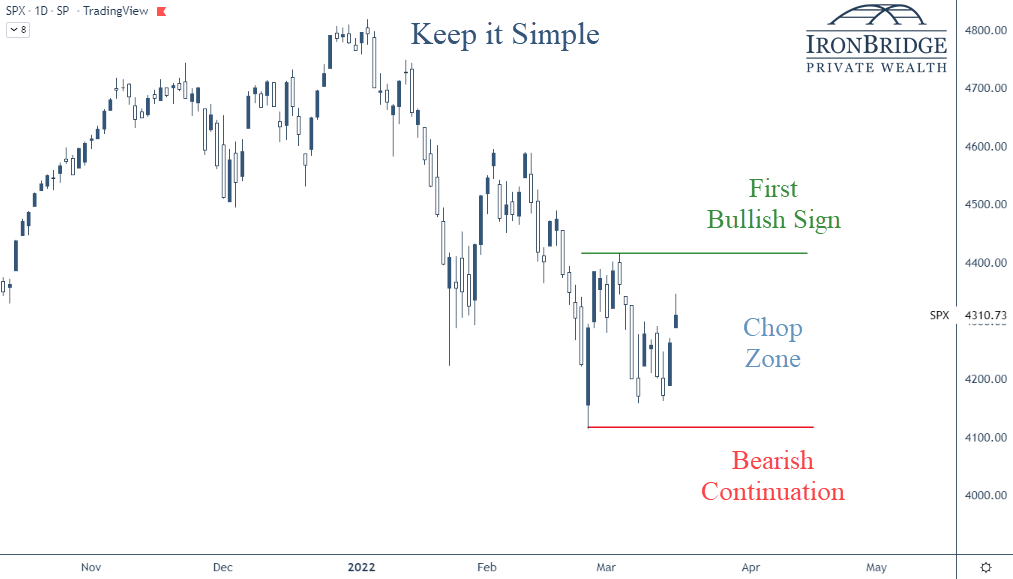
Here is a chart of the S&P 500 Index with the most simplistic view we can think of.


In this chart we show three basic scenarios:

  1. First Bullish Sign: If the market wants to move above the green line (the recent high from early March), then we would have the first sign that a trend change from down to up may be happening.
  2. Chop Zone: In between the green and red lines, there is very little reason to assume the market will ultimately move higher or lower.
  3. Bearish Continuation: If the market falls below the red line, then it is telling us that the volatility is not over and lower prices will follow.

So while we’re in this chop zone, we should consider the daily moves in the market to be noise.

Granted, when markets move 2% and 3% in a day, those are big moves. But until we see a move above or below the levels on this chart, it’s hard to become overly bullish or bearish.

Why do we mark these particular levels? Why might they be important?

Simple: We find it to be an easy way to determine the trend.

In downtrends, each time the market rallies, it stops at a lower level than where it stopped previously. For example, the all-time high was in early January. When it tried to rally in late January and early February, it stopped at a lower price than it was at the start of the year. The same thing happened in early March.

Each time it tried to rally, it made a “lower high”.

Having “lower highs” is the ultimate characteristic of a downtrend. And the market has definitely been in one since the first of the year.

The market can’t sustain a move higher if it doesn’t stop going down. (Thank you in advance for the Nobel Prize in Economics for that statement.)

On the flip side, if the trend of the market continues to move lower, it will make a new low in price below the red line.

That’s another characteristic of downtrends…lower lows.

We use more complex tools than this in our investment process. But this is one ways for you to think about the current market environment.

What are we Watching?

We’ll talk about this more in the coming weeks, but there are some major developments that we are watching right now.

I. Ukraine

This obviously remains the biggest wildcard and by far the biggest risk for markets.

So far, the market’s low (the red line in the chart earlier) occurred the morning of the invasion.

If we get a cease-fire, expect markets to respond favorably.

However, we need to be on guard for continued volatility and potentially lower prices if tensions escalate.

II. De-Globalization of the Economy

This is something we have been thinking about a LOT lately. We will discuss it in a future report as well.

One of the concerning outcomes of the sanctions imposed against Russia is that we have seen a shift to protectionism across the globe.

The globalization of the world economy that began post-World War II was designed to reduce the likelihood of another global war. The idea was that if countries were economic partners, they would have vested interests in maintaining peace.

So far, it has worked.

But since the sanctions were announced, multiple countries have decided to reduce trade. This has the potential to further reduce global supply of everything from oil to grains to semi-conductors.

Maybe these countries are simply responding to inflation and taking a temporarily cautious stance. If reduced trade is a temporary action, then things may go back to normal if inflation falls over the next few months.

However, if we are at the start of a longer-term cycle of de-globalization, there are many negative outcomes that could occur.

These include stubbornly high inflation, shortages of various goods, increased social unrest across the globe and a higher likelihood of more wars.

III. Stagflation

This is another topic we’ll discuss in a later report, but stagflation is becoming a real possibility now.

Stagflation occurs when inflation is high but the economy is in a recession.

It seems strange to think that it could occur in today’s world, but the possibility of stagflation is real.

IV. Market Recovery

We’re obviously watching risks, but not everything is bad right now.

Corporate earnings, for example, were at a record high last quarter.

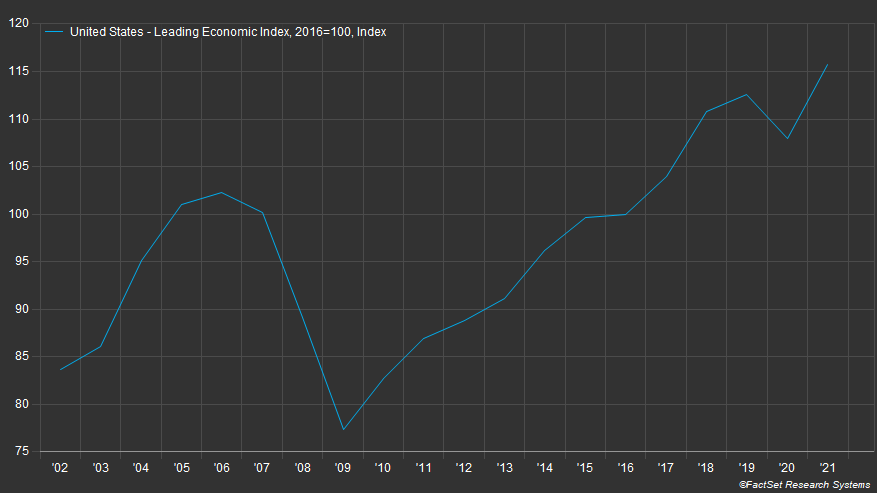
The Leading Economic Index (LEI), as shown in the next chart, is also at record highs.

This chart goes back 20 years.

One thing to not is that leading up to the financial crisis of 2008, leading indicators were showing signs of weakness. In fact, this indicator peaked in mid-2006, more than two years before things really unraveled economically in 2008.

Note: The leading economic index is made up of ten components, including hours worked, various manufacturing data, building permits, stock prices, yields and expectation for business conditions.

Further supporting the potential for optimism is that both corporate and personal balance sheets are strong, employment is good, and the housing market is on fire.

It will be important to see data that includes the Ukraine war, and what affect (if any) it has had on this data in the coming weeks and months. We will especially be watching the earnings reports closely that begin in early April.

So while there are many reasons to be pessimistic, there are reasons the market could recover and move higher for the remainder of the year.

Bottom line

Ultimately, the market price is what’s important.

Let’s keep watching these levels on the market to see if it can sustain a move higher, and we’ll adjust your portfolio accordingly.

Invest wisely!


Filed Under: Strategic Wealth Blog Tagged With: fed, fed funds rate, federal reserve, inflation, interest rates, markets, volatility

Ukraine War: Market Update

March 2, 2022

There is a LOT happening in markets this week. As we said in our email on Monday, this may be the most important week since the 2008 financial crisis.

Today we’ll discuss a few of the major issues we’re watching:

  • Sanctions against Russia (the Financial War)
  • S&P 500
  • The Fed

As a note, we’ve put together a series of resources that we have been tracking, which you can reference here:

Ukraine War: Informational Resources

Let’s get started.


Sanctions against Russia (aka, the Financial War)

Once Russia invaded Ukraine last Thursday, the U.S. and the European Union announced a series of initial sanctions against Russia and various Russian companies. These sanctions were quick and were very coordinated among nations.

This immediately caused Putin to fight three separate wars: a military one in Ukraine, a financial war with the global financial system, and a war of perception at home.

Let’s focus on the financial war.

Frankly, once the initial sanctions were announced last week, we perceived them as basically useless.

Nearly every one allowed the entities and individuals sanctioned a 30-day window to comply with the sanctions. This meant that they weren’t going to take effect until potentially AFTER the war was over.

However, over the weekend, the sanctions became much more punitive.

They were also universally approved by the US, European Union, and the UK. Other countries such as Switzerland, Australia, Japan, New Zealand and Taiwan have all made their own sanctions against Russia as well.

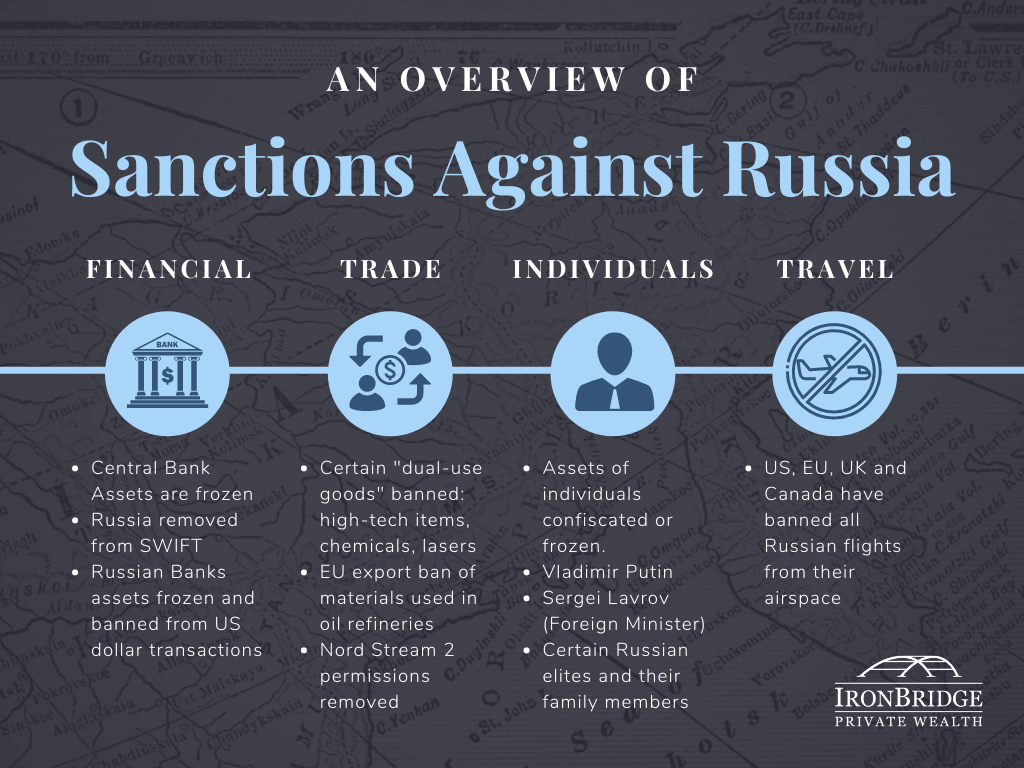
There are essentially four types of sanctions being imposed:

  • Financial
  • Trade-Related
  • Sanctions on Individuals
  • Travel

Here’s our overview of these sanctions:

All of these sanctions have two goals:

  1. Punish Russia financially by freezing financial resources and removing them from the global financial system.
  2. Turn global and Russian sentiment against Putin.

So far these are working well in the short time they have been in effect.

Russia has $640 billion in foreign reserves that have now been frozen. The war is costing them approximately $20 billion per day. By most estimates, Russia has $200 billion of unencumbered assets within Russia that have not been frozen by sanctions.

That means that financially, Russia could possibly run out of money in 10 days.

We shall see, but the initial response is that the sanctions have indeed put Putin in a tough situation.

But what impact has the war had on the stock market?


S&P 500 Index

Historically, when wars begin, the stock market tends to bottom near the time of the initial invasion. This has been true for every major war since the Germans invaded Poland at the start of World War II.

So far, markets have responded to the Russian/Ukraine war as markets historically have done…by rallying higher against almost every ounce of common sense any of us possess.

As of today (March 2nd), the low point of the market happened on Thursday, February 24th. This was the day that Russia invaded Ukraine.

Since then, the S&P 500 is UP nearly 7%.

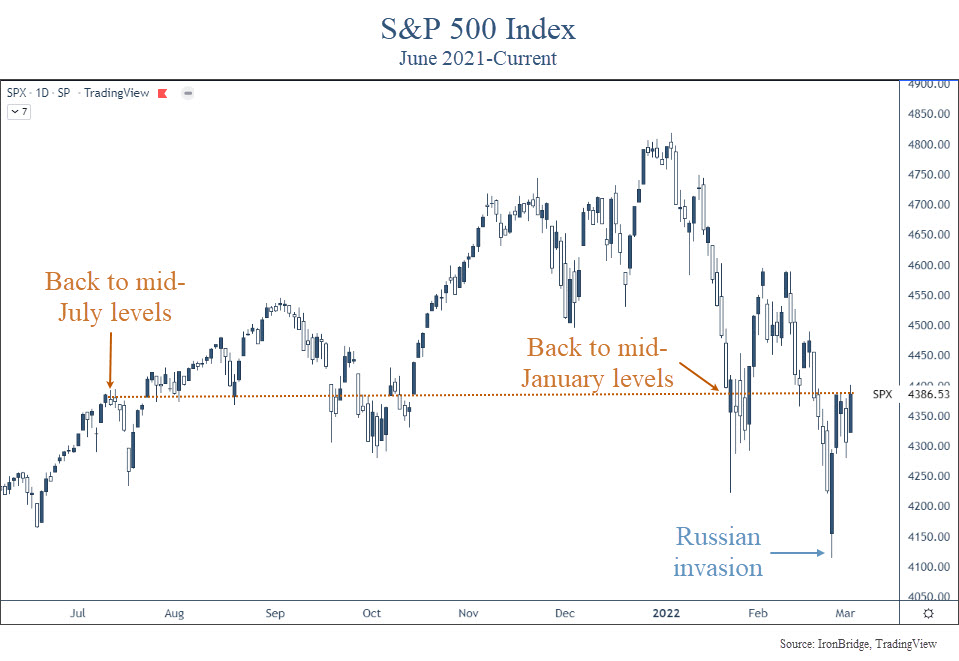
The chart below shows the S&P 500 Index since last June.

The first thing we notice is that the low point of the market thus far was immediately following the invasion. Despite the onset of this war, markets are essentially the same place they were in mid-January.

The second thing we notice is that the market was down “only” 2% the morning of the invasion.

That sounds like a lot, but relative to the volatility that occurred during the COVID crash, when markets moved nearly 10% any given day, a 2% move isn’t overwhelmingly bad. Especially given the fact that many people think this could lead to a nuclear war.

However, during the COVID crash, and also during the bear market of late 2018, markets regularly moved 2% a day.

But this pullback feels worse, doesn’t it?

That could be because we have been lulled to sleep by a very calm market in the past couple of years. It also could be that the risk of nuclear war seems like a reality for the first time in decades, which is obviously nothing to ignore.

Either way, people in general seem to have a more negative feeling towards these developments.

While the invasion itself didn’t cause much volatility, markets definitely anticipated volatility prior to the onset of this unnecessary war.

In fact, the S&P 500 was down 14% from peak-to-trough intraday in 2022, while the Nasdaq and Russell 2000 were both down over 20% peak-to-trough.

Does the fact that we didn’t see much volatility since war began mean we’re in the clear?

The answer is both “maybe” and “absolutely not”.

There are a number of positives that could result in a strong market if the Ukraine war comes to a peaceful and quick resolution:

  • The economy is strong.
  • The consumer is strong.
  • The Fed is now likely to slow down their pace of interest rate increases, resulting in continued support of financial markets.
  • The world is unified against Russia, making a coordinated effort to overcome the fallout from sanctions more economically and politically realistic. (Supplying Europe with gas from the US, for example.)

So if we get a peaceful resolution, there are reasons to be optimistic.

However, the elephant in the room is Putin. More accurately, he is the wild animal who is cornered and scared.

Dictators have one goal: to remain in power.

And Putin’s reputation has been greatly diminished both globally and domestically.

If he can’t get out of this situation peacefully, save face, and retain power all at the same time, there is no telling what he might do. And this is the risk we all fear.

Let’s refocus on the financial markets.

Prior to the Ukraine mess, the markets were selling off because concerns on inflation and the speed at which the Fed might act.

What should we expect from the Federal Reserve now?


The Fed

What might the fed do now?

The easiest way to look at this is what the anticipation of Federal Reserve rate hikes might be.

The next chart, from Bianco Research, shows the probability of Fed rate hikes at each upcoming Fed meeting.

Here’s how to read this table.

On the top left, the FOMC Meeting on 16-Mar-22 shows (from left to right across the table) a 100% probability of a hike of 0.25-0.50%, a 21% probability of a 0.50-0.75% hike, and so on. (FOMC stands for “Federal Open Market Committee”)

This tells us that the market is now pricing a 0.25% hike in March, and a total of four rate hikes this year.

Three weeks ago, there was a probability of over 90% of a 0.50% rate hike in March, with 6-7 hikes likely this year.

So the Ukraine situation is causing the Fed to pause slightly, at least for now.

That could create a tailwind for stocks as well.

But they are definitely behind the curve.

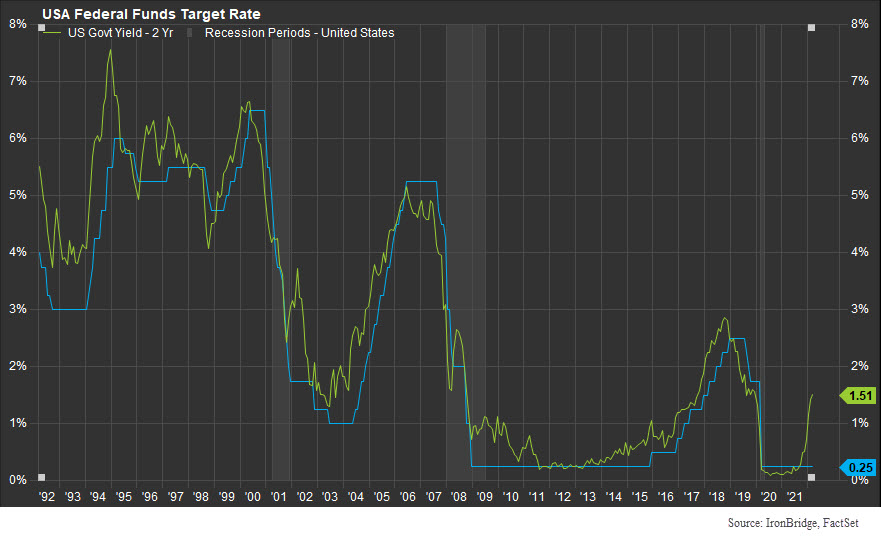
For the past 30 years, the Fed Funds rate has essentially mirrored the 2-year US Treasury yield, as shown in the next chart.

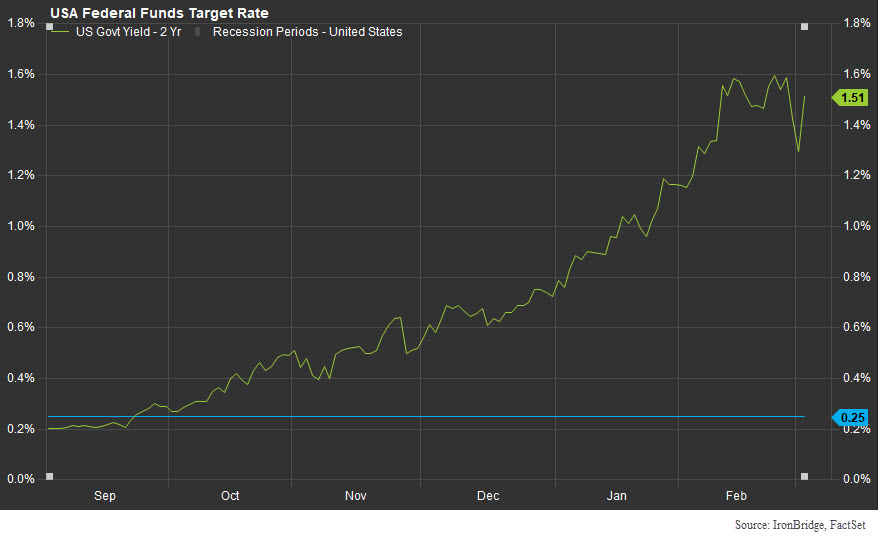
But if we zoom in to the recent rise in the 2-year Treasury yield, we see just how far the Fed needs to go to catch up.

Six months ago, these rates were the same.

Now, the Fed would need to hike 6 times to catch up to the 2-year yield.

This is their dilemma.

The other thing to note on the chart above is that the 2-year Treasury yield barely moved in response to the Ukraine war.

Globally, investors have not been moving into safe havens like we would normally expect.

Bottom line, we are not seeing the type of volatility that we would probably expect in a conflict with the implications of this one.

That leads us to believe one of two things will happen:

  1. Markets are correct. This implies that the Ukraine conflict will come to a conclusion within a week or two.
  2. Markets are unprepared. This implies that the real volatility is yet to come.

We don’t like to think about what happens in scenario 2.

But we must think through it and be prepared for any scenario, for that is our job as fiduciaries of your capital.

On Friday, we will give you a portfolio update and look at the specific levels on the markets that we are watching.

Invest wisely!


Filed Under: IronBridge Insights Tagged With: fed funds rate, federal reserve, fiduciary, investing, markets, russia, treasury yields, Ukraine, volatility, war

Footer

LET'S CONNECT

  • Email
  • Facebook
  • Instagram
  • LinkedIn
  • Twitter

AUSTIN LOCATION

6420 Bee Caves Rd, Suite 201

Austin, Texas 78746

DISCLOSURES

Form ADV  |  Privacy Policy  |  Website Disclosures

  • Home
  • Difference
  • Process
  • Services
  • Insights
  • Team
  • Clients
  • Form CRS
  • Contact Us

Copyright © 2017-Present by IronBridge Private Wealth, LLC. All rights reserved.